
Abstract
Objective:
Amyloid-β (Aβ) positron emission tomography (PET) imaging is essential for diagnosing and monitoring Alzheimer’s disease (AD). The Centiloid (CL) scale standardizes Aβ quantification across centers and tracers, but its limitations include calibration requirements and the inability to capture regional A| heterogeneity.
Methods:
The ComBat-Centiloid method harmonizes A| PET data without calibration by combining a 11C-Pittsburgh Compound B standard reference database with the ComBat algorithm and CL framework to generate harmonized CL (HCL) and harmonized regional CL (HRCL) values. Pearson correlation analysis was used to evaluate the relationship between HCL and CL values within the same tracer/protocol combinations. Paired t-tests were used to assess differences in HCL and CL values between two same-subject scans using different tracers taken within 1 year. Multicenter analyses were performed with combined datasets with different tracer/protocols to compare the consistency of HRCL, regional CL (RCL), and SUVR for differentiating patients with AD from cognitively normal (CN) individuals.
Results:
HCL values strongly correlated with CL across all tracer/protocol combinations and effectively eliminated inter-tracer biases, showing no significant differences in paired tests. In multicenter analyses, HCL values outperformed SUVR and RCL, demonstrating superior consistency for distinguishing patients with AD from CN individuals.
Conclusion:
The ComBat-Centiloid method eliminates calibration requirements and supports robust harmonized assessments in multicenter multitracer studies.
1 Introduction
Amyloid-β (Aβ) plaques constitute one of the core pathological features of Alzheimer’s disease (AD) [1]. As a non-invasive molecular imaging technique, Aβ positron emission tomography (PET) imaging is critical for early diagnosis, staging, and treatment evaluation in AD [2]. Several Aβ imaging tracers, such as UC-Pittsburgh Compound B (PIB), 18F-Florbetaben (FBB), and 18F-Florbetapir (AV45), have been developed to map the distribution of Aβ plaques in the brain. However, variability in tracers, scanning equipment, acquisition protocols, and data processing methods across laboratories limits the direct comparability of Aβ PET brain images. To overcome this challenge, researchers introduced the Centiloid (CL) unit, a standardized metric for quantifying Aβ plaque deposition in the brain [3]. The CL unit was created by setting the average Aβ load level of 45 typical AD patients to 100 and the average Aβ load of 34 healthy subjects under the age of 45 to 0. By applying standardized CL methods, the Aβ load of any subject can be linearly transformed into CL units. This enables consistent reporting of data across different tracers and equipment and supports cross-study and cross-center data sharing [3,4].
However, CL units have two limitations. First, if a center adopts a new amyloid tracer, or uses different acquisition modes or data analysis methods from those of the CL project protocols (see https://gaain.org/centiloid-project for the details of CL project protocols), a calibration process is necessary to obtain the corrected conversion equation [3]. This calibration requires recruiting at least 10 young healthy subjects and at least 15 subjects with a high likelihood of amyloid positivity. These subjects must undergo two amyloid scans within 3 months: one using the standard protocols from the CL project and the other following the research center’s protocols. This calibration process increases the experimental costs and creates implementation challenges. Second, as a standardized measure of Aβ deposition across the entire brain, CL units may obscure regional heterogeneity in amyloid distribution. Research shows that Aβ deposition varies significantly across brain regions [5], with this variability being closely associated with the pathological characteristics and disease stages of AD, and individual patient variability [6, 7].
In addition to CL units, researchers have proposed several other approaches for multicenter correction of PET imaging, including deep learning-based methods [8] and phantom-based techniques [9, 10]. Among them, a notable category involves statistical post-hoc image correction methods, most prominently the ComBat algorithm. The ComBat algorithm, a Bayesian statistical method for batch effect correction, has been widely adopted to harmonize data across research centers [11, 12]. This algorithm has been successfully applied to mitigate multicenter effects that affect various medical imaging features, including cortical thickness [13], fractional anisotropy (FA) and mean diffusivity (MD) from diffusion tensor imaging [14], functional connectivity [15], and PET image radiomics [16]. Furthermore, the ComBat algorithm was shown to reduce across-tracer biases in regional amyloid PET analyses [17]. Compared with the CL project, the ComBat algorithm offers the advantage of correcting multicenter data without requiring additional datasets and is particularly well-suited for regional-level harmonization. However, while both approaches aim to address the challenges of multicenter data harmonization, the CL project and other methods including ComBat differ fundamentally in their underlying principles and implementation strategies. The CL project provides a comprehensive framework for data harmonization, including standardized data processing workflows, standard PIB PET brain images, typical amyloid deposition global cortical target (CTX) volume-of-interest (VOI), and reference region masks for calculating standardized uptake value ratio (SUVR). These resources allow research centers to ensure data comparability across studies. By contrast, algorithms such as ComBat correct multicenter variability through statistical adjustment, aligning data to the overall mean of the specific analysis cohort. While both approaches aim to address the issue of multicenter data harmonization, data processed using ComBat are inherently cohort-specific and cannot be directly compared across studies, even if the same algorithm is used.
To make amyloid burden data reported by different research centers comparable, this study proposes an alternative method to the CL project, which we have termed the ComBat-Centiloid method. This approach was started by collecting a batch of subjects and acquiring PIB PET brain images using the same acquisition and data processing protocols as those employed in the CL project, forming what we refer to as the PIB standard reference database. Subsequently, typical amyloid deposition regions were identified on the basis of the CTX VOI in the CL project. These regions, comprising brain regions from the Desikan-Killiany (DK) MNI atlas [18], are termed the cortical summary (CTS) region. SUVR values were then calculated for each brain region and the CTS region within this database, and a linear fitting process was used to establish a conversion relationship between CTS SUVR and CL values. For research center data, alignment with the PIB standard reference database using the ComBat algorithm allows use of an established conversion relationship to derive an index comparable to CL without the need for additional subject recruitment. We refer to this index as the harmonized CL (HCL). To validate the HCL as a quantitative parameter for brain Aβ levels, we first assessed its ability to represent overall amyloid deposition in individuals. To this end, we analyzed four subsets: AV45 and FBB PET data from the ADNI database, and AV45 and PIB PET data from the OASIS-3 database. For each image, we first calculated both CL and HCL values and verified their correlation within each subset. We then evaluated whether HCL could mitigate biases introduced by different tracers. For this, we selected subjects who underwent two Aβ PET scans using different tracers within 1 year, and compared the differences in their HCL and CL values. Lastly, we examined whether HCL could improve consistency in multicenter data analysis. To achieve this, we combined data from different subsets, calculated the differences between AD patients and healthy controls for each combination, and assessed whether these differences were consistent across combinations.
2 Methods
2.1 Amyloid PET Imaging Data
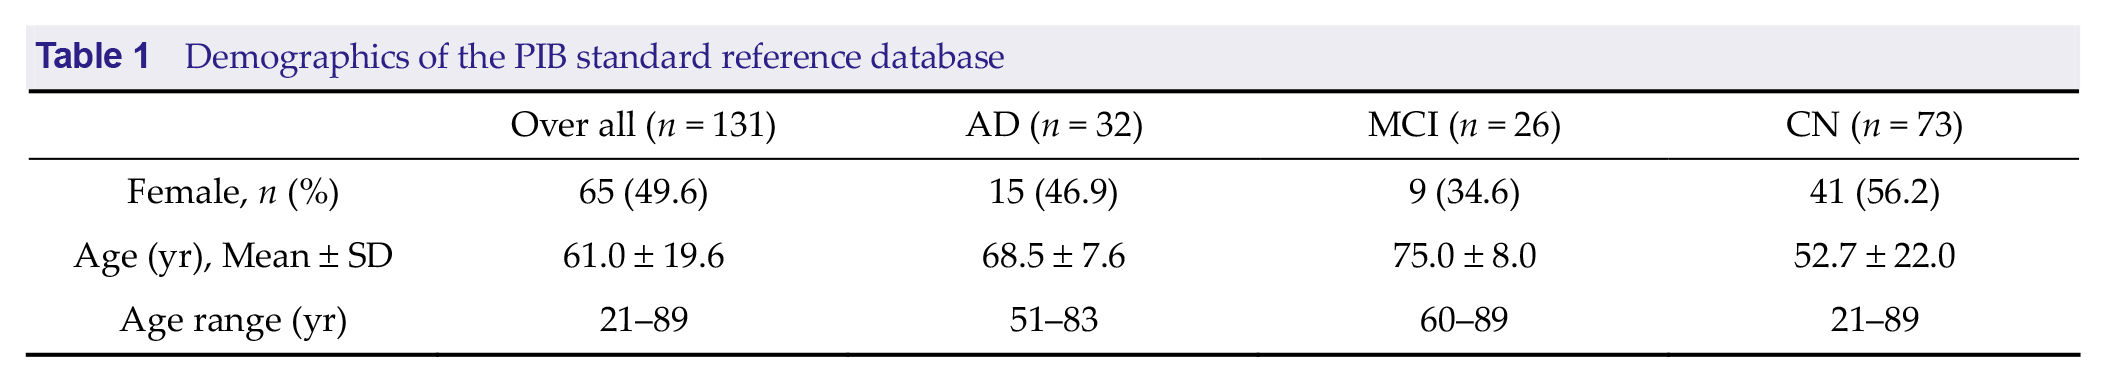
This study used two sets of amyloid PET brain imaging data. The first dataset, referred to as the PIB standard reference database, comprises brain images acquired 50-70 minutes after PIB injection, following scanning protocols consistent with the CL project [3]. This database includes 131 subjects: 32 with AD, 26 with mild cognitive impairment, and 73 considered cognitively normal (CN) (see Table 1 for demographic details). All data were sourced from previously published studies [4, 19, 20] and are available for download at https://gaain.org/centiloid-project.
Demographics of the PIB standard reference database
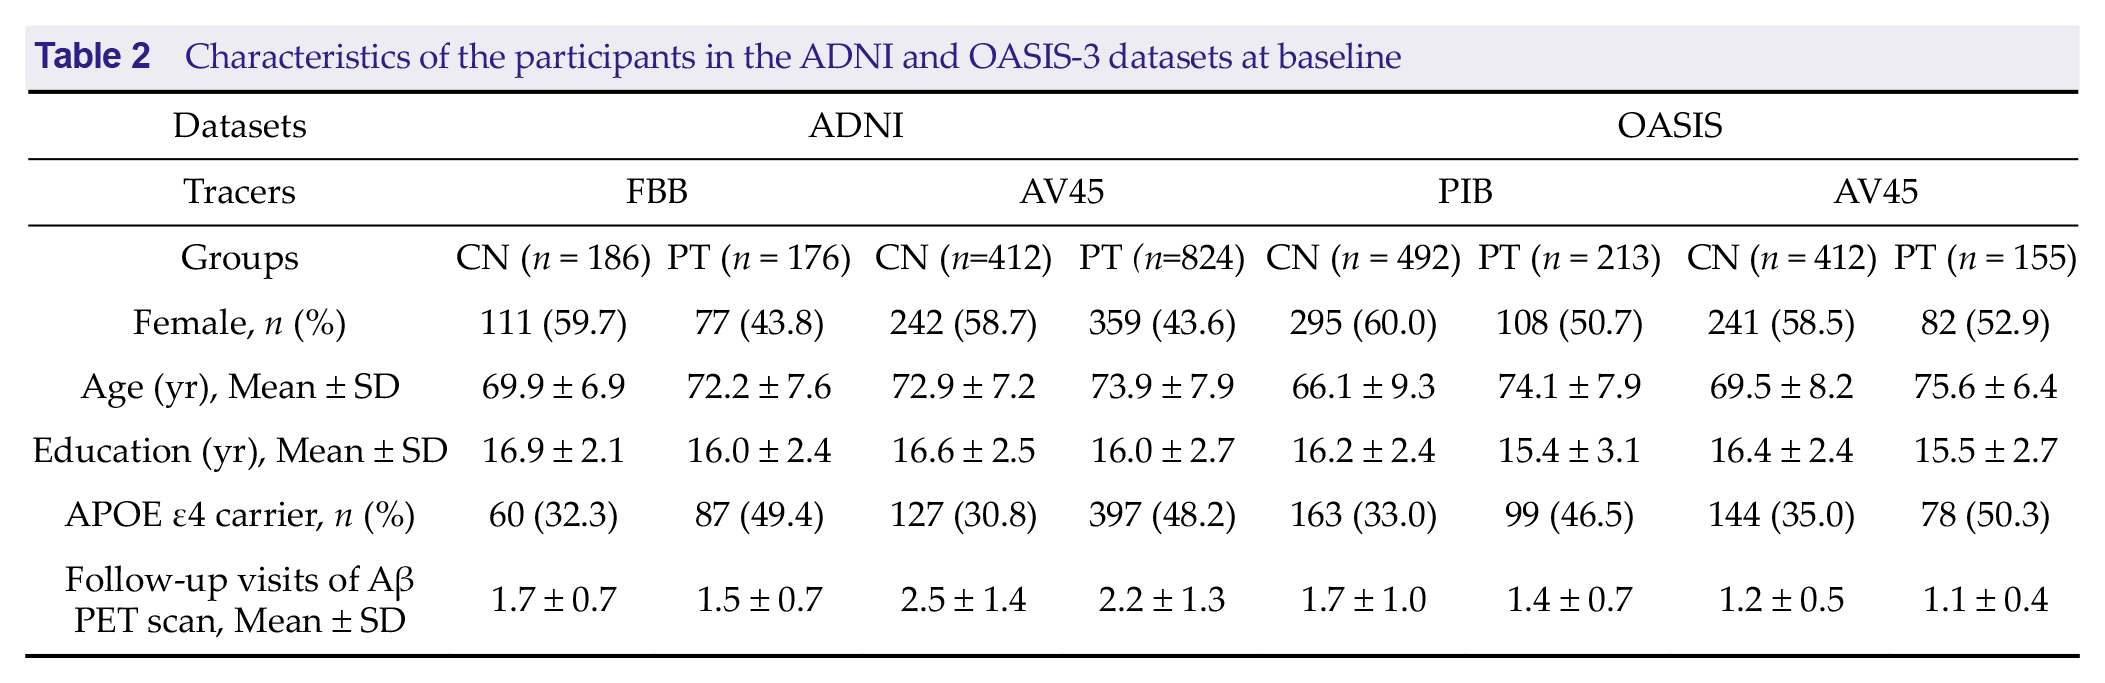
The second dataset was used to validate the ComBat-Centiloid method proposed in this study. It includes amyloid PET brain images from the Alzheimer’s Disease Neuroimaging Initiative (ADNI) and Open Access Series of Imaging Studies 3 (OASIS-3) databases. The ADNI dataset comprises FBB PET and AV45 PET scans. For the AV45 PET scans, participants received 370 MBq of AV45, followed by a 20-minute scan conducted 50 minutes post-injection. For the
FBB PET scans, participants received 300 MBq of FBB, followed by a 20-minute scan conducted 90 minutes post-injection. The OASIS-3 dataset includes PIB PET and AV45 PET scans. For the AV45 PET scans, participants received 370 MBq of AV45, followed by a 20-minute scan conducted 50 minutes post-injection. For the PIB PET scans, participants received 222 to 720 MBq of PIB, followed by a 30-minute scan conducted 30 minutes post-injection. Additionally, the data were categorized into two groups based on follow-up results: subjects diagnosed with MCI or AD at least once during follow-up were classified as the patient group (PT group), while those who remained CN throughout all follow-up assessments were classified as the CN group. Demographic details for the second dataset are presented in Table 2.
Characteristics of the participants in the ADNI and OASIS-3 datasets at baseline
All data used in this study were obtained from publicly available databases. The original data providers de-identified and anonymized the datasets to ensure participant privacy and confidentiality. Informed consent was obtained by the original data providers at the time of collection. As this study involved secondary analysis of publicly available data, it did not require additional ethical approval from an institutional review board or ethics committee.
2.2 Image Preprocessing
The spatial normalization method for images in the PIB standard reference database followed the original CL protocol [3]. Briefly, image preprocessing was performed using SPM8 (https://www.fil.ion.ucl.ac.uk/spm/software/spm8/). Corresponding magnetic resonance imaging (MRI) of each PET image was initially aligned with the MNI-152 T1-weighted template using the Coregister function. The PET image was then co-registered with the aligned MRI image, also using the Coregister function. The aligned MRI images were segmented using a unified segmentation approach to generate a spatial transformation matrix for transforming to MNI space, which was subsequently applied to the aligned PET images, resulting in PET images normalized to standard space. Following spatial normalization, intensity-normalized PET images were obtained using the whole cerebellum (as defined in the CL project guidelines available at
https://gaain.org/centiloid-project) as the reference region. SUVR values for each brain region were then extracted using the Desikan-Killiany MNI atlas (https://neurovault.org/images/23262/) (for detailed SUVR and demographic information see Supplementary File 1).
For the second dataset (Aβ PET images from ADNI and OASIS-3), the PET brain image preprocessing involved averaging multiple frames from each visit to create a single average image per subject. Each average PET image was then co-registered with the temporally-closest MRI image. MRI was segmented and spatially normalized using FreeSurfer (https://surfer.nmr.mgh.harvard.edu/), and PET images were spatially normalized using the spatial normalization parameters derived from the corresponding structural MRI images. SUVR values for each brain region were calculated using the DK MNI atlas, with the cerebellar gray matter serving as the reference region.
Aβ PET imaging often shows white matter binding, which reflects non-specific binding rather than Aβ deposition [21], and therefore only cortical gray matter was included in the calculations. A total of 84 regions of interest (ROIs) were analyzed, comprising 68 cortical and 16 subcortical regions. Detailed information about these ROIs is provided in Supplementary File 1.
2.3 SUVR-to-Centiloid Transformation
For the Aβ PET images in the ADNI and OASIS-3 databases, the respective datasets provided SUVR-to-CL transformations based on the pipeline outlined in the original CL publications, along with the corresponding CL values [22, 23]. The specific SUVR-to-CL conversion equations are as follows :


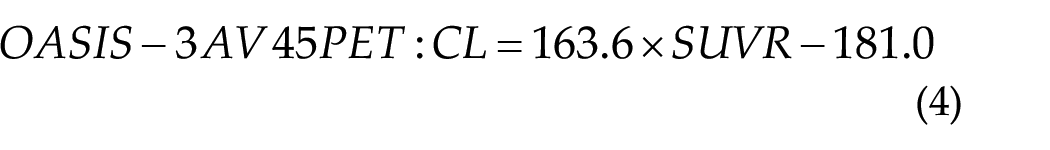
Following the guidelines in the original CL publications [3], the regional CL units (RCL) for each brain region were calculated by directly applying the SUVR-to-CL transformation formula.
2.4 Combat-Centiloid Method
2.4.1 The Cortical Summary Region
In the CL project method, it is necessary to obtain the CTX region SUVR. Similarly, we derived corresponding ROIs based on the CTX region. Specifically, we downloaded the CTX region with a resolution of 2 mm from https://gaain.org/centiloid-project. The DK atlas was then resampled to match the resolution and matrix size of the CTX region. A 1-cm-radius 3D spherical expansion was applied to the CTX region. ROIs from the DK atlas that overlapped with the expanded CTX region by more than 50% were selected, excluding white matter ROIs and asymmetric brain regions. This process resulted in a cortical summary (CTS) region composed of 28 ROIs. Detailed information on these ROIs is provided in Supplementary File 2, while a comparison between the original CTX region and the CTS region is shown in Supplementary Figure 1.
2.4.2 Centiloid Conversion
First, the SUVR for the CTS region was calculated for each image in the PIB standard reference database. A linear transformation relationship between the CTS region SUVR and the CL scale was then established following the protocol of the CL project.
Specifically, the first step is replication of the Level-1 analysis to avoid introducing potential errors from the analysis pipeline. To do this, we downloaded the original data and their published CL values from the Level-1 study of the CL project, which includes data from 45 typical AD patients (AD-100 group) and 34 young CN participants (YC-0 group). We then recalculated the SUVR values of their CTX regions, comparing these values with published results. The recalculated SUVR values differed by no more than 5% from the published results for each subject, and the mean SUVR values of the two groups differed by no more than 2%.
The mean recalculated SUVR values for the CTX region in the 45 patients with AD and 34 young CN participants are denoted as

Where
Subsequently, the CTS SUVR values for 131 images in the PIB standard reference database were converted into CL values. First, the CTS and CTX SUVR values for these images were calculated. Then, a linear fitting analysis between CTS and CTX SUVR values produced the following equation:

Using the slope a and intercept b obtained from the linear fit, the CL value derived from the CTS SUVR values was calculated as:

2.4.3 Combat-Centiloid Algorithm
The distribution of Aβ tracers in the brain can vary due to biases introduced by different tracers or imaging protocols. To address these discrepancies, each unique combination of tracer and imaging protocol is treated as a distinct subset, and the ComBat algorithm is employed to harmonize the differences among these subsets. In this study, the PIB standard reference database serves as the reference subset, while other subsets, referred to as source subsets, are aligned with it. According to the assumptions of the ComBat algorithm, the SUVR values in the ;-th brain region of the i-th image are modeled separately for the reference and source subsets as follows:


Here, aj denotes the average value of the SUVR for brain region j and X is a design matrix representing sample conditions, where X includes variables for the subjects’ sex, age, and diagnostic information (AD, MCI, or CN). The diagnostic information was included in the design matrix to avoid overcorrecting disease-related biological differences during harmonization, following the standard use of ComBat in controlled multisite studies. This inclusion is for calibration purposes only and does not apply to diagnostic modeling settings. The parameter βj represents the regression coefficients associated with X. The terms

After obtaining the harmonized SUVR for each ROI, the harmonized CTS SUVR value was calculated for each image i in the source subset, denoted as

Given that the images in the source subset were aligned with the image in the PIB standard reference database using the Combat algorithm, the HCL value for image i was calculated as:

The harmonized regional CL (HRCL) value for the brain region j in image i, denoted as HRCLi,j, was computed as:

A flow chart of the ComBat-Centiloid method is shown in Figure 1.

2.5 Reliability and Harmonization Ability
2.5.1 Correlation and Consistency Analysis of CL and HCL Values within the Same Subset
The Αβ PET data from the ADNI and OASIS-3 datasets were categorized into four subsets: AV45-ADNI, FBB-ADNI, AV45-OASIS, and PIB-OASIS. For each subset, the HCL values were computed and subjected to Pearson correlation analysis with the corresponding CL values. This analysis aimed to assess the presence of a significant linear correlation between HCL and CL values. To further evaluate the measurement consistency between HCL and CL values within each subset, we additionally computed the intraclass correlation coefficient ICC(3,1), which corresponds to a two-way mixed-effects model assessing single-measurement consistency. ICC(3,1) values were calculated based on the formulation by McGraw and Wong (1996), and 95% confidence intervals (CI) were obtained using F-distribution-based inference [24].
A high linear correlation combined with a high ICC(3,1) between HCL and CL values within the same subset indicates that HCL not only correlates strongly but also agrees consistently with CL values, supporting its reliability as a quantitative metric for assessing Aβ deposition levels comparable to CL values.
2.5.2 Comparison of HCL and HRCL from Different Subsets
Subjects who underwent Aβ PET scans in two different subsets within a 1-year interval were selected for analysis. For these subjects, the CL and HCL values from both subsets were computed and compared using paired t-tests to evaluate whether these metrics showed significant differences between subsets. Similarly, for each subject, SUVR, RCL, and HRCL values were calculated for individual brain regions across the two subsets. Paired t-tests were conducted to determine significant differences in these values between the subsets. In cases involving multiple comparisons, the Bonferroni correction method was applied. All statistical tests were performed at a significance level of p < 0.01. In addition, for results subjected to Bonferroni correction, outcomes are reported for both p < 0.01 and p < 0.05 to provide a more comprehensive view of the findings. Because the scans were performed on the same subjects within 1 year, smaller differences in the same metric across subsets indicate higher consistency of that metric between subsets.
2.5.3 Consistency of Metrics in Multicenter Combined Analysis
To simulate multicenter data analysis scenarios, the four subsets were combined in various configurations: two-subset combinations (six combinations), three-subset combinations (four combinations), and a four-subset combination (one combination). For each combination, three metrics—SUVR, HRCL, and RCL—were used to analyze the differences in individual brain regions between the PT group and the CN group. A two-sample t-test was conducted, with the resulting t-value representing the magnitude of the difference. Sex, age, and years of education were included as covariates in these analyses.
The t-values obtained from the 11 combinations were subsequently assessed for correlation across different configurations. A higher correlation between t-values reflects greater consistency in the patterns of differences between the PT and CN groups across combinations.
3 Results
3.1 CL Conversion
The recalculated CTX SUVR values for each individual showed a maximum relative error of 2.65% compared with the published values. The mean SUVR value was recalculated as
Subsequently, the linear fitting parameters between the CTX-SUVR and CTS-SUVR for each subject in the PIB standard reference database were determined as:

Thus, according to Equation (7), the conversion relationship between

3.2 Correlation and Consistency Analysis between CL and HCL Values
We calculated the corresponding CL and HCL values for each subject across four different settings and evaluated their agreement using both Pearson correlation and ICC(3,1). The results revealed strong linear correlations between CL and HCL in all four settings. The coefficients of determination R2 were 0.969, 0.983, 0.967, and 0.994 for the AV45-ADNI, FBB-ADNI, AV45-OASIS, and PIB-OASIS subsets, respectively (Figure 2). The corresponding ICC(3,1) values were 0.9727 (95% CI: 0.9707-0.9746), 0.9912 (95% CI:0.9896-0.9925), 0.9833 (95% CI: 0.9806-0.9856), and 0.9779 (95% CI: 0.9752-0.9803), respectively. These results indicate that HCL values are strongly correlated with and consistent with CL values across all subsets.

Correlation Analysis Between HCL and CL Values. For each of the four subsets, CL and HCL values were calculated for individual images, followed by linear correlation analysis within each subset. The results demonstrate a strong linear relationship between HCL and CL values.
3.3 Comparison of HCL and HRCL from Different Settings
This analysis was restricted to the OASIS-3 dataset because it was the only dataset that included subjects who underwent two Aβ PET scans using different tracers within a 1-year interval. The ADNI dataset did not contain any subjects meeting this criterion and was therefore excluded from this analysis. In the OASIS database, 104 such subjects were identified, with a mean inter-scan interval of 0.061 years (standard deviation = 0.167 years; range: 0.003-0.885 years). The average ages at the time of the scans were 69.14 ± 8.56 for AV45-OASIS and 69.12 ± 8.55 for PIB-OASIS. A paired t-test indicated no significant difference in scan ages (p = 0.17).
The mean CL values for these 104 subjects were 21.90 ± 35.68 for AV45-OASIS and 16.75 ± 32.34 for PIB-OASIS, with a paired t-test showing a significant difference (p = 0.0005). However, the mean HCL values of 25.46 ± 36.99 for AV45-OASIS and 22.72 ± 39.99 for PIB-OASIS did not show a significant difference (Figure 3a).

Differences Between Two Aβ Tracer Scans Within One Year. a, Significant differences were observed in CL values calculated from the two scans, whereas HCL values showed no significant differences. b, At a threshold of p < 0.01, analysis revealed significant differences in RCL and SUVR values in 51 and 47 brain regions, respectively, while HRCL values exhibited significant differences in only two brain regions. At a more lenient threshold of p < 0.05, significant differences were found in 52 and 51 brain regions for RCL and SUVR, respectively, whereas HRCL values differed significantly in only five regions.
We further performed paired t-tests to analyze the differences in SUVR, RCL, and HRCL values across brain regions for these 104 subjects. At a p <0.05 significance level, the SUVR, RCL, and HRCL
values showed significant differences in 51, 52, and 5 brain regions, respectively. At a p < 0.01 significance level, the SUVR, RCL, and HRCL values showed significant differences in 47, 51, and 2 brain regions, respectively (Figure 3b).
3.4 Consistency of Metrics in Multicenter Combined Analysis
By comparing the differences between the PT and CN groups across the 11 combinations, we found that HRCL yielded the highest consistency, with an average R2 of 0.954 ± 0.045. By contrast, the average R2 for RCL and SUVR were 0.843 ± 0.102 and 0.883 ± 0.071, respectively (Figure 4).

Consistency of Differences Between PT and CN Groups.
4 Discussion
This study introduces the ComBat-Centiloid method, a calibration-free alternative for quantifying Aβ deposition in PET imaging. Compared with the CL project, the ComBat-Centiloid method offers two distinct advantages: it eliminates the need for additional subject recruitment and enables analysis at the brain region level. These advancements should reduce the cost and time of research and enhance the consistency of multicenter studies, particularly those exploring regional heterogeneity in Aβ deposition.
We first confirmed that the HCL values computed using the ComBat-Centiloid method showed a high correlation with CL values computed under the same tracer and imaging protocol. This result demonstrates that within the same subset, HCL and CL are both reliable quantitative measures of global Aβ deposition.
Notably, among the four subsets tested, the correlation between HCL and CL was highest in the PIB-OASIS group. This is because the ComBat-Centiloid method aligns the data distribution of research centers with that of the PIB standard reference database, which comprises images scanned 50-70 minutes after PIB injection. Consequently, data from the PIB-OASIS group exhibited greater similarity to the reference database than did data from other tracers.
The ComBat-Centiloid method incorporates the ComBat algorithm to mitigate batch effects across multicenter data. Traditional CL calibration requires recruiting additional participants, which introduces two limitations. First, it increases the cost and time of experiments. Second, even when a research center adheres to the CL project’s protocols—using PIB as the tracer and scanning within 50-70 minutes post-injection—biases arising from center-specific factors (e.g., injection dose, scanner settings, reconstruction algorithms)
can still affect the calibration images. These biases propagate to the analysis of Aβ PET images. Our results also revealed significant differences between CL values calculated from two scans using different tracers acquired within 1 year from the same participants, even when the CL framework was applied. Moreover, prior studies have found statistically significant differences in CL values due to variations in acquisition protocols and image preprocessing methods [22]. By contrast, the ComBat-Centiloid method further reduces the influence of multicenter effects by using an empirical Bayesian approach to make alignment with reference data.
An additional advantage of the ComBat-Centiloid method is its applicability to regional-level quantitative analysis across multiple Aβ tracers. Different tracers, such as PIB, FBB, and AV45, exhibit distinct binding affinities and kinetics, leading to differences in the estimation of Aβ deposition reflected in PET images. The CL framework primarily focuses on global cortical Aβ deposition, but Aβ deposition is not uniform across the brain; instead, it exhibits regional heterogeneity, with variations in deposition sequence and speed across brain regions [6, 25]. Our results show that the linear transformations in the CL method alone cannot eliminate these regional differences. The ComBat-Centiloid method addresses this issue by using an empirical Bayesian approach to align data from research centers with that from the reference center, thereby significantly reducing regional center effects. Our findings demonstrate that the ComBat-Centiloid method achieves more consistent results in regional-level multicenter analyses.
The current study had several limitations. First, the outcomes of the method are closely tied to the choice of the reference database. We selected PIB images as the reference to align with the CL project. However, with the growing use of longer half-life 18F-labeled Aβ tracers, future work may need to focus on constructing new reference centers based on 18F-labeled tracers for Aβ quantification. Second, although the ComBat-Centiloid method uses the ComBat algorithm to align Aβ PET images with the reference data, and our findings suggest that this algorithm performs well in reducing multitracer variability, the ComBat algorithm was originally designed for multicenter corrections. Future efforts could focus on developing correction methods tailored to Aβ PET imaging, such as deep learning-based approaches. Third, the validation of the ability of the ComBat-Centiloid method to mitigate differences introduced by varying acquisition settings was limited by the available data. Specifically, only a relatively small (n = 104) single-center sample (OASIS-3) of participants who underwent two PET scans with different tracers within 1 year was available. In future studies, we plan to expand the evaluation to include a larger number of subjects, additional centers, and a broader range of tracer and site combinations. This would allow for a more comprehensive assessment of the method’s ability to eliminate both tracer- and site-related variability. Lastly, although the ComBat-Centiloid method is effective for global and regional-level analyses of Aβ PET imaging, it could be extended in two directions. For Aβ imaging, it could naturally be expanded to pixel-by-pixel analyses. For other AD-related pathologies, such as tau imaging or inflammation imaging, similar reference databases and correction methods could be established to quantify and harmonize multicenter data.
5 Conclusions
This study introduces the ComBat-Centiloid method, a calibration-free framework for standardizing Aβ PET imaging data. The HCL metric derived from this method demonstrated strong agreement with CL values while addressing their critical limitations, including calibration dependency and lack of regional specificity. Validation across multiple datasets confirmed that HCL mitigates inter-tracer and inter-protocol variability, delivering consistency in multicenter analyses. By eliminating the need for additional subject recruitment and supporting region-specific analyses, the ComBat-Centiloid method offers a practical and efficient solution for standardizing Aβ PET data. These advantages are particularly beneficial for large-scale multicenter studies investigating regional heterogeneity in amyloid deposition, an essential factor in understanding AD pathology. Future work should explore expanding this framework to other imaging modalities, such as tau and neuroinflammation PET imaging, to enhance its applicability in AD research.
Supplemental Material
sj-doc-3-bsa-10.26599_BSA.2024.9050034 – Supplemental material for ComBat-Centiloid: A Calibration-Free Method for Quantifying Centiloid Values in Amyloid PET Imaging
Supplemental material, sj-doc-3-bsa-10.26599_BSA.2024.9050034 for ComBat-Centiloid: A Calibration-Free Method for Quantifying Centiloid Values in Amyloid PET Imaging by Tianhao Zhang, Binbin Nie and Baoci Shan in Brain Science Advances
Supplemental Material
sj-xlsx-1-bsa-10.26599_BSA.2024.9050034 – Supplemental material for ComBat-Centiloid: A Calibration-Free Method for Quantifying Centiloid Values in Amyloid PET Imaging
Supplemental material, sj-xlsx-1-bsa-10.26599_BSA.2024.9050034 for ComBat-Centiloid: A Calibration-Free Method for Quantifying Centiloid Values in Amyloid PET Imaging by Tianhao Zhang, Binbin Nie and Baoci Shan in Brain Science Advances
Supplemental Material
sj-xlsx-2-bsa-10.26599_BSA.2024.9050034 – Supplemental material for ComBat-Centiloid: A Calibration-Free Method for Quantifying Centiloid Values in Amyloid PET Imaging
Supplemental material, sj-xlsx-2-bsa-10.26599_BSA.2024.9050034 for ComBat-Centiloid: A Calibration-Free Method for Quantifying Centiloid Values in Amyloid PET Imaging by Tianhao Zhang, Binbin Nie and Baoci Shan in Brain Science Advances
Footnotes
Acknowledgements
The data used in this study were obtained from the Alzheimer’s Disease Neuroimaging Initiative (ADNI) database (https://adni.loni.usc.edu) and Open Access Series of Imaging Studies 3(OASIS-3) database (![]() ). The ADNI and OASIS-3 investigators contributed to the design and implementation of their respective projects and/or provided data, but did not participate in the analysis or writing of this report.
). The ADNI and OASIS-3 investigators contributed to the design and implementation of their respective projects and/or provided data, but did not participate in the analysis or writing of this report.
The principal investigators in the OASIS-3: Longitudinal Multimodal Neuroimaging project were T. Benzinger, D. Marcus, and J. Morris, NIH P30 AG066444, P50 AG00561, P30 NS09857781, P01 AG026276, P01 AG003991, R01 AG043434, UL1 TR000448, R01 EB009352. AV-45 doses were provided by Avid Radiopharmaceuticals, a wholly owned subsidiary of Eli Lilly.
Funding
This work was financially supported by the National Natural Science Foundation of China (Nos.12205329, 12175268), Ye Ming Han Fund (2024): X21520603, the Innovation Fund of the Institute of High Energy Physics, Chinese Academy of Sciences (2024): E4545AU210.
Author Contribution
Declaration of Conflicting interests
All contributing authors report no conflict of interests in this work.
Data Availability Statement
All data utilized in this study were obtained from publicly accessible databases, namely the Centiloid Project (![]() ), ADNI (adni.loni.usc.edu) and the OASIS-3 (oasis-brains.org). All databases adhere to strict ethical guidelines and data sharing policies. Researchers interested in accessing these datasets may download the data in accordance with the respective database policies.
), ADNI (adni.loni.usc.edu) and the OASIS-3 (oasis-brains.org). All databases adhere to strict ethical guidelines and data sharing policies. Researchers interested in accessing these datasets may download the data in accordance with the respective database policies.
Ethics Statement
As this study involved secondary analysis of publicly available data, it did not require additional ethical approval from an institutional review board or ethics committee.
Informed Consent
All data utilized in this study were obtained from publicly accessible databases. Informed consent was obtained by the original data providers at the time of collection.
Supporting Information
Additional supporting information can be found online.
References
Supplementary Material
Please find the following supplemental material available below.
For Open Access articles published under a Creative Commons License, all supplemental material carries the same license as the article it is associated with.
For non-Open Access articles published, all supplemental material carries a non-exclusive license, and permission requests for re-use of supplemental material or any part of supplemental material shall be sent directly to the copyright owner as specified in the copyright notice associated with the article.