
Abstract
Background:
The aim of the present study was to investigate if high amplitude high frequency oscillations (haHFOs) could be a biomarker of posttraumatic epileptogenesis.
Methods:
After an initial craniotomy of rats and inducement of traumatic brain injury (TBI) through a fluid percussion, recording microelectrodes were implanted bilaterally in different brain areas. Wideband brain electrical activity was recorded intermittently from Day 1 of TBI and continued till week 21. HaHFO analysis was performed during the first 4 weeks to investigate whether the occurrence of this brain activity predicted development of epilepsy or not.
Results:
Of the 21 rats which received the TBI, 9 became epileptic (E+) and 12 did not (E−). HaHFOs were observed in the prefrontal and perilesional cortices, hippocampus, and striatum in both E+ and E− group. In comparison to the rats in E−, the E+ group showed a significant increase in the rate of haHFO from weeks 1 to 4 after TBI.
Conclusion:
The results indicate that an increase in the rate of haHFOs after TBI could be an electroencephalographic biomarker of posttraumatic epileptogenesis.
1 Introduction
The field of neurology, but in recent times, electrophysiology has attracted many researchers, specifically to find biomarkers that are indicative of the onset of disease for pre-diagnoses [1]. This study will focus on one broad electrographic marker, which are high frequency oscillations (HFOs). There are many questions surrounding this specific type of brain signal from the different types of HFOs, their generation, whether they are pathological or physiological, and any other potential uses for these brain signals [2].
From early days of neurophysiology, scientists have always been interested in the idea of brain signals that can be recorded from the brain itself. There have been various studies into various electroencephalography (EEG) signals based on their frequencies and amplitudes. In the early days of EEGs, not much was known about frequencies above 30 Hz until two inventions revolutionized this; the rise of broad-band digital EEG extending the ability to record frequencies up to 500 Hz, and new findings in electrophysiology that illustrated oscillations in the frequency range of 38–100 Hz [3]. With advancements such as these, the term HFO was coined for frequencies that were greater than 80 Hz all the way up to about 500 Hz. HFOs themselves are generally categorized in the high frequency components of brain signals, with frequencies from 80–250 Hz called as ripple oscillations and 250–500 Hz as fast ripples. To account for ripples and fast ripples, the frequency range of 80–500 Hz will be the overall focus of the current study. Some functions for these HFOs are that they could potentially coordinate cortical processing during vision [4] and could have to do with motor and language functions [5]. Specifically, HFOs in the hippocampus have also been known to play an important role in memory [1].
Apart from the concept of physiological HFOs themselves, there have been many studies into a different kind of HFOs, pathological HFOs (pHFOs). These pHFOs that were found in epileptic rats were initially thought to be an electrographic biomarker for the epileptic tissue [6]. The signals that were found in rats were fast ripples (250–500 Hz). These said fast ripple HFOs were only observed in epileptic rats but were not found in control (SHAM) rats, so they were regarded as pHFOs [6]. However, while early studies supported this hypothesis that only fast ripples were pathological in nature, there were a few later studies that reported pathological HFOs with a frequency below 250 Hz, disproving this theory of only fast ripples indicating the onset of epilepsy [7, 8]. These further studies indicated a numerical difference in HFOs with frequencies below 250 Hz (known as ripples) as indicative of epilepsy. An example of a ripple and fast ripple brain signal can be seen in Fig. 1.
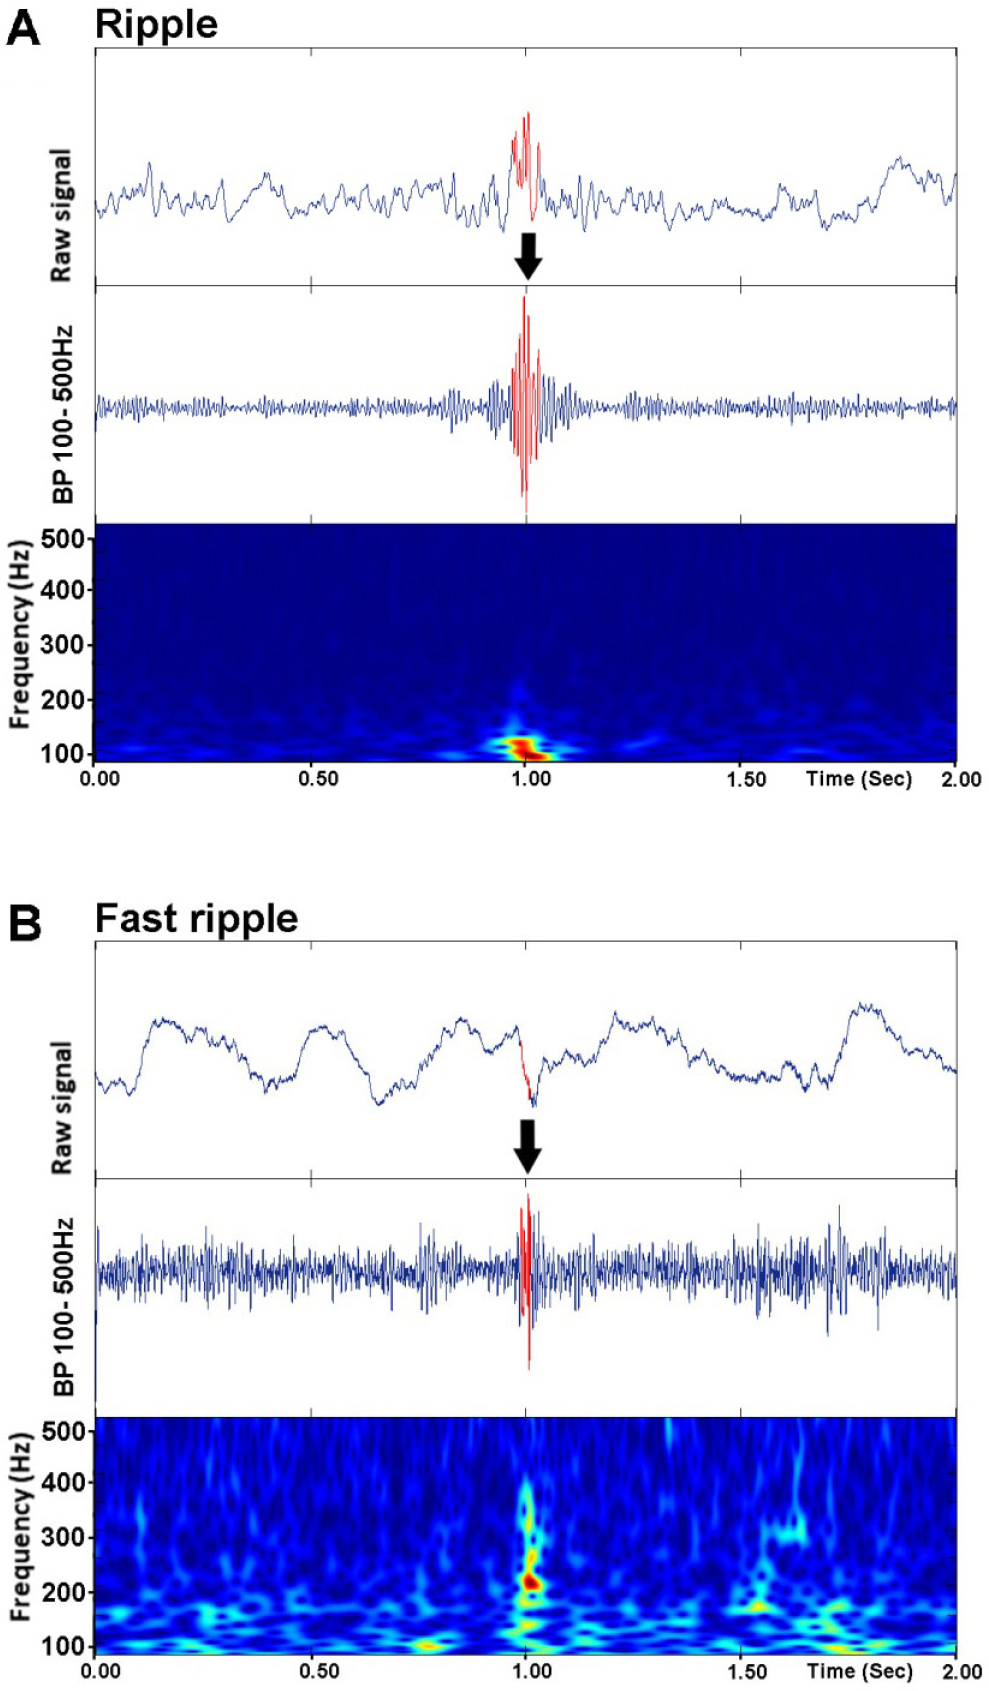
Examples of ripple (80–250 Hz) (A) and fast ripple (250–500 Hz) (B) recorded in a brain area of rat induced with TBI. Arrows pointed towards the red oscillation signal represent ripple and fast ripple.
In this study, rats were induced with fluid percussion injury (FPI) and electrodes were implanted bilaterally into the brain, and electric activity was recorded. Then, the data was manually sorted for slow wave brain signals, and with a random sample of one hour of data, an analysis program generates a set of oscillations that are then manually assessed for artifacts and HFOs [9, 10].
The goal of this study is to find a more significant biomarker in posttraumatic epileptogenesis to potentially pre-diagnose patients with epilepsy by identifying such biomarkers. The metric in question that will be changed is known as the peak standard deviation threshold. While previously, there was a different threshold, due to a lack of overall significance, a knowledge gap was created. To investigate a potential numerical difference, the peak standard deviation (SD) was changed from 3 SD to 9 SD. With this peak standard deviation established, all the slow waves accumulated were converted into a quantifiable amount of high amplitude HFOs (haHFOs) and were analyzed by a blinded researcher to potentially prove that the epileptic group had a higher number of haHFOs present as opposed to non-epileptic and SHAM.
2 Materials and methods
2.1 Experimental animals
Experiments were conducted on 3-month-old male Sprague–Dawley rats. They were purchased from Charles River Laboratories, MA and were maintained on 12-12-hour light-dark cycle with food and water ad libitum. All the experimental procedures were approved by the University of California, Los Angeles Institutional Animal Care and Use Committee.
2.2 Induction of TBI
Lateral FPI was induced using a custom-made pneumatic device according to the procedure described by Kumar et al., 2021 [10]. In specific, after anesthetizing the rats with isoflurane (4%–5% for induction and 1.5%–2% for maintenance), they were fixed in a stereotactic surgery frame. The animal’s body temperature was maintained at 37°C with a thermostatically controlled heating pad. The hair and skin of the rat was parted, and the skull was exposed. As soon as the skull was seen, a 5 mm diameter craniotomy centered 5 mm posterior to the bregma and 3 mm lateral to the midline was created. The craniotomy was in conjunction with a plastic injury cap (made from a 1 mL syringe barrel) with a 5 mm opening positioned over the craniotomy and affixed to the skull using dental acrylate cement (SNAP Dental, NY, USA). As soon as the cement was dried and injury cap securely affixed, it was filled with 0.9% sterile saline and was then attached to the FPI pneumatic apparatus. Isoflurane was then discontinued, and the rat’s responsivity was monitored using the toe pinch reflex. At the first sign of responsiveness, FPI was delivered (3.2–3.5 atm percussion intensity) to induce TBI. After the impact, the rat was monitored for duration of apnea and first responsiveness to the toe pinch. Later, rats were put under isoflurane and the injury cap was removed.
2.3 Implantation of electrodes
Following the removal of injury cap, the skull was cleaned with sterile saline, and recording tungsten microelectrodes (California Fine Wire Co, CA, USA and Heilind Electronics Inc, MA, USA) were implanted in the bilateral sites of prefrontal cortex (anteroposterior [AP] = 3.7, mediolateral [ML] = ±0.5, dorsoventral [DV] = 3.0); striatum (AP = 1.6, ML = ±1.8, DV = 6.0) anterior and posterior perilesional area (AP = −2.5 and −7.5, ML = 3.0, DV = 1.0) and hippocampus (AP = −5.2, ML = ± 5.2, DV = 7.4). Ground and reference electrodes (stainless steel microscrews) were positioned in the cerebellum, 2.0 mm posterior to lambda and 1.0 mm lateral from the sagittal suture. The animals in the SHAM group, received the same electrode implantation montage, except for FPI. After electrode implantation, they were secured with dental acrylic cement and were placed in the heated cage for recovery.
2.4 Data acquisition
One hour after surgery, the rats were plugged to the 16-channel data acquisition system (Intan RHD 2000 digital system, Los Angeles, CA, USA) and wide band brain electrical activity ranging from 0.1 Hz to 3.0 kHz was recorded. The electroencephalogram was recorded intermittently during the first week of TBI (day 1, 2, 3 and 7), and from the second week, 48 hours of data per week was recorded. The EEG was recorded until week 21 after TBI.
2.5 Data analysis
Data analysis was performed blindly in such a way that one person was responsible for randomizing animals into TBI and SHAM groups and reviewing EEG data for the existence or absence of seizures. Later, based on seizures, the animals in the TBI group were divided into; those which became epileptic (E+ group), and those which did not (E− group). Another researcher performed brain signal analysis without the knowledge of which animals were considered as epileptic and which ones were not.
For analysis of high amplitude high frequency oscillations (haHFOs), in prefrontal cortex, striatum, perilesional cortex and hippocampus, one-hour duration slow wave sleep EEG data from each animal per experimental day of week 1 to week 4 was used. The clean (free of any motion artifact) slow wave sleep EDF (European data format) files were imported to MATLAB (MathWorks, Natick, MA, USA) RIPPLELAB toolbox. The haHFOs were identified based on the specific criteria described by Staba et al. [11]. Specifically, the EEG data were bandpass filtered (80 Hz to 500 Hz), and the root mean square of the band pass signal (3 ms window) was calculated. Events containing minimum 4 oscillations and the values of root mean square value greater than 9 standard deviation with a minimum of 6 ms duration between the onset and offset boundaries were selected. The RIPPLELAB detected haHFOs were visually cross-examined with raw EEG data to ascertain their true positivity.
2.6 Statistics
Statistical analysis (GraphPad Software, San Diego, CA, USA) was performed using one way ANOVA for the comparison of total haHFOs among E+, E− and SHAM groups. The one-way ANOVA were followed by Tukey test for the comparison between E+ and the other two groups in each week period.
3 Results
The overall question of this study is to find a more significant biomarker in posttraumatic epileptogenesis to potentially prediagnose patients with epilepsy by identifying such key biomarkers. The approach used to answer this question was to create an experiment with a larger standard deviation threshold to find a bigger difference in rate of brain signals between epileptic and non-epileptic rats. With TBI induced to rats and brain activity recorded, signals were collected and analyzed via computer program to find a numerical difference in haHFO rate between epileptic and non-epileptic rats. The expected results are that epileptic rats will have a larger amount of haHFOs present in comparison to rats that are not epileptic and SHAM rats.
The overall results of the haHFO analysis can be seen in Fig. 2, with bars representing E+ (epileptic), E− (non-epileptic), and SHAM (control) group. For a numerical analysis and difference, Table 1 has the average total haHFOs recorded for the different groups forementioned.
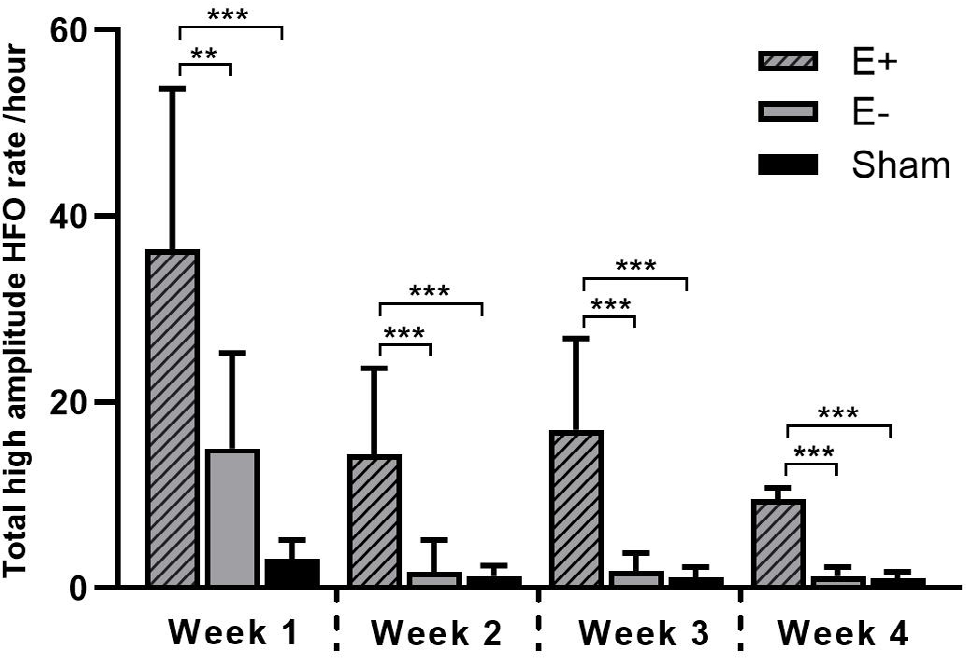
Comparison of total high amplitude high frequency oscillation (haHFO) rate per hour in the E+, E− and SHAM groups. Data are presented as mean and standard deviation. Significant difference: *** P < 0.001, ** P < 0.01.
Total haHFO rate per hour (mean ± SD).
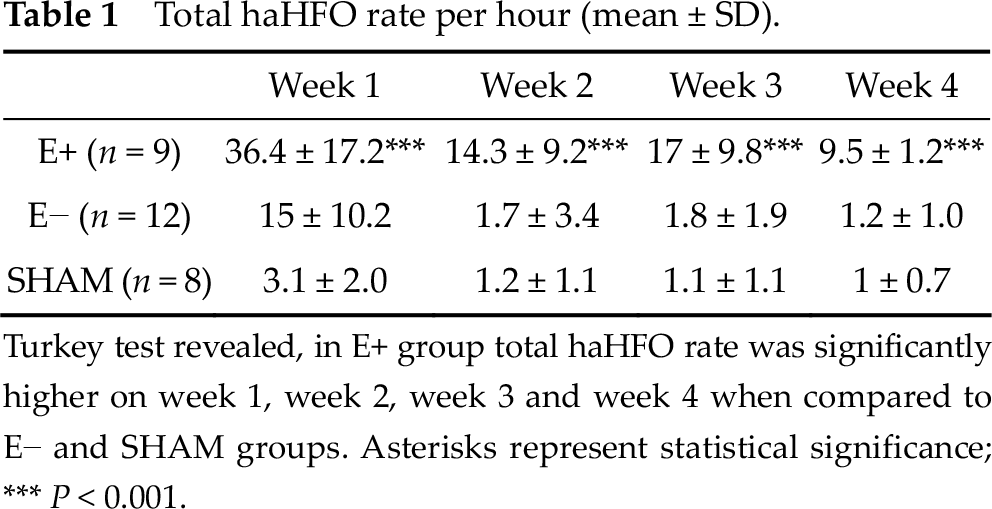
Turkey test revealed, in E+ group total haHFO rate was significantly higher on week 1, week 2, week 3 and week 4 when compared to E− and SHAM groups. Asterisks represent statistical significance; *** P < 0.001.
The haHFOs were observed in all the recording brain areas; the prefrontal cortex, striatum, perilesional cortex, and hippocampus in the E+, E− and SHAM group. Examples of signals that are considered haHFOs can be seen in Fig. 3, split by areas of the brain that are analyzed.
The results for the 9 epileptic rats are as follows. For week 1, there were a total of 260 haHFOs recorded, with an average of 36.4 haHFOs per hour. For week 2, there were a total of 44 haHFOs recorded, with an average of 14.3 haHFOs per hour. For week 3, there were a total of 90 haHFOs recorded with an average of 17 haHFOs per hour. For week 4, there were a total of 38 haHFOs recorded, with an average of 9.5 haHFOs per hour (Fig. 2, Table 1).
The results for the 12 non-epileptic rats are as follows. For week 1, there were a total of 153 haHFOs recorded, with an average of 15 haHFOs per hour. For week 2, there were a total of 45 haHFOs recorded, with an average of 1.7 haHFOs per hour. For week 3, there were a total of 29 haHFOs recorded with an average of 1.8 haHFOs per hour. For week 4, there were a total of 10 haHFOs recorded, with an average of 1.2 haHFOs per hour (Fig. 2, Table 1).
The results for the 8 SHAM rats are as follows. For week 1, there were a total of 25 haHFOs recorded, with an average of 3.1 haHFOs per hour. For week 2, there were a total of 10 haHFOs recorded, with an average of 1.2 haHFOs per hour. For week 3, there were a total of 9 haHFOs recorded with an average of 1.1 haHFOs per hour. For week 4, there were a total of 8 haHFOs recorded, with an average of 1 haHFO per hour (Fig. 2, Table 1).
A basic rationale for to these results is that there is a large numerical difference in the recorded HFOs that are deemed as epileptic as opposed to those that are deemed non-epileptic and SHAM, which looks to prove our overall hypothesis about frequency and quantity of haHFOs in epileptic rats versus those of non-epileptic rats to potentially find a biomarker for the prediagnosis of epileptogenesis using brain wave analysis. This means that with further study, there can be potential investigation into the use of such a biomarker in conjunction with others in the prediagnosis of humans who could potentially become epileptic.
Fig. 1 illustrates specific examples of ripples and fast ripples, primary signals that would be selected in our overall analysis of our experimental goals. Fig. 2 and Table 1 represent a graphed and tabled version of the results respectively, and Fig. 3 is an example of brain waves that are found more often in specific parts of the brain.
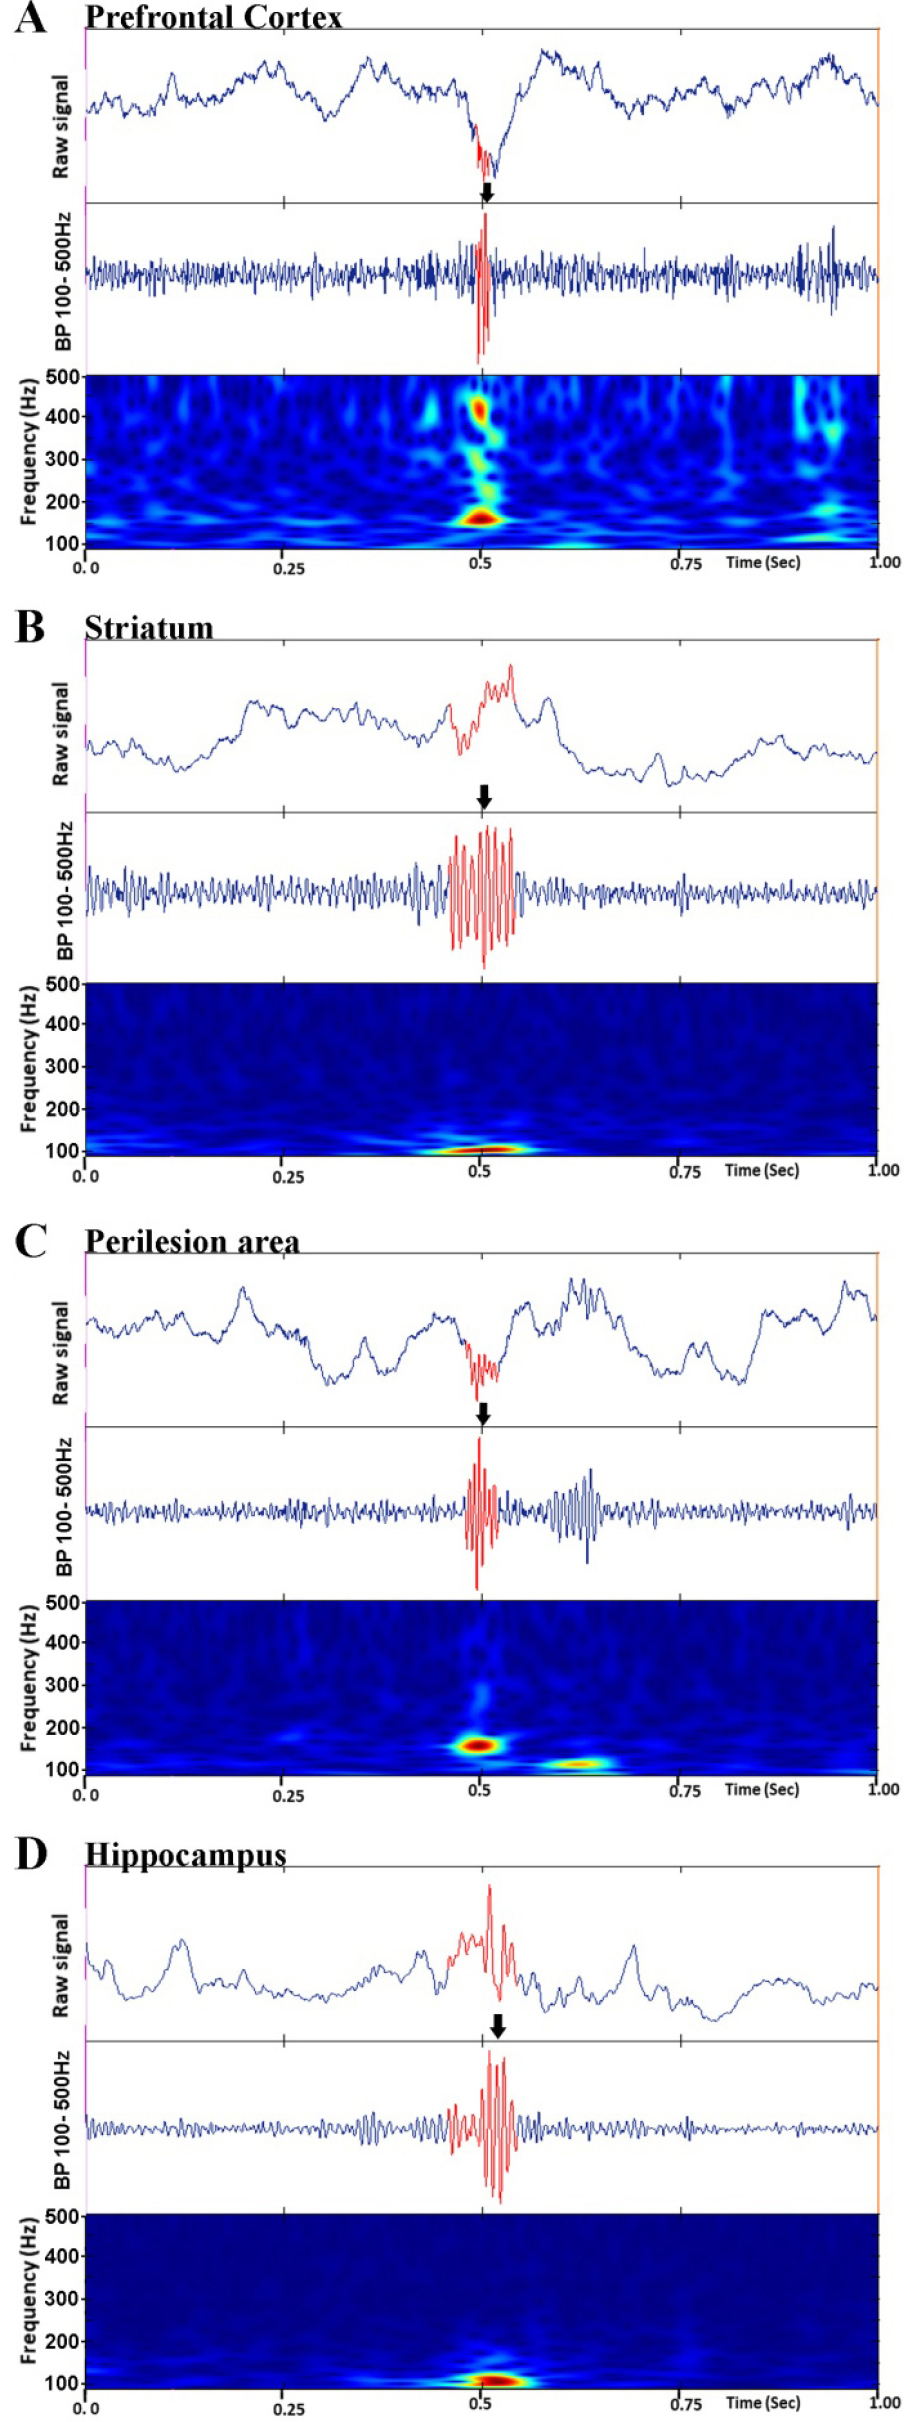
Examples of high amplitude high frequency oscillations (haHFOs). Slow wave EEG from prefrontal cortex (A), striatum (B), perilesion area (C) and hippocampus (D) show the presence of haHFO (arrows). Top images in (A)–(D) are 1 s epoch window with raw slow wave EEG signal. Middle are the 80–500 Hz band pass (BP) filtered data. Bottom are the time-frequency profile. Arrows pointed towards the red oscillation signal represent haHFO.
In looking at the statistical significance between the epileptic, non-epileptic and SHAM group, all results are statistically significant. A one-way ANOVA was done along with a Turkey Test. In comparing the haHFOs in epileptic and non-epileptic group for week 1, the significant difference is P < 0.01. Comparing the epileptic and non-epileptic or SHAM group for the rest of the weeks, the significant difference is P < 0.001.
4 Discussion
The goal of this experiment is to find electrographic biomarkers in the potential prediagnosis of post traumatic epileptogenesis. Our overall problem throughout this experiment has been finding a good electrographic biomarker that would exemplify an overall difference between the quantities of low amplitude HFOs (< 9 peak standard deviation threshold) between epileptic group and nonepileptic group. Our previous problems with a lower peak standard deviation have been that not only have there been too many HFOs present to manually sort through causing a significant increase in the labor time, but also there have been no significant results in the overall graph to indicate any presence of a biomarker. In the experiment, after conducting analysis using a larger standard deviation than previous work, it was clear that there was a statistically significant difference in the number of HFOs found between epileptic versus non-epileptic rats. In looking at the overall results presented, one can see that both of these problems have been addressed, with one researcher being able to analyze all of the data along with statistically significant results indicated in the overall data.
A significant difference in quantity of haHFOs between epileptic and nonepileptic/ SHAM rats was observed. This indicates that haHFOs could be a potential biomarker in the diagnosis of post traumatic epilepsy. This means that, in the future, if a patient’s brain is analyzed in a similar way with EEG, and these haHFOs are investigated using a similar standard as that of this study, an increase in rate of haHFO could indicate an onset of post traumatic epileptogenesis. This can then be used as a strategy to prediagnose and prevent post traumatic epilepsy.
5 Conclusion
These conclusions have potentially important effects for the field of neurology. One of the primary problems that physicians have in the prediagnosis of epilepsy is that there are not many biomarkers that indicate the onset of epilepsy before patients begin to experience chronic seizures. With biomarkers such as a haHFOs in patients, physicians would be able to make an early diagnosis of patients becoming potentially epileptic and take measures to prevent the onset of epileptic seizures and further spread of seizures. While there are therapies for epilepsy, the current biomarker would help in early diagnosis and help prevent epilepsy.
Footnotes
Ethical approval
All the experimental procedures were approved by the University of California, Los Angeles Institutional Animal Care and Use Committee.
Conflict of interests
The author declares no conflicts of interest.
Funding
This study was supported by research grants from the National Institutes of Health, USA.
Authors’ contribution
UK designed experiment and performed data collection. Data was analyzed by JR. All the authors participated in the manuscript writing and approved the publishing version.