
Abstract
Objective:
This study aimed to determine whether the apparent diffusion coefficients (ADCs) determined by diffusion-weighted imaging (DWI) of magnetic resonance imaging (MRI) could facilitate the malignancy grading of various gliomas.
Methods:
Sixty patients with a primary cerebral glioma underwent diffusion-weighted and gadolinium-enhanced (Gd) T1-weighted MRI using a 1.5-T MRI scanner. Scoring was performed based on signal intensities on DWI and Gd images. The mean and minimum ADC values were calculated, and Ki-67 staining was performed for each histological sample to evaluate their tumor proliferative potential. Then, the DWI, Gd, and combined scores were analyzed and compared with the Ki-67 staining index and malignant grade. The relationships among the mean and minimum ADC values, Ki-67 staining index, and malignant grade were also evaluated.
Results:
The minimum ADC was inversely correlated with the Ki-67 staining index, with a low minimum ADC suggestive of tumor malignancy. The qualitative evaluation of the D score of water molecule diffusion on DWI accurately reflected the pathological grades of gliomas, with an effectiveness that was at least as good as the quantitative analysis using the minimum ADC. The diagnostic value of Gd images in determining glioma malignancy grades was inferior to that of DWI.
Conclusion:
Both DWI and gadolinium-enhanced images of MRI should be considered essential for the diagnosis of tumor malignancy.
1 Introduction
Magnetic resonance imaging (MRI) is an essential diagnostic tool for brain tumors, with gadolinium-enhanced T1-weighted MRI being one of the most commonly used techniques. Diffusion-weighted imaging (DWI) can visualize restrictions to the free diffusion of water caused by tissue microstructure. Different histological tumor types have different cellularity, leading to intensity differences on DWI. The magnitude of diffusion is represented by apparent diffusion coefficients (ADCs), where a low ADC indicates a restricted diffusion and is seen as a high signal intensity on DWI. DWI is useful in the diagnosis of primary malignant lymphoma because pathological tissues demonstrate a small cell size and integrated cell density [1].
A low ADC can demonstrate the malignant properties of tumors [2–4], whereas others argued that ADC is not useful [5–7], since the presence of vascular edema, hemorrhage, and cystic alteration causes ADC value heterogeneity, which can compensate for the decrease in ADC. Therefore, the range of interest (ROI) was placed in the most solid tumor part to exclude edema, cystic changes, and central necrosis [8].
The value of DWI findings in malignant gliomas was described in the literature [1–15]. However, DWI findings was not sufficiently been evaluated based on their histological proliferative potential. Therefore, this study aimed: 1) to determine whether mean and minimum ADCs correlate with the malignant grades of gliomas; 2) to compare the pathological diagnosis with DWI findings and evaluate whether DWI correlates with glioma malignancy grades; and 3) to compare high DWI signal intensities, gadolinium enhancement, and the combination of both and evaluate which method shows the highest correlation with glioma malignancy grades.
2 Materials and methods
2.1 Patients
In this study, patients who underwent surgery for glioma resection at Teikyo University Chiba Medical Center between January 2002 and December 2014 were retrospectively included. Patients without a preoperative MRI evaluation were excluded. This study was a retrospective analysis and approved by the ethics committee of Teikyo University Chiba Medical Center. Data were dealt with anonymously, and an informed consent was obtained from each patient.
2.2 MRI protocol and analysis
Preoperative MRI was done using a Signa HDxt 1.5-T scanner (GE Healthcare, Waukesha, WI, United State). Axial DWI slices were acquired using the following parameters: TR, 6000 ms; TE, 82.4 ms; FOV, 240 × 240 mm2; b = 1000 s/mm2; slice thickness = 6 mm; slice spacing = 1.5 mm; and matrix, 128 × 192. Then, ADC maps representing voxel-level ADC measurements were created. Contrast-enhanced MRI was performed with 0.2 mL/kg of meglumine gadopentetate (Magnevist iv syringe, Bayer AG, Germany) or gadodiamide hydrate (Omniscan iv syringe, Dai-ichi Sankyo Co. Ltd., Japan) using the following parameters: TR, 560 ms; TE, 11 ms; FOV, 240 × 240 mm2; slice thickness, 6 mm; slice spacing, 1.5 mm; and matrix, 448 × 224. Contrast-enhanced MRI was also performed using axial, sagittal, and coronal representations. MRI findings, including the signal intensities on DWI and contrast enhancement, were recorded by two radiologists.
An axial ADC map section displaying the maximum size of the solid tumor part was selected, and an ROI was set to define the tumor. Susceptibility-weighted imaging (SWI) was also done to evaluate intratumoral hemorrhages; hypointense signals in SWI were regarded as hemorrhage, and these, along with cystic components, were excluded. Then, the mean and minimum ADC values of the tumor were recorded. MR exponential images were used to eradicate the T2 shine-through effect.
The DWI results were scored with 0, representing tumors with a high signal intensity (even if only a small portion showed a high intensity); and 1, representing tumors without any portions with high signal intensities. A high signal intensity was defined as tumors with the same signal intensity as cerebrospinal fluid on the ADC map. For DWI scoring, areas with intratumoral hemorrhage and cystic components were also excluded. In this study, the DWI score was called the D score. Contrast-enhanced MRI was scored with 0, representing tumors with a high contrast-enhanced intensity (even if only a small portion); and 1, representing tumors with no enhancement; patients with low contrast-enhanced intensities were excluded because it would be difficult to decide which score group they belong to. This contrast-enhanced score was named the E score, and the D and E scores were combined, being then referred to as the DE score.
2.3 Evaluation of tumor proliferation
Histopathological diagnoses were performed by two pathologists. Ki-67 staining was performed to evaluate their proliferative potential. Paraffin-embedded tissue sections were examined immunohistochemically using mouse monoclonal Ki-67 antibodies (Dako, Glostrup, Denmark; 1:25 dilution). Tissue sections were stained with Ventana BenchMark ULTRA automated immuno-stainer using heat-induced epitope retrieval and a standard diaminobenzidine (DAB) detection kit (Ventana iVIEW DAB Universal Kit).
Pathological grading was categorized into three groups (grade I–II, grade III, and grade IV) because of a very low number of grade I tumors, or into two groups (grade I–II, and grade III–IV, i.e., benign and malignant glioma groups).
2.4 Statistical analysis
Data analyses were performed as follows: 1) correlations of the mean and minimum ADCs with the Ki-67 staining index were examined; 2) correlations of the D, E, and DE scores with the Ki-67 staining index were examined; 3) relationships of the mean and minimum ADCs with the glioma grades were examined; and 4) correlations of pathological grades with the D, E, and DE scores were examined. Receiver operating characteristic curves were created to investigate whether D, E, and DE scores or ADC measurements indicate benign or malignant properties.
Statistical analyses were performed using the Japanese version of SPSS version 16.0 (IBM Japan, Ltd., Tokyo, Japan).
3 Results
Sixty gliomas from 60 patients were included in this study. The grade classification resulted in 17 grade I–II tumors, 12 grade III tumors, and 31 grade IV tumors.
3.1 ADC and Ki-67 staining index
A significant inverse relationship was found between glioma proliferation and the mean ADC, with low mean ADC values indicating a rapid proliferation [Fig. 1(A), R 2 = 0.1235, p = 0.008]. The same trend was also observed between the minimum ADC value and Ki-67 index (R 2 = 0.2316, p = 0.00017), with the minimum ADC as a more significant indicator of potential glioma proliferation than the mean ADC value [Fig. 1(B)].
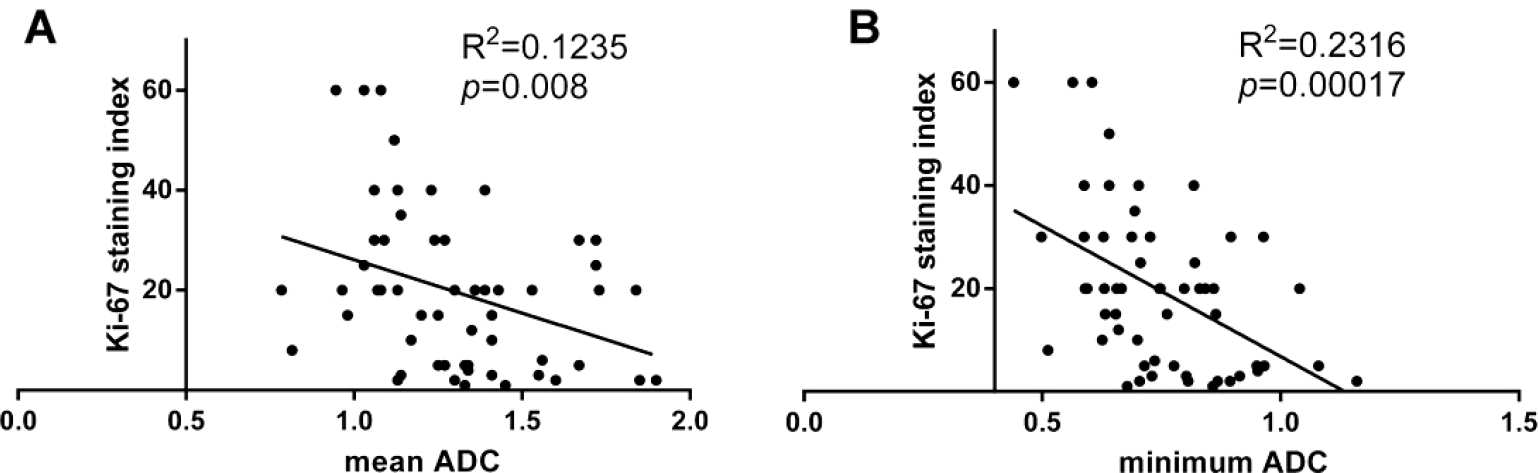
Correlation between the glioma Ki-67 index and ADC. (A) Correlation between the glioma Ki-67 index and mean ADC (p = 0.008). (B) Correlation between the glioma Ki-67 index and minimum ADC (p = 0.00017).
3.2 MRI score and Ki-67 staining index
A significant difference in the mean Ki-67 staining index was found between the D score 0 group (26.1%) and D score 1 group (7.1%; p < 0.0001), implying that gliomas with a high DWI signal intensity tend to grow faster than those with low signal intensities [Fig. 2(A)]. In the analysis of contrast-enhanced images, a significant difference was found between the E score 0 group (23.3%) and E score 1 group (7.0%; p = 0.0005), demonstrating that gliomas with a high contrast-enhanced signal intensity proliferate rapidly [Fig. 2(B)]. A scatter chart of the Ki-67 staining index in the DE score 0 (26.5%), DE score 1 (12.6%), and DE score 2 (4.6%) groups is presented in Fig. 2(C). Significant differences were found between the DE score 0 and DE score 2 groups (p < 0.0001) and between the DE score 0 and DE score 1 groups (p = 0.004). However, no significant difference was found between the DE score 1 and DE score 2 groups (p = 0.077).
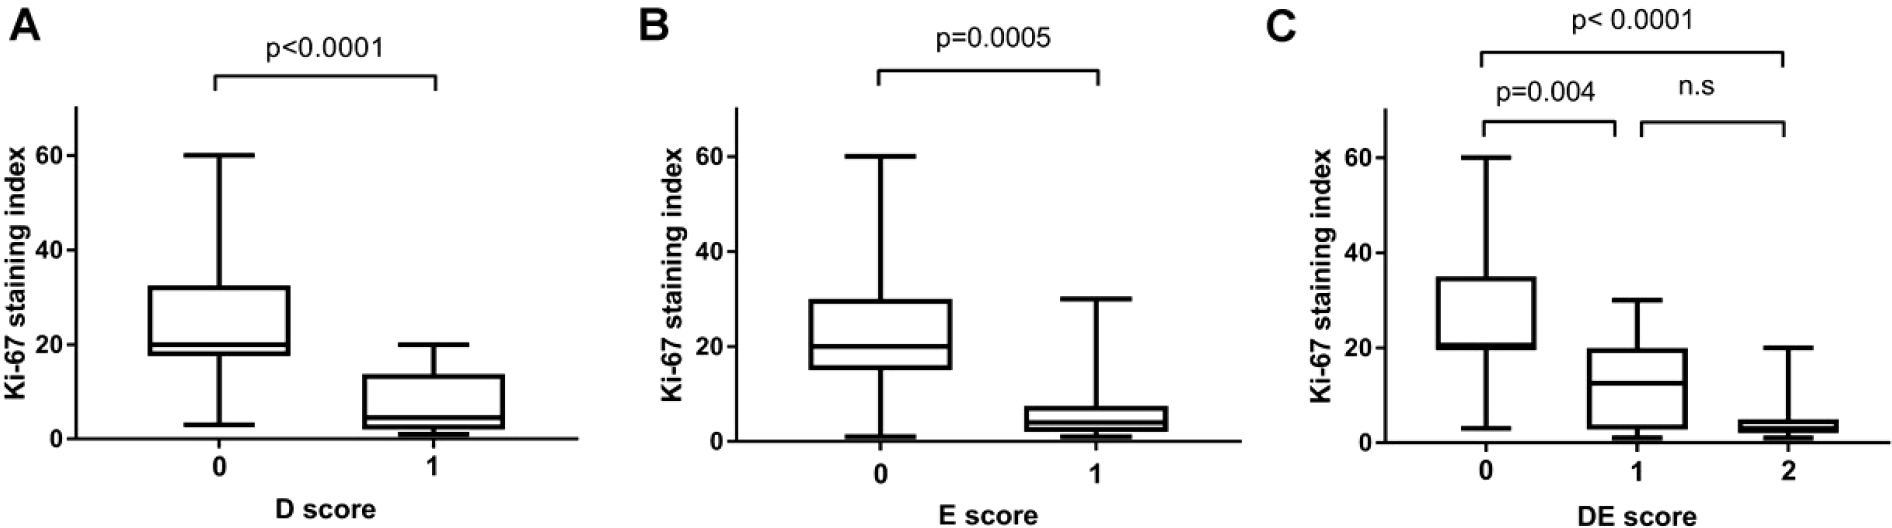
Comparison of the Ki-67 index in different MRI scores groups. (A) Comparison of the Ki-67 index in D score 0 and 1 group gliomas. The difference is significant (p < 0.0001). (B) Comparison of the Ki-67 index between the E score 0 and 1 glioma groups. The difference is significant (p = 0.0005). (C) Comparison of the Ki-67 index among the DE score 0, 1, and 2 glioma groups. Significant differences occur between the DE score 0 and 2 groups (p < 0.0001) and between the DE score 0 and 1 groups (p = 0.004). There is no significant difference between the DE score 1 and 2 groups (p = 0.077).
3.3 ADC and pathological grade
The comparisons of the three pathological grade groups with respect to the mean and minimum ADCs are shown in Figs. 3(A) and (B). There was no significant difference in the mean ADC between each pathological grade group (grade I–II: 1.399, grade III: 1.280, grade IV: 1.254), although a significant difference in minimum ADC was observed between the grade I–II and grade III groups (p = 0.012) and between the grade I–II and grade IV groups (p = 0.002). However, there was no significant difference in minimum ADC between the grade III and grade IV groups (grade I–II: 0.860, grade III: 0.722, grade IV: 0.699).
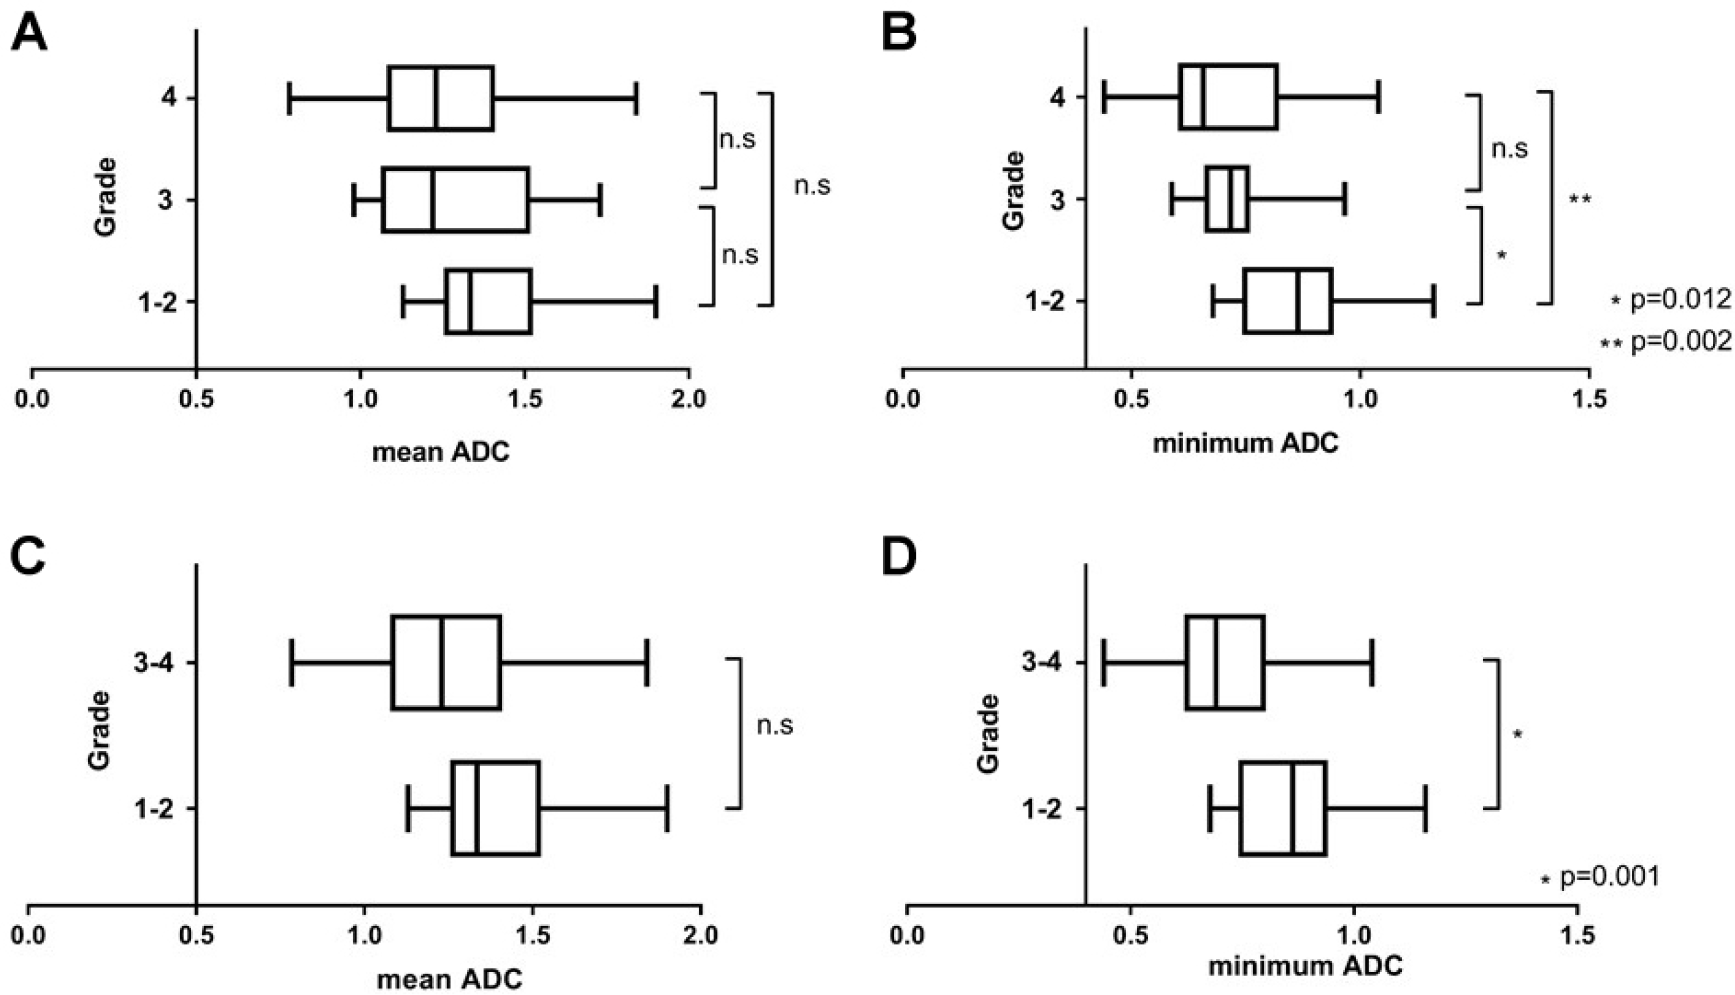
Comparison of ADC among different groups. (A) Comparison of the mean ADC among grade I–II, grade III, and grade IV groups. No significant difference was found between any group. (B) Comparison of the minimum ADC among grade I–II, grade III, and grade IV groups. The differences between the grade I–II and grade III groups (p = 0.012) and between the grade I–II and grade IV groups (p = 0.002) are significant. No significant difference was found between the grade III and grade IV groups. (C) Comparison of the mean ADC between the benign and malignant groups. No significant difference was found (p = 0.055). (D) Comparison of the minimum ADC between the benign and malignant groups. The difference is significant (p = 0.001).
No significant difference in the mean ADC was found between the benign (grade I–II, 1.399) and malignant groups [grade III–IV, 1.261; p = 0.055; Fig. 3(C)]; however, a significant difference in minimum ADC was found between these groups [0.860 vs. 0.706; p = 0.001; Fig. 3(D)].
The ADC receiver operating characteristic curves of pathological grades I–II and III–IV are shown in Fig. 4. The minimum ADC had an area under the curve of 0.806 (95% CI 0.693–0.918), whereas that of the mean ADC was 0.679 (95% CI 0.542–0.817). The minimum ADC was superior to the mean ADC for determination of the malignant potential of gliomas.
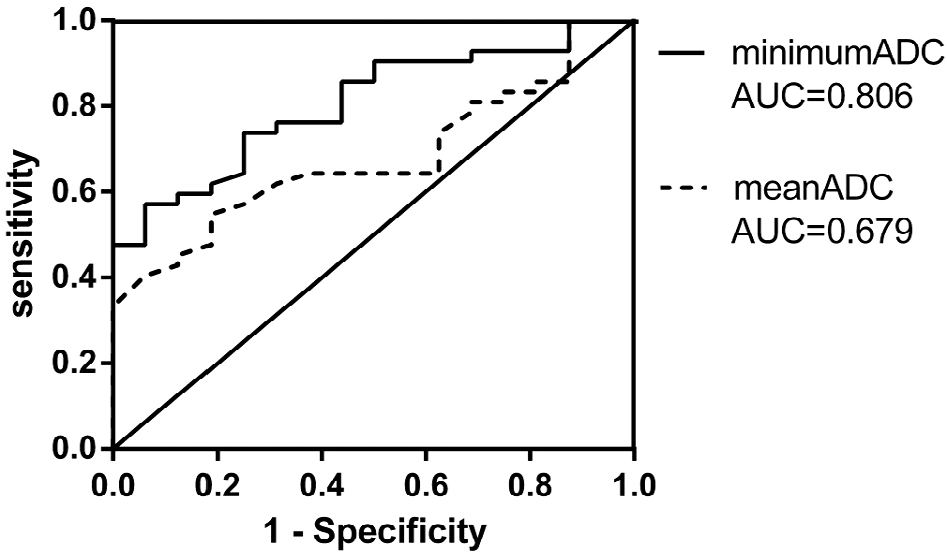
Receiver operating characteristic curves show that the minimum ADC is superior to the mean ADC for determination of the malignant potential of gliomas.
3.4 MRI score and pathological grade
The D, E, and DE scores for each pathological grade were calculated. Pearson’s chi-squared test showed significant differences between the pathological grades for each score (all p-values < 0.0001). The D, E, and DE scores for the malignant and benign groups were also calculated. A significant difference was found between the malignant and benign groups for each score (all p-values < 0.0001). The receiver operating characteristic curves for the D, E, and DE scores and ADC are shown in Fig. 5, with each score demonstrating a significant precision accuracy for tumor classification.
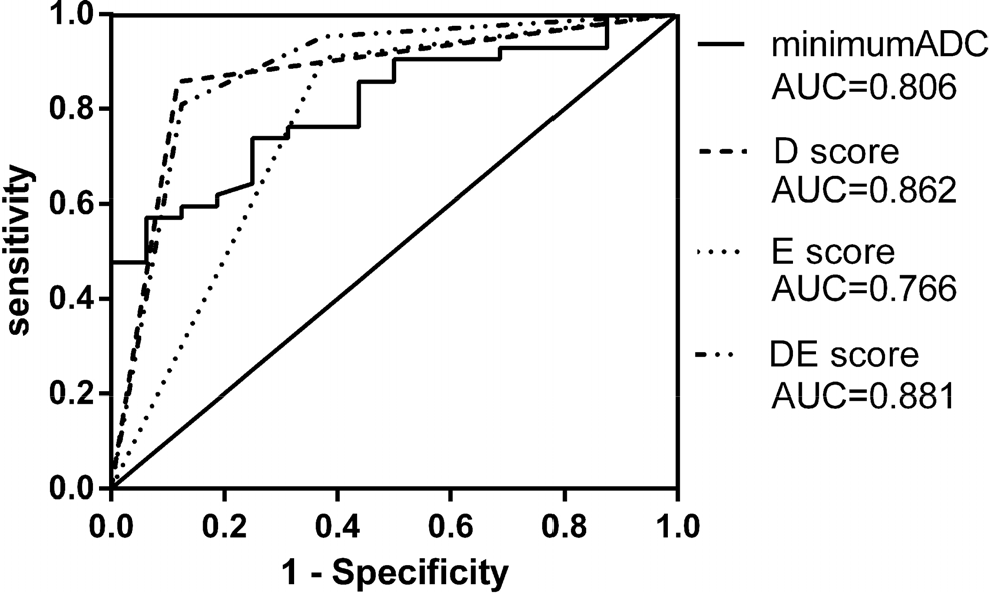
Evaluation of the accuracy of the minimum ADC and D, E, and DE scores.
4 Discussion
DWI is usually used to detect acute ischemic lesions. In tumor tissues, high cellularity is a feature of malignancy; this limits the diffusion of water molecules and leads to a high DWI signal intensity and low ADC values in malignant gliomas [9, 10]. In this study, both the mean and minimum ADCs were significantly negatively correlated with the Ki-67 staining index. The Ki-67 staining index in the group with a D score of 0 was significantly higher than that in the group with a D score of 1. These findings indicate that a low diffusion of water molecules is suggestive of high tumor malignancy. The same relationship was confirmed between the D scores and pathological grades.
Various studies evaluated the degree of water diffusion as a marker of glioma malignancy [1–15], and similar to the current study, they generally placed an ROI within the tumor, excluding the cystic components and hemorrhage, and then quantitatively measured the ADC within the ROI [16, 17]. In this study, the ROI was positioned in the largest section of the tumor, whereas most previous studies used relatively small ROIs, which were then summed. Some studies examined the mean ADC [2, 3, 6, 7, 9, 10], whereas others focused on the minimum ADC [11–15]. In this study, there was a significant correlation between the mean ADC and Ki-67 staining index, showing that low mean ADC values were related to high Ki-67 index values; however, no significant correlation was observed between the mean ADC and pathological grade.
In tumor tissues, vasogenic edema and degeneration (including intratumoral hemorrhage and cystic alteration) are intermingled, and these microscopic changes will inevitably be included in the ROI. Such histological degeneration causes heterogeneity in ADC measurements, which may lead to the recovery of low ADCs. Therefore, in some instances, the mean ADC may not reflect the pathological grade of gliomas [18, 19].
To avoid this phenomenon, the minimum ADC within an ROI was measured, and the most malignant tumor part was localized. The minimum ADC was reported to be correlated negatively with the grade and prognosis of gliomas [12–15]. According to a report by Kim HS and Kim SY [12], the sensitivity and specificity for the determination of glioma grades with a minimum ADC were 90.9 and 81.8, respectively, with a threshold value of 0.98 × 10⁻³ mm/s2. In the present study, there was a significant difference in the minimum ADC between the grade I–II and grade III groups and between the grade I–II and grade IV groups. However, there was no significant difference in the minimum ADC between the grade III and grade IV groups. The receiver operating characteristic curves showed that ADC, especially the minimum ADC, was very informative in distinguishing benign from malignant gliomas.
Receiver operating characteristic curves were constructed to compare the accuracies of the D, E, and DE scores and minimum ADC for the determination of the malignant potential of gliomas. A comparison of the areas under the receiver operating characteristic curves demonstrated that the D score was superior to the minimum ADC (0.862 vs. 0.806, p < 0.05). The area for the DE score was wider than that of the D score (0.881 vs. 0.862), but the difference was not significant. The E score demonstrated a narrower area than the others (Fig. 5). These findings demonstrated that DWI is very useful in determining the malignant potential of gliomas. Although the DE and D scores showed a similar accuracy in determining the malignant potential of gliomas, DWI is more convenient and intuitive for clinical doctors than the combination of DWI and contrast-enhanced imaging [20]. Thus, the D score is considered very informative in this case.
One reason why the D score is superior to ADC may be that the D score was calculated using all tumor-containing slices, whereas ADC was measured in only one slice showing the maximum tumor size. It is possible that the same accuracy could be obtained by measuring the ADC in all slices; however, this procedure is very time-consuming [21, 22].
In clinical practice, it may be difficult to determine whether the signal intensity on DWI is high because of the relatively unclear tumor characteristics compared with gadolinium-enhanced images; benign tumors with the T2 shine-through phenomenon may be interpreted as malignant tumors. An accurate determination of tumor malignancy is critical for patients; therefore, both DWI and gadolinium-enhanced imaging should be performed for an accurate imaging-based diagnosis of brain tumors.
In this study, the Ki-67 staining index was used as a proliferative marker. Recently, molecular pathological studies, including IDH status and 1p/19q codeletion, are required to precisely diagnose central nervous system tumors, as shown in World Health Organization classification. Further investigation concerning the relationship among histological grading, proliferative potential, molecular status, and MRI findings should be conducted for a larger number of malignant glioma cases.
5 Conclusions
The minimum ADC was found to be negatively correlated with the Ki-67 staining index, and a low minimum ADC was suggestive of tumor malignancy. The mean ADC also showed the same tendency, but it was inferior to the minimum ADC. The qualitative evaluation of the D score of water molecule diffusion from DWI accurately reflected the pathological grade of gliomas, and a high signal intensity on DWI is useful in determining the malignant potential of gliomas. This evaluation is not inferior to quantitative analysis using the minimum ADC. The E score from the qualitative evaluation of gadolinium enhancement can reflect the pathological malignancy grade; however, the E score was inferior to the D score. The DE score obtained by combining the D and E scores had a similar diagnostic accuracy to the D score. Based on the finding that even benign tumors have high signal intensities on DWI due to the T2 shine-through phenomenon, gadolinium-enhanced images should still be considered essential for the diagnosis of tumor malignancy.
Footnotes
Ethical approval
This study was a retrospective analysis and approved by the ethics committee of Teikyo University Chiba Medical Center.
Consent
Data were dealt with anonymously, and an informed consent was obtained from each patient.
Conflict of interests
The authors declare no conflict of interests. The authors alone are responsible for the content and writing of the paper.