
Abstract
Objective
This study aims to investigate whether the heart fatty acid‐binding protein (HFABP) in the cerebrospinal fluid (CSF) was a potential predictive biomarker for Alzheimer’s disease (AD).
Methods
We evaluated the associations of CSF HFABP levels with core biomarkers, cognition, and brain structure in a sample population (n = 302) from the Alzheimer’s Disease Neuroimaging Initiative (ADNI) database. Multiple linear regression and mixed‐effects models were employed in the analyses. AD progression was assessed using the Kaplan–Meier survival analysis.
Results
CSF HFABP was higher in patients with mild cognitive impairment and AD than the normal controls (p < 0.001) and was particularly higher in those with amyloid‐β (Aβ) pathologic features. CSF HFABP was associated with higher baseline CSF t‐tau (p < 0.001), CSF p‐tau (p < 0.001), and CSF t‐tau/Aβ42 and CSF p‐tau/Aβ42 (p < 0.01). Moreover, CSF HFABP was found to play predictive roles in hippocampal atrophy (p < 0.01), cognitive decline (p < 0.05), and the risk of AD (p < 0.001).
Conclusion
Our findings suggest that CSF HFABP can be a predictive biomarker of AD.
Keywords
1 Introduction
Alzheimer’s disease (AD) is the most common form of dementia characterized by extracellular amyloid‐β (Aβ) plaques and intracellular neurofibrillary tangles in the brain. Despite many attempts to reveal the pathogenesis of AD, no definitive therapies have been established. Of note, more attention has been paid to how to identify or prevent the disease in the early stage. Recently, a growing number of epidemiological and experimental studies have provided evidence that dyslipidemia can increase the risk of cognitive impairments or AD [1, 2] and participate in AD‐associated pathogenesis [3]. Molecular mechanism studies have revealed that membrane lipids could modulate Aβ metabolism by means of lipid rafts [4]. Besides, gene‐related studies suggest that the apolipoprotein E (APOE) epsilon 4 allele, the strongest genetic risk factor associated with AD [5], has been involved with the metabolism and transport of lipid [6]. Some studies have found that abnormal expression of proteins associated with fatty acid transport can affect the normal growth of the brain, which can lead to cognitive impairment [7, 8]. All these findings support that lipid metabolism plays a vital role in the occurrence of AD and early detection of lipid metabolism abnormalities could be of great value in predicting the development of AD.
As one of the critical proteins in lipid metabolism, heart fatty acid‐binding protein (HFABP) is widely distributed in tissues, including expression in the brain [9], which is mainly responsible for the intracellular transport of long‐chain polyunsaturated fatty acids [10, 11]. Recent research suggests that the levels of cerebrospinal fluid (CSF) HFABP were increased in AD patients [12, 13] and CSF HFABP has a moderate diagnosis value for AD [14]. Furthermore, studies found that CSF HFABP was associated with brain atrophy among people with low CSF Aβ42 [15]. However, relevant studies using CSF HFABP as a predictive tool for neurodegeneration in sporadic AD are rare.
Therefore, we investigated whether CSF HFABP is elevated in AD and associated with CSF biomarkers of AD pathologic features, neuroimaging abnormalities, cognitive impairment, and risk of progression to AD.
2 Materials and methods
2.1 Participants
The data used in this study were downloaded from the Alzheimer’s Disease Neuroimaging Initiative (ADNI) database. The aim of ADNI has been to integrate clinical and neuropsyhological examinations, neuroimaging evaluaion, and biomarkers to study cognitive decline further. The demographic and clinical variables were obtained from the ADNI database. The details about inclusion and exclusion criteria were previously described [16]. In this study, we included 91 participants with normal cognition (or control, CN), 143 patients with mild cognitive impairment (MCI), and 68 patients with AD at baseline. We accessed publicly available data from the ADNI. The participants were enrolled in the ADNI based on the criteria outlined in the ADNI protocol. For the present analyses, we included all participants with CSF multiplex data that went through ADNI quality‐control procedures (defined further on) and were measured for Aβ42, total tau (t‐tau), and phosphorylated‐tau (p‐tau), and underwent neuroimaging or cognitive outcome tests of interest. The ADNI samples for the present study were limited to the individuals who had a blood draw for assessment of HFABP levels (n = 302) at the baseline. We selected the subjects who had completed the annual examinations of flurodeoxyglucose positron emission tomoraphy (FDG‐PET; n = 148, follow‐up = 5 years), hippocampus magnetic resonance imaging (MRI; 233, 5 years), and cognition (298, 5 years) in the longitudinal analysis to lower the influences of attrition bias. As for the AD risk cohort, 234 participants were included in the analysis.
2.2 Measurement of CSF biomarkers
All the CSF samples were obtained from the participants in the morning, stored in a freezer at the –80 °C, and aliquoted and processed according to ADNI’s standardized operating procedures. The concentrations of Aβ42, t‐tau, and p‐tau in the CSF were measured using the Elecsys (Roche) assays on the fully automated Elecsys cobas e601 analyzer. The Elecsys immunoassays are electrochemiluminescence immunoassays, based on the quantitative sandwich principle, with an 18‐min duration. CSF HFABP was calculated as a part of a CSF multiplex proteomic processing stream using an xMAP multiplex panel (MyriadRBM) with better sensitivity and repeatability. Also, the rescaling process improved the precision performance across time and different batches of reagents to overcome the batch effect, as previously described [16]. Lastly, the participants were classified as Aβ‐positive or Aβ‐negative using a previously established cutoff CSF Aβ42 value of less than 1098 ng/L [17].
2.3 Cognition
The cognitive assessments for this study included MMSE, Alzheimer Disease Assessment Scale‐cognitive subscale (ADAS‐Cog), episodic memory (ADNI‐MEM), and executive function (ADNI‐EF). The last two assessments are comprehensive evaluations of cognitive performance as previously reported [18, 19].
2.4 Neuroimaging
Structural brain images were acquired using a 1.5‐T MRI system with T1‐weighted MRI scans with a sagittal volumetric magnetizationprepared rapid acquisition gradient echo sequence. The images for hippocampal volume were processed with the FreeSurfer image analysis suite version 4.3 (http://surfer.nmr.mgh.harvard.edu/). The subjects were injected with a dose of 18F‐FDG to study cerebral glucose metabolism using a PET scan. The cerebral brain metabolism was examined with the mean FDG‐PET counts of the lateral and medial frontal regions, anterior and posterior cingulate regions, and lateral parietal and temporal regions.
2.5 Statistical analysis
The intergroup differences of demographic factors were analyzed using the Chi‐square test and Kruskal–Wallis test for categorical and continuous variables, respectively. The Spearman rank correlation analysis was used to analyze the relationship between CSF levels of HFABP and age. Linear regression was used to explore the associations between CSF HFABP and other biomarkers, including CSF Aβ42, CSF t‐tau, CSF p‐tau, t‐tau/Aβ42, p‐tau/Aβ42, cognition measure, and hippocampal volume. We tested associations of CSF HFABP with longitudinal cognition, hippocampal volume, and brain metabolism using linear mixed‐effects models. The time‐by‐exposure interaction terms were tested to examine whether CSF HFABP was associated with the changes in the given outcomes, such as MMSE, ADAS11, MEM, EF, hippocampal volume, and FDG. All the regression analyses were adjusted for age, gender, educational level, cognitive diagnosis, APOE ε4 genotype, type 2 diabetes mellitus, hypertension, hyperlipidemia, depression, cardiovascular disease, and body mass index. The analysis of brain atrophy was adjusted additionally for intracranial volume. The baseline levels of t‐tau were adjusted in the longitudinal analysis. In addition, we excluded four of the Aβ‐negative patients with AD in the baseline and longitudinal analysis. The diagnostic accuracy of the various biomarkers was assessed by the area under the curve of the receiver operating characteristic (ROC) curve. The Kaplan–Meier survival analysis was employed for the HFABP using the optimal cutoff for dichotomizing HFABP values determined from the Youden index [20]. All data analyses were performed using the R software (R, Version 3.2.3; The R Foundation). The p‐values less than 0.05 were considered significant for all the statistical analyses.
3 Results
3.1 Participant demographics
The demographic and clinical variables of the participants (Table 1) revealed no significant differences in age and educational level among the three diagnostic groups, CN, MCI, and AD. However, small differences were found in the gender among these groups. In addition, there were significant differences in CSF levels of Aβ42 (p < 0.001), t‐tau (p < 0.001), p‐tau (p < 0.001), HFABP (p < 0.001), and depression (p < 0.01) among the groups. In the entire cohort, there was a positive correlation between the CSF levels of HFABP and age (Spearman r = 0.11, p < 0.05) (Supplementary Fig. 1). CSF HFABP was also correlated with gender (mean, 3.4 ng/mL for women compared to 4.1 for men; p < 0.01) (Supplementary Fig. 2).
The demographics of the study population.
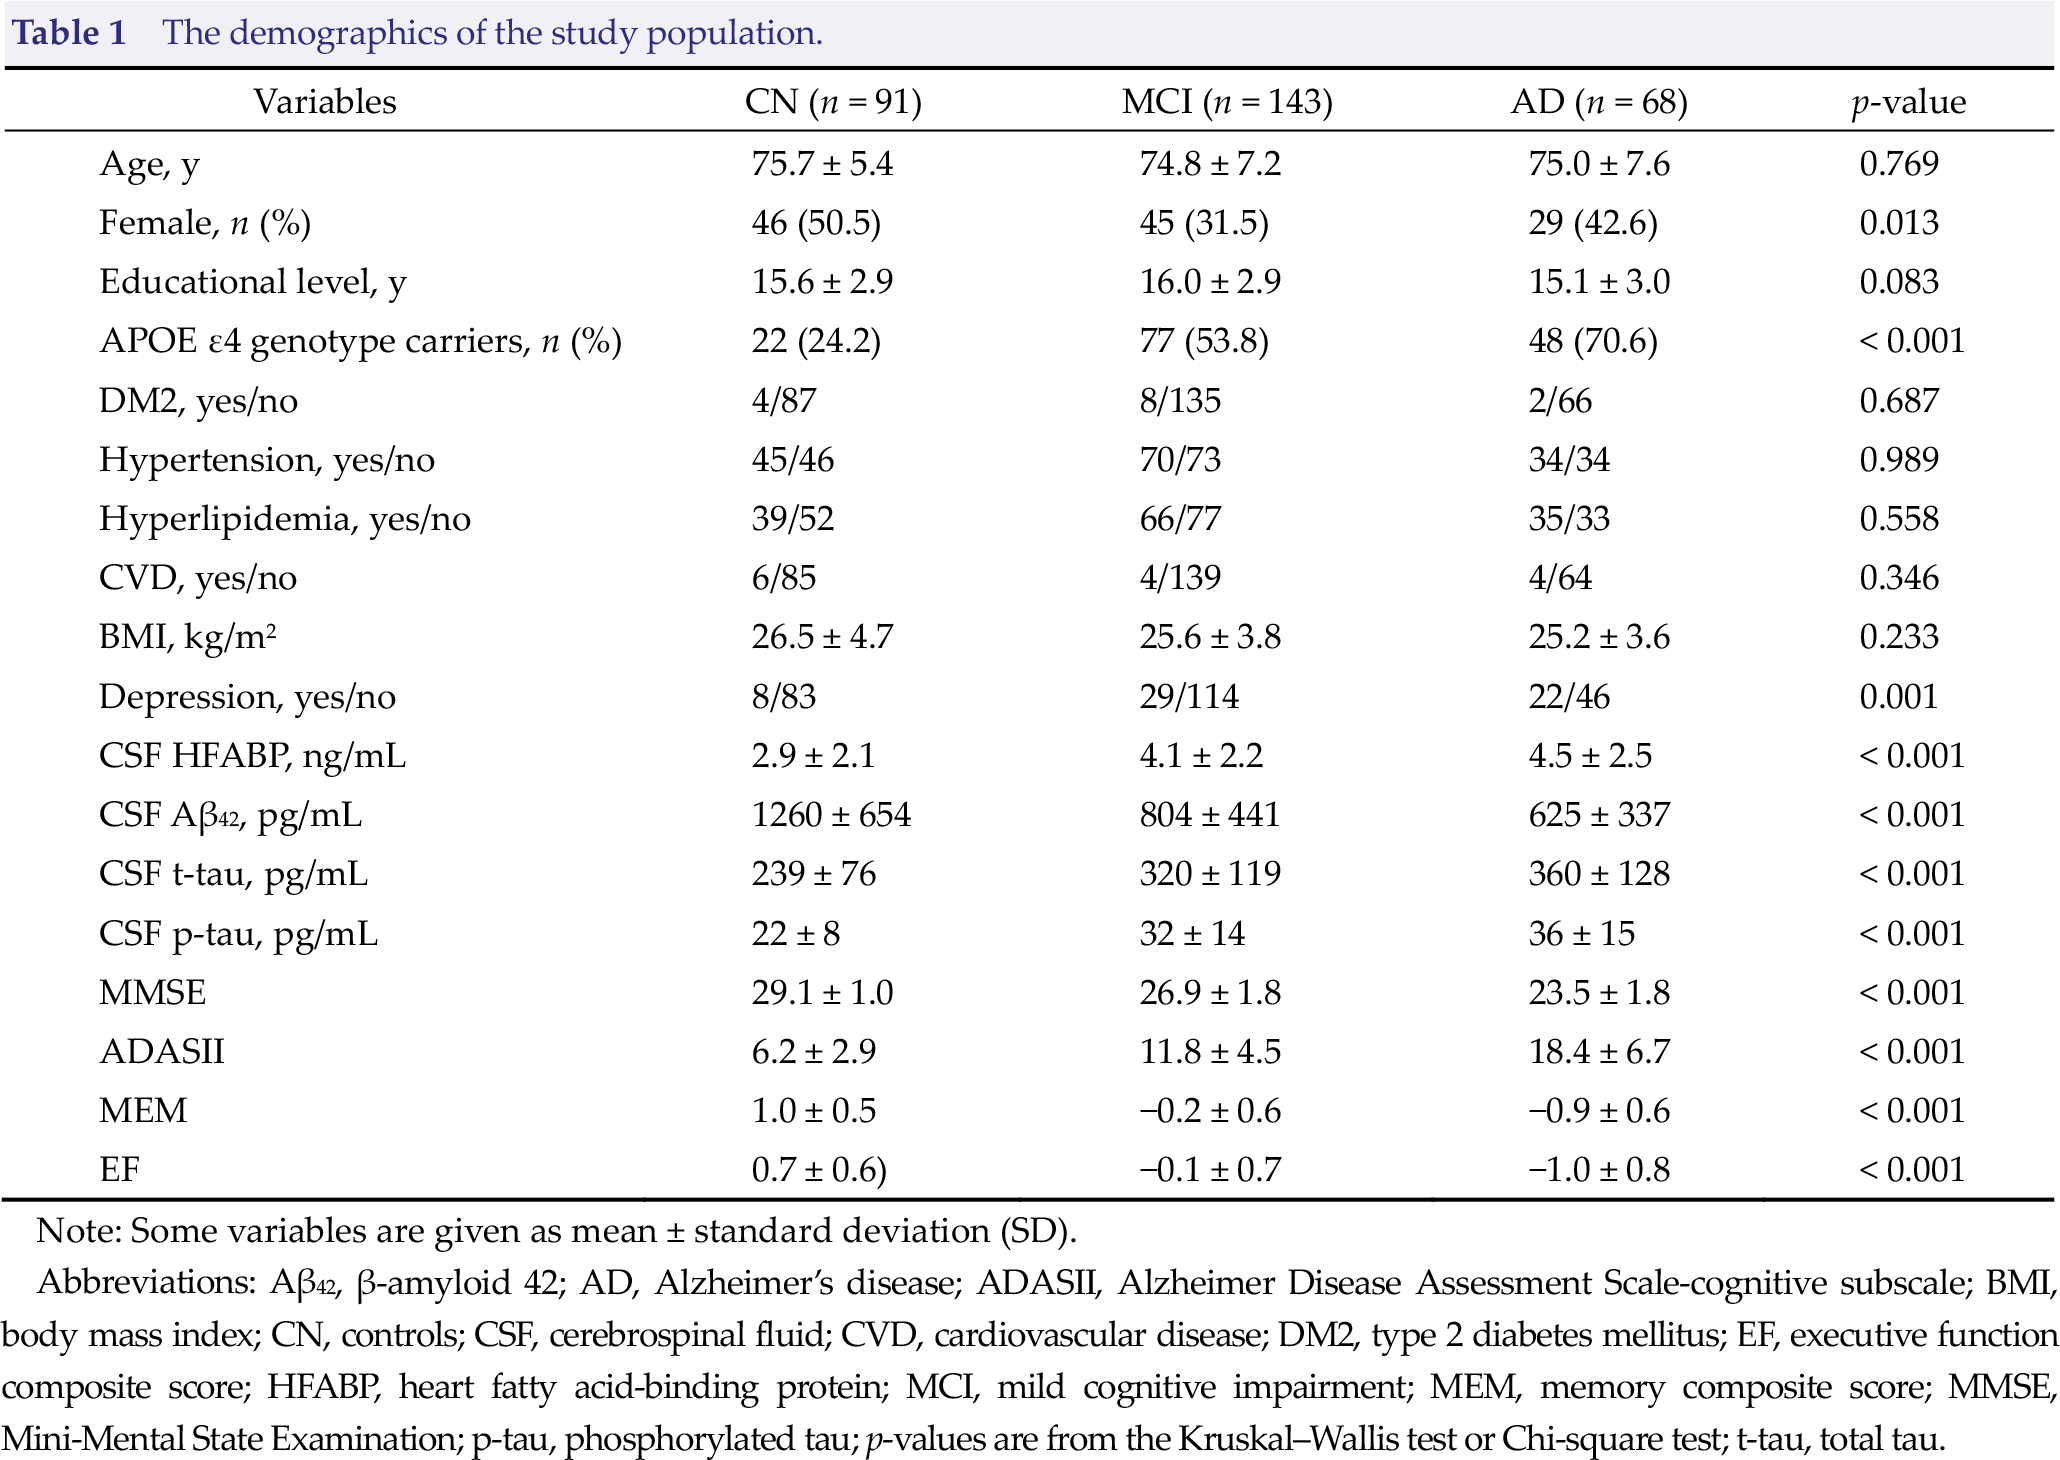
Note: Some variables are given as mean ± standard deviation (SD).
Abbreviations: Aβ42, β‐amyloid 42; AD, Alzheimer’s disease; ADASII, Alzheimer Disease Assessment Scale‐cognitive subscale; BMI, body mass index; CN, controls; CSF, cerebrospinal fluid; CVD, cardiovascular disease; DM2, type 2 diabetes mellitus; EF, executive function composite score; HFABP, heart fatty acid‐binding protein; MCI, mild cognitive impairment; MEM, memory composite score; MMSE, Mini‐Mental State Examination; p‐tau, phosphorylated tau; p‐values are from the Kruskal–Wallis test or Chi‐square test; t‐tau, total tau.
3.2 CSF HFABP in different subgroups
The CSF HFABP concentrations were found to be higher in the AD (p < 0.001) and MCI group (p < 0.001) compared to the controls [Fig. 1(A)]. CSF HFABP successfully discriminated between AD patients and the controls at the best cutoff of 3.55, with the area under the receiver operating characteristic curve (AUC) of 0.70 [Fig. 2(A)]. By comparison, CSF Aβ42 discriminated between AD and the controls with the AUC of 0.85, CSF t‐tau discriminated between AD and the controls with the AUC of 0.80, and CSF p‐tau discriminated between AD and the controls with the AUC of 0.80. With regard to the amyloid status, CSF HFABP discriminated between the Aβ‐positive AD patients and the Aβ‐negative controls, with an AUC of 0.68 (Supplementary Fig. 3).
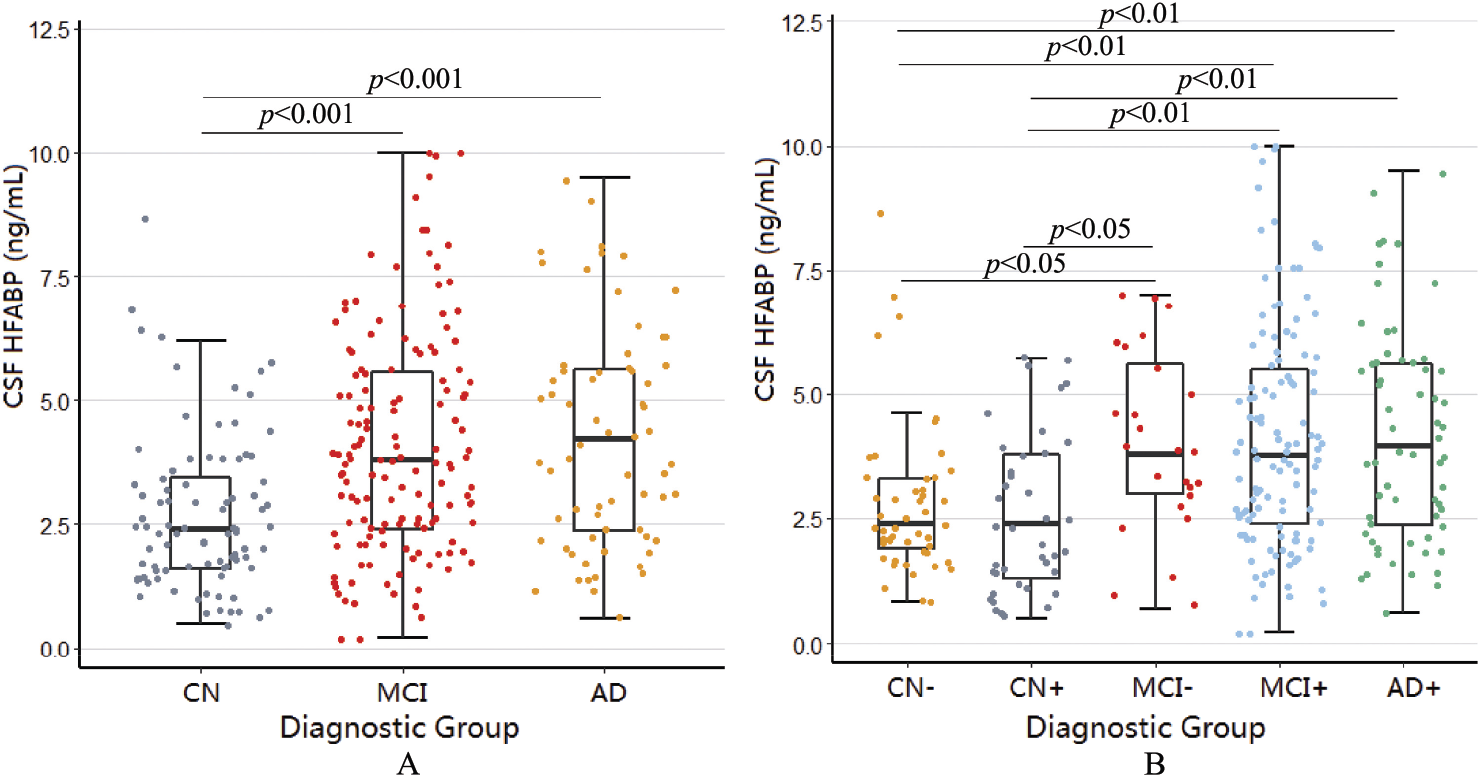
The levels of CSF HFABP in different subgroups. (A) The CSF levels of HFABP in the CN, MCI, and AD patients. (B) The CSF levels of HFABP in the CN, MCI, and AD patients were stratified by Aβ positivity with the CSF Aβ42 cutoff value of less than 1098 ng/L. The differences between the groups were analyzed using a Kruskal–Wallis test. AD, Alzheimer’s disease; CN, control; MCI, mild cognitive impairment.
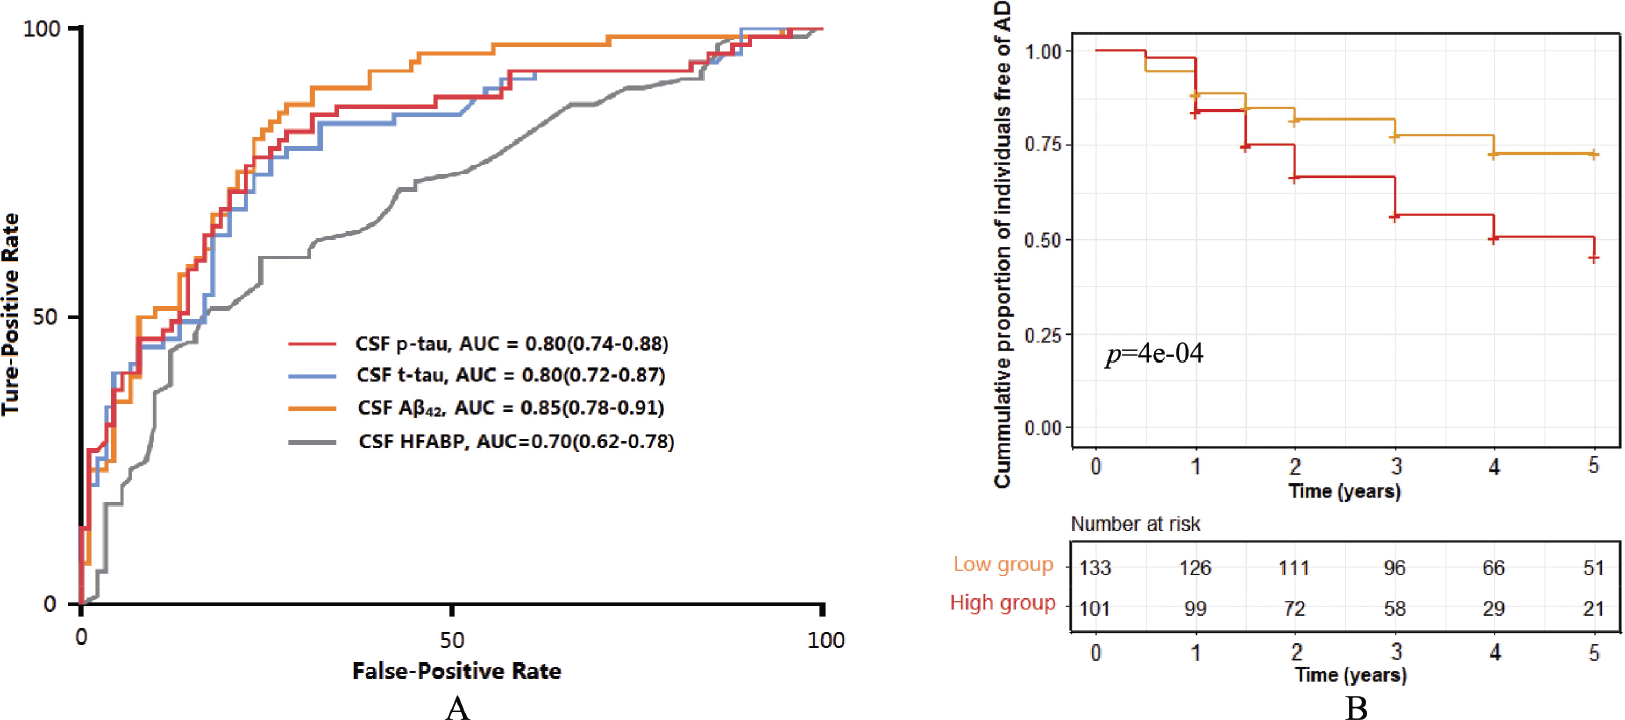
The association between CSF HFABP and AD risk. (A) The AUC analyses for CSF HFABP and other biomarkers in the AD and control groups. (B) The Kaplan–Meier curves of progression from cognitively normal (CN) and MCI to AD for CSF HFABP.
According to a combination of clinical diagnosis and Aβ pathologic features, we divided the entire population into the Aβ‐negative control (CN−), Aβ‐positive control (CN+), Aβ‐negative MCI (MCI−), Aβ‐positive MCI (MCI+), and Aβ‐positive AD (AD+) patients and compared the level of CSF HFABP among these groups [Fig. 1(B)]. The AD+ group, at the mean of 4.4 ng/L, had higher CSF HFABP than the CN− group at 2.9 (p < 0.001) and the CN+ group 2.7 (p < 0.01). Moreover, the MCI+ group, at the mean of 4.1 ng/L, had higher CSF HFABP than the CN− group (p < 0.01) and the CN+ group (p < 0.05). The MCI− group, at the mean of 4.0 ng/L, also had higher CSF HFABP than the CN− group (p < 0.05) and the CN+ group (p < 0.05).
3.3 CSF HFABP and CSF AD biomarkers
At the baseline, CSF HFABP was found to be correlated with a high level of CSF t‐tau (p < 0.001), CSF p‐tau (p < 0.001), and CSF t‐tau/Aβ42 (p < 0.001) and high p‐tau/Aβ42 (p < 0.001). However, CSF HFABP was not correlated with a lower level of CSF Aβ42 (p > 0.05) in the entire cohort. All these associations remained significant in all diagnostic subgroups of CN, MCI, and AD (p < 0.01) (Table 2).
The association between CSF HFABP and CSF AD biomarkers.
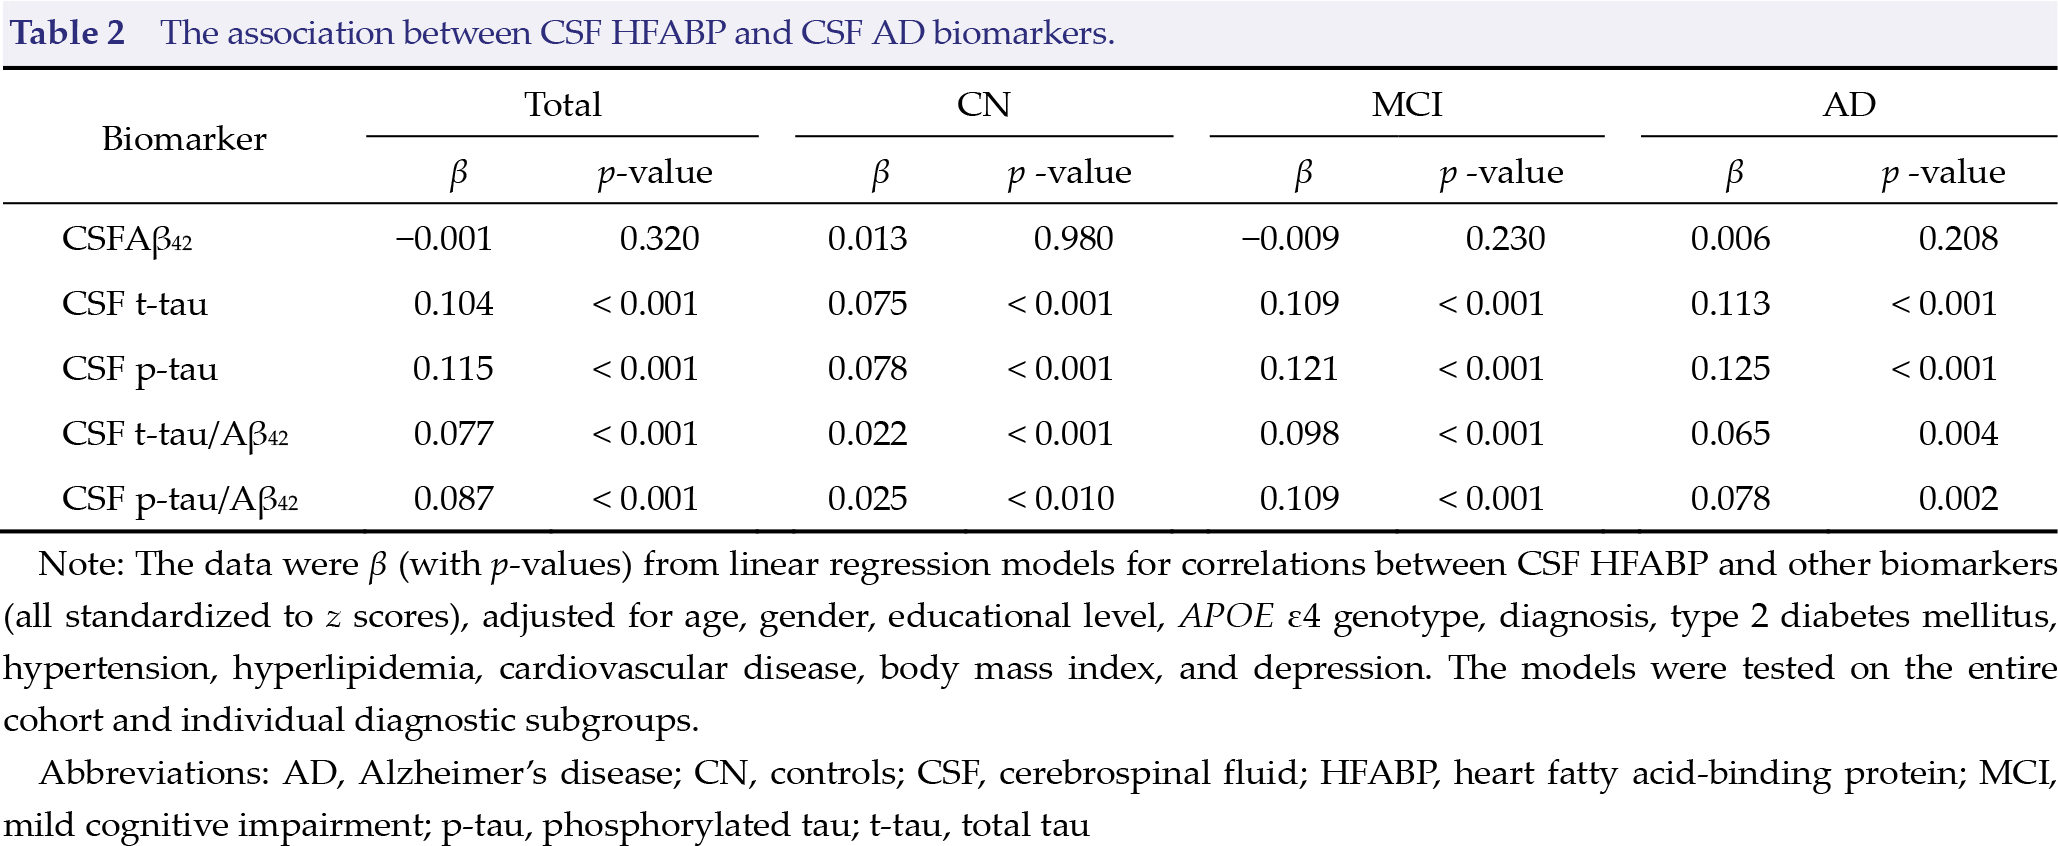
Note: The data were β (with p-values) from linear regression models for correlations between CSF HFABP and other biomarkers (all standardized to z scores), adjusted for age, gender, educational level, APOE ε4 genotype, diagnosis, type 2 diabetes mellitus, hypertension, hyperlipidemia, cardiovascular disease, body mass index, and depression. The models were tested on the entire cohort and individual diagnostic subgroups.
Abbreviations: AD, Alzheimer’s disease; CN, controls; CSF, cerebrospinal fluid; HFABP, heart fatty acid‐binding protein; MCI, mild cognitive impairment; p‐tau, phosphorylated tau; t‐tau, total tau
3.4 CSF HFABP and cognitive performance and neuroimaging measurements
The associations of CSF HFABP with longitudinal cognitive and imaging measurements were examined (Fig. 3), and the related coefficients and p‐values were calculated (Supplementary Table 1). At the baseline, the level of CSF HFABP was not significantly associated with cognitive performance and imaging measurements. In the longitudinal analysis, higher CSF HFABP was associated with an accelerated decline for MMSE, ADAS11, MEM, and EF. Among all the cognitive measurements, the strongest influence was found in MMSE (β = −0.03, p < 0.001). As for the imaging measurements, higher CSF HFABP was associated with faster hippocampus atrophy (β = −0.01, p < 0.01), but not with FDG (p > 0.05) (Supplementary Table 1). Considering the strong correlation between tau and CSF HFABP, we repeated the longitudinal analysis after adjusting for baseline levels of t‐tau and obtained the same results. We then explored whether the significant associations were driven by amyloid status and conducted subgroup analyses stratified by CSF Aβ42. We found the above associations to remain significant in Aβ‐positive participants (Supplementary Table 2).
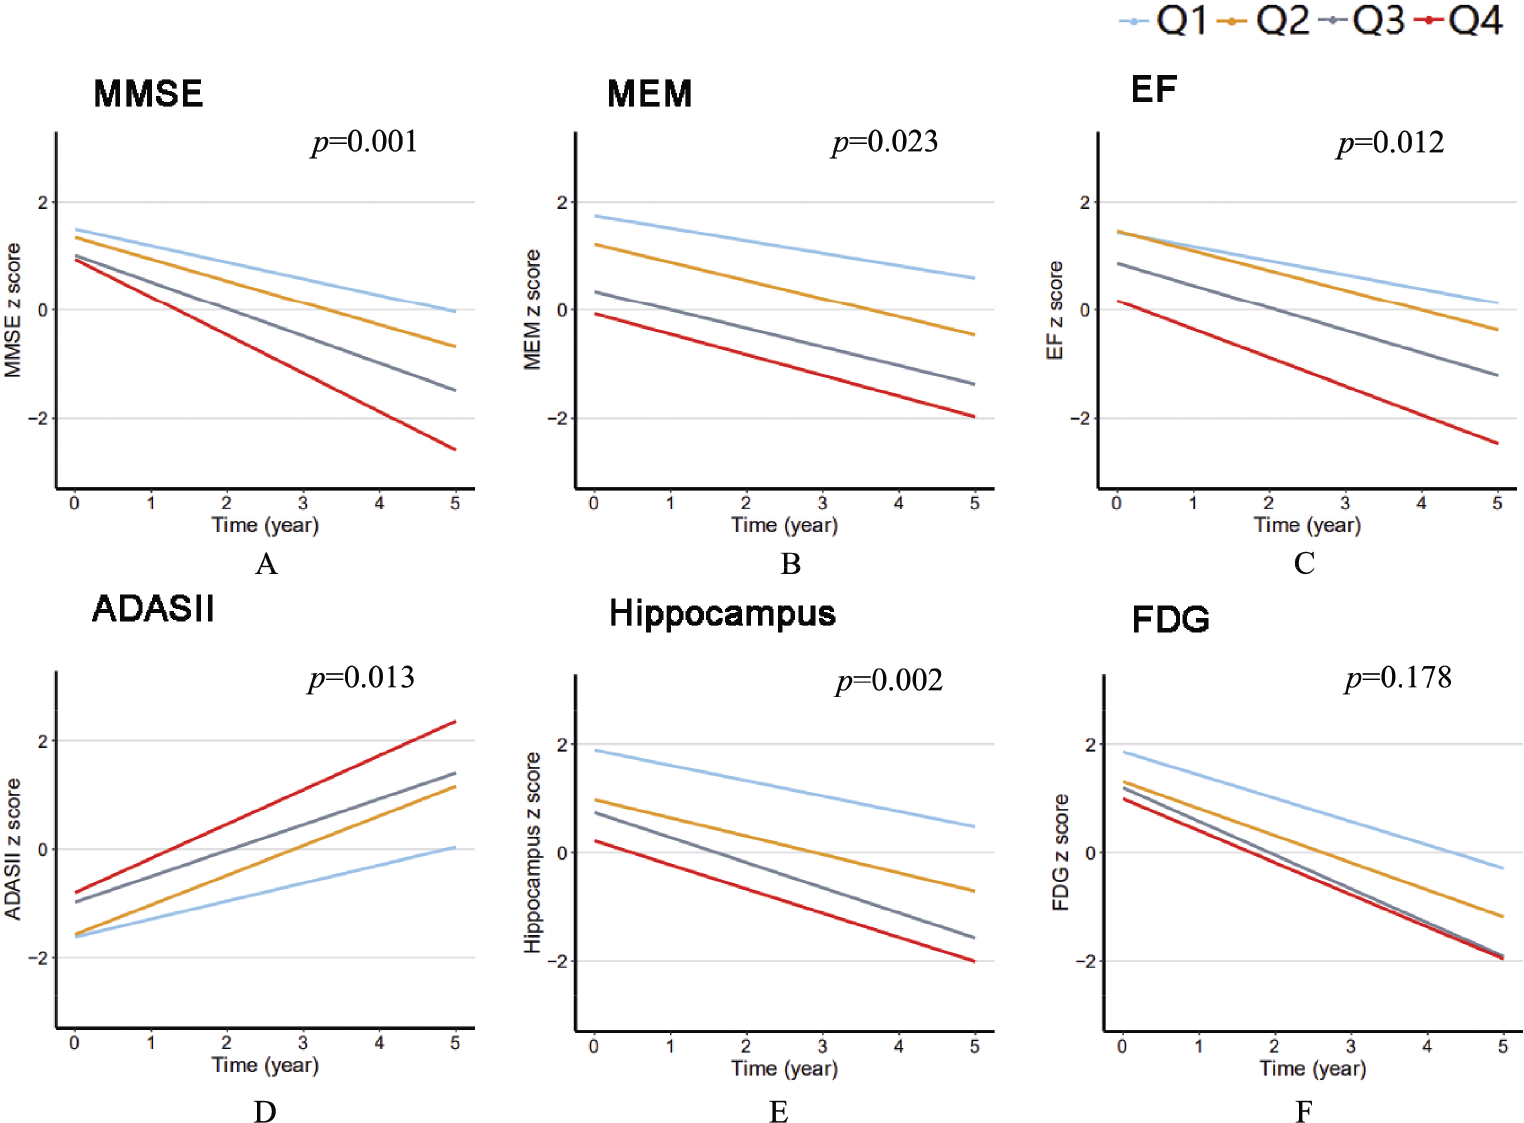
The associations between CSF HFABP and AD phenotypes. The data from linear mixed‐effects models were adjusted for age, gender, educational level, APOE ε4 genotype, cognitive diagnosis, type 2 diabetes mellitus, hypertension, hyperlipidemia, cardiovascular disease, body mass index, and depression, as well as the intracranial volume for the HFABP quartiles for hippocampal volume. MMSE, Mini‐Mental State Examination; MEM, episodic memory; EF, executive function; ADASII, Alzheimer Disease Assessment Scale‐cognitive subscale; FDG, 18F‐fluorodeoxyglucose; Q, quartile
3.5 CSF HFABP and risk of AD
Next, we further studied the correlation between CSF HFABP and the risk of AD. The 234 non‐demented participants (CN = 91, MCI = 143) included in this analysis were further categorized into low (n = 133, < 3.55 ng/mL) and high (n = 101, ≥ 3.55 ng/mL) CSF HFABP groups according to the same cutoff values of 3.55 ng/mL obtained from the two ROC analyses. Of the 234 participants, 80 of the 101 (79.2%) participants with high CSF HFABP and 82 of the 133 (61.7%) participants with low CSF HFABP progressed to AD during the follow‐up period. The Kaplan–Meier curves for the baseline HFABP groups [Fig. 2(B)] indicated that the participants with high levels of CSF HFABP had an increased risk of developing AD (p < 0.001).
4 Discussion
In this study, we explored the relationship between HFABP and AD from various aspects and made some significant observations. First, we found that CSF HFABP was increased in the AD dementia group and the MCI+ group, according to pathological and clinical diagnoses. Also, a higher CSF HFABP was significantly associated with higher levels of CSF t‐tau, CSF p‐tau, t‐tau/Aβ42, and p‐tau/Aβ42 regardless of the cognitive diagnosis. In addition, the higher CSF HFABP was associated with faster cognitive decline and hippocampal atrophy during the follow‐up period. Lastly, the participants with a higher CSF HFABP were found to have an increased risk of AD progression. In summary, our study provides a comprehensive analysis and compelling evidence in support of CSF HFABP as a promising predictive biomarker for progression to AD. The use of CSF HFABP may enable the early identification of individuals at risk of AD and guide early intervention.
We observed that the CSF levels of HFABP were elevated in the MCI and AD groups and that CSF HFABP had a negative association with cognitive decline; the results were consistent with the previous studies [21, 22]. In addition, in the brains of patients with AD, HFABP was significantly decreased in the frontal, temporal, occipital, and parietal cortices [23]. These findings further supported the hypothesis of HFABP leaking into the interstitial fluid and further into the CSF.
In recent years, studies have demonstrated that Aβ deposition is a crucial feature of AD. In the study, we included Aβ pathology into the subgroup analysis. Notably, the CSF level of HFABP was primarily increased in the MCI− and MCI+ groups. These results suggest that HFABP can be used in drug development, which mainly focuses on the early stage of AD [24], and in clinical practice because more patients with MCI are seeking comprehensive medical evaluation.
In our cohort, there was no significant difference in the CSF level of HFABP between the CN+ (preclinical AD) and CN− groups, consistent with the theory that substantial neuronal injury was absent in preclinical AD [25, 26]. Moreover, we found no significant difference in CSF HFABP between the MCI+ and AD groups. This result might be caused by the ceiling effect, which is based on the theory that the change rates of Aβ markers slowed down as AD progressed [27]. In addition, CSF HFABP has a comparable diagnostic value to three traditional CSF biomarkers (Aβ42, t‐tau, and p‐tau). AD likely involves multiple mechanisms and factors; therefore, CSF HFABP may facilitate the diagnosis and prediction of AD.
CSF HFABP was found to be significantly associated with CSF t‐tau and CSF p‐tau, but not with Aβ42, in line with a previous finding [13]. The association of CSF HFABP with t‐tau, a reliable marker of neuronal injury, suggested that CSF HFABP might reflect the same pathological process, such as axonal damage, with t‐tau. These data further verified the roles of HFABP in the formation of neurite and synapse and the activity of cholinergic and glutamatergic neurons [28, 29]. Previous research also found that a high CSF level of HFABP was associated with blood–brain barrier dysfunction [30]. These findings further suggested that HFABP might influence tau pathology indirectly through the blood–brain barrier. Our results demonstrated that CSF HFABP was involved in the early pathological changes of tau during the development of AD. At the same time, we found that high CSF HFABP was associated with faster hippocampus atrophy, further suggesting that intracranial lipid biology may influence the neurodegeneration of AD [31]. In addition, our results showed that CSF HFABP could predict future changes of hippocampal atrophy and changes in cognition, especially for the Aβ+ participants, consistent with the hypothesis about the disease characteristics and process of AD [26].
In summary, our results demonstrated the predictive power of CSF HFABP for AD in a more comprehensive and detailed manner including cross‐sectional and longitudinal analyses. However, our study had some limitations. First, our sample size was relatively modest. Also, the patients with other neurodegenerative diseases than AD were not included in our study; therefore, it was difficult to determine the disease specificity of CSF HFABP. In addition, we did not test for changes in CSF HFABP over time and could not assess the impact of its dynamic changes on the results.
5 Conclusion
CSF HFABP may be a valuable tool for evaluating neurodegeneration, identifying individuals at risk for cognitive decline and brain structure atrophy, and predicting disease progression. However, more longitudinal studies are warranted to confirm the associations in the future.
Footnotes
Ethical approval
The ADNI study was approved at each study site across the United States and Canada, and all study participants provided written informed consent.
Conflict of interests
The authors declared no potential conflict of interests with respect to the research, authorship, and/or publication of this article.
Financial support
Data collection and sharing for this project was funded by the Alzheimer’s Disease Neuroimaging Initiative (ADNI) (National Institutes of Health Grant U01 AG024904) and DOD ADNI (Department of Defense award number W81XWH‐12‐2‐0012). ADNI is funded by the National Institute on Aging, the National Institute of Biomedical Imaging and Bioengineering, and through generous contributions from the following: AbbVie, Alzheimer’s Association; Alzheimer’s Drug Discovery Foundation; Araclon Biotech; BioClinica, Inc.; Biogen; Bristol‐Myers Squibb Company; CereSpir, Inc.; Cogstate; Eisai Inc.; Elan Pharmaceuticals, Inc.; Eli Lilly and Company; EuroImmun; F. Hoffmann‐La Roche Ltd and its affiliated company Genentech, Inc.; Fujirebio; GE Healthcare; IXICO Ltd.; Janssen Alzheimer Immunotherapy Research & Development, LLC.; Johnson & Johnson Pharmaceutical Research & Development LLC.; Lumosity; Lundbeck; Merck & Co., Inc.; Meso Scale Diagnostics, LLC.; NeuroRx Research; Neurotrack Technologies; Novartis Pharmaceuticals Corporation; Pfizer Inc.; Piramal Imaging; Servier; Takeda Pharmaceutical Company; and Transition Therapeutics. The Canadian Institutes of Health Research is providing funds to support ADNI clinical sites in Canada. Private sector contributions are facilitated by the Foundation for the National Institutes of Health (![]() ). The grantee organization is the Northern California Institute for Research and Education, and the study is coordinated by the Alzheimer’s Therapeutic Research Institute at the University of Southern California. ADNI data are disseminated by the Laboratory for Neuro Imaging at the University of Southern California.
). The grantee organization is the Northern California Institute for Research and Education, and the study is coordinated by the Alzheimer’s Therapeutic Research Institute at the University of Southern California. ADNI data are disseminated by the Laboratory for Neuro Imaging at the University of Southern California.
Authors’ contributions
JTY and LT conceptualized the study. LP and YNO analyzed and interpreted the data, drafted and revised the manuscript, did the statistical analysis, and prepared all the figures. All authors interpretation of the data and revision of the manuscript. All authors contributed to the writing and revisions of the paper and approved the final version.
Data used in preparation of this article were obtained from the Alzheimer’s Disease Neuroimaging Initiative (ADNI) database (adni.loni.usc.edu). As such, the investigators within the ADNI contributed to the design and implementation of ADNI and/or provided data but did not participate in analysis or writing of this report. A complete listing of ADNI investigators can be found at: ![]() .
.