
Abstract
Purpose:
Even in years after recovery from moderate traumatic brain injury (moderate TBI), patients complain about residual cognitive impairment and fatigue. We hypothesized that non‐linear and linear resting‐state electroencephalography (rsEEG) features might also reflect neural underpinnings of these deficits.
Methods:
We analyzed a 10‐minute rsEEG in 77 moderate TBI‐survivors and 151 healthy volunteers after cognitive and psychological assessment. The rsEEG analysis included linear measures, such as power spectral density and peak alpha frequency, and non‐linear parameters such as Higuchi fractal dimension, envelope frequency, and Hjorth complexity.
Results:
The patients with moderate TBI had higher scores for fatigue and sleepiness and lower scores for mood and life satisfaction than controls. The behavioral test for directed attention showed a smaller and non‐significant between‐group difference. In rsEEG patterns, moderate TBI‐group had significantly higher deltaand theta‐rhythm power, which correlated with higher sleepiness and fatigue scores. The higher beta and lower alpha power were associated with a higher attention level in moderate TBI patients. Non‐linear rsEEG features were significantly higher in moderate TBI patients than in healthy controls but correlated with sleepiness and fatigue scores in both controls and patients.
Conclusion:
The rsEEG patterns may reflect compensatory processes supporting directed attention and residual effect of moderate TBI causing subjective fatigue in patients even after full physiological recovery.
Keywords
1 Introduction
In most cases, patients with moderate traumatic brain injury (moderate TBI) regain consciousness and have a good outcome according to the Glasgow Outcome Scale (GOS) [1]. At the same time, despite the full recovery of consciousness and cognitive functions, patients with moderate TBI often experience difficulty with psychosocial adaptation. Not all patients, who were employed before TBI, return to a full‐time job even years after their recovery [1, 2]. Frequently, patients with moderate TBI suffer from cognitive impairment or emotional and functional deficits that prevent them from performing routine activities at work [3]. Even in successful recovery and a return to previous social activities, patients eventually complain of sleep disturbances, fatigue, cognitive deficit, emotional failures, and stress coping [4].
When the Glasgow Outcome Scale fails to predict these complaints, does neuroimaging techniques, such as EEG, can capture this relationship between patient cognitive disabilities and the persistent changes in brain function that occur after moderate TBI? Anatomical studies consistently report that moderate to severe TBI causes irreversible brain impairment. Even patients with higher probability outcomes after TBI had atrophy of the cerebral cortex [5], decreased thalamus volume and a pathological reduction in the gray and white matter [6]. The structural atrophy consequently influences changes in the brain activity reflected by EEG. For example, spectral EEG parameters showed high sensitivity to the severity of the TBI and injury associated consequences such as migraine or sleep disorders [7]. The following linear and stochastic EEG patterns were also altered in moderate TBI patients: power spectral density (PSD), the peak of alpha‐frequency (PAF), EEG discriminant score, Tsallis entropy, Higuchi fractal dimension (HFD), and EEG‐band envelope frequency [8 –11]. Accordingly, some of these EEG parameters were proposed as biomarkers of brain injury severity [8, 9]. The mentioned above non‐linear EEG features were associated with moderate to severe cognitive and mental impairment of patients. However, mild impairment also correlated with non‐linear EEG changes. In the previous studies, we showed that Hjorth complexity, envelope frequency, and ratio were sensitive to emotionally charging stimuli in patients with various neurological or mental disorders [12]. Further, we proposed that these non‐linear patterns of EEG could assess possible trauma‐induced mood changes in patients [13]. In this study, we also hypothesized that altered non‐linear patterns of resting‐state EEG could indicate both the chronic mood changes and cognitive deficits in patients previously suffering moderate TBI.
The persistent changes in brain activity, previously detected in patients with moderate TBI, can be injury‐dependent and can reflect the neuroplastic changes required for the recovery of cognitive functions after a TBI. Many EEG studies have previously explored injurydependent brain changes and indicated a strong correlation between EEG dynamics and variable cognitive impairments [14 –16]. The PSD and the rhythm variability correlated with the worst results on the ongoing attentional task [10]. At the same time, fMRI studies consequently report a strong correlation between increased activity in the specific brain areas and improved cognitive functions [17 –19]. Patients after moderate TBI had reduced activation in the anterior cingulate cortex (ACC), supplementary motor area, temporal and occipital regions, and cerebellum, which occurred in parallel with reduced performance on the attention task compared with control subjects [20, 21]. After successful cognitive rehabilitation, patients showed an improvement in attention task performance accompanied by increased activation in the ACC, precuneus, and cerebellum [21].
However, a few studies have explored an association of EEG patterns with an improveent of cognitive and affective functions based on the plastic compensatory changes after TBI. Since EEG is a more affordable method in out‐ofhospital studies than MRI, it would be more efficient to establish EEG‐biomarkers of psychological and physiological well‐being in moderate TBI survivors.
We hypothesized that EEG might reflect both the brain dysfunction and compensatory neuroplastic changes in patients with moderate TBI after apparent recovery and returning moderate TBI to their premorbid life activities. To identify possible EEG indices of brain impairment, we compared patterns of restingstate EEG in healthy controls and patients more than a year after moderate TBI. To test the EEG association with compensatory changes after moderate TBI, we correlated linear and non‐linear EEG metrics with ratings of selfreport well‐being, as well with the behaviorally measured attentional level of patients with moderate TBI.
2 Methods
2.1 Participants
Seventy‐seven patients (31.8 ± 14.3 y.o., 40 males) after moderate TBI appeared 432 ± 45.1 days ago corresponded to the diagnostic criteria [22, 23] were recruited in the study via outpatient observation in the Sklifosovsky Research Institute of Emergency Care, NN. Burdenko National Scientific and Practical Center for Neurosurgery, and University’s Clinic of Lomonosov Moscow State University from 2014 to 2017. TBI patients were recruited basing on their medical history during neurological examination. The average length of total hospital stay at the first admission after TBI (including intensive care unit) was 12.6 ± 1.1 days. Structural MRI screening showed no focal brain lesions. All of the patients were fully recovered from the injury by the Extended Glasgow Outcome Scale [24] and returned to the usual activities without undergoing hospital rehabilitation.
A control group consisted of 151 healthy volunteers (29.2 ± 12. y.o., 80 males) recruited via social networks (social media ads, E‐mail and flyers) after a preliminary survey. The groups of participants were age‐matched (from 20 to 40 years old). All participants were right‐handed, native Russian speakers, born and raised in Russia, without alcohol and substance abuse, physical illness, mental disorder, or history of trauma.
The Ethics Committee of the Institute of Higher Nervous Activity and Neurophysiology of the Russian Academy of Science (IHNA & NPH RAS) approved the study protocol following the Code of Ethics of the World Medical Association (Declaration of Helsinki) for experiments involving humans. All patients and healthy volunteers signed a written informed concern before the study.
2.2 Procedure
Participants were welcomed to appoint a visit to the laboratory between 12.00 and 15.00. Female participants were asked to schedule the visit at the follicular phase (4–12 days of their menstrual cycle). Before EEG recordings, participants filled subjective rating questionnaires and passed behavioral tests. Then they were asked to lay supine on a bed in an acoustically and electrically shielded chamber with eyes closed during a 10‐minute resting‐state EEG acquisition. During the recording, subjects were instructed to close their eyes, remain calm, avoid falling asleep, and avoid thinking about anything specific
2.3 Psychological assessment
We asked all participants to fill a paper‐based Checklist Individual Strength‐20 Questionnaire (CIS‐20) [25], which provides a total fatigue score and scores for four components of fatigue: the subjective experience of fatigue, reduced concentration, reduced motivation, and reduced physical activity level. Participants use a seven‐point rating scale (1 ″true″ to 7 ″not true″). The Epworth Sleepiness Scale (ESS) [26] and Stanford Sleepiness Scale (SSS) [27] were used to determine the usual daytime sleepiness and current individual level of sleepiness before the EEG acquisition.
Then participants also filled in a self‐reported questionnaire on Wessman‐Ricks Mood Scale (WRMS) [28] about an emotional state.
2.4 Behavioral tests for vigilance and attention level
Each subject performed on a 10‐minute psychomotor vigilance task (PVT) [29] at the beginning and the end of the experimental procedure. The task required a speeded key response to the centrally presented red circle (1000 ms) following a fixation cross (500 ms) that appeared against a black computer screen background. Stimulus onset asynchrony (SOA) varied between 2 and 7 s. Numbers of lapses (response latencies exceeding 500 ms), anticipatory responses (faster than 150 ms), and averaged response latencies were calculated.
For attention level assessment, five Schulte tables [30] 5×5 with randomly distributed numbers were presented one by one to subjects. The task was to find and show the digits from 1 to 25 in ascending order as soon as possible. The tables were presented five times. The average time of reading, its standard deviation, maximum and minimum time were used to evaluate the attention level of participants.
All behavioral testing was administrated via the NBS Presentation software (Neurobehavioral Systems Inc., US).
2.5 EEG registration
Resting‐state EEG was acquired using a 19‐channel EEG amplifier Encephalan with the recording of polygraphic channels (Poly4, Medicom MTD, Taganrog, Russian Federation) for 10 min. The sampling rate was 250 Hz. The amplifier bandpass filter was nominally set to 0.05–70 Hz. AgCl electrodes (Fp1, Fp2, F7, F3, Fz, F4, F8, T3, C3, Cz, C4, T4, T5, P3, Pz, P4, T6, O1, and O2) were placed according to the International 10–20 system. The electrodes placed on the left and right mastoids served as joint references under unipolar montage. The vertical EOG was recorded with AgCl cup electrodes placed 1 cm above and below the left eye, and the horizontal electrooculogram (EOG) was acquired by electrodes placed 1 cm lateral from the outer canthi of both eyes. The electrode impedances were kept below 10 kΩ.
2.6 EEG preprocessing
The continuous resting‐state EEG of each subject was filtered with a bandpass filter of 0.5–30 Hz. The data were further corrected for eye, heart, channel, and EMG artifacts using Independent Component Analysis (ICA) in EEGLAB plugin for MatLab (Mathwork Inc.). The number of removed components was from 2 to 4, averaging around 3 for both groups. Additionally, muscle artifacts were cut out through manual data inspection. The removed intervals contaminated by muscle artifacts did not exceed 5 % of the total duration of EEG intervals. As EEG data were collected in the resting state with eyes closed in well‐responded participants, we had a relatively higher signal to noise ration and a few artifact‐contaminated epochs.
2.7 Data analysis
2.7.1 Power spectral density (PSD)
The continuous artifact‐free 300 ms–EEG epochs were submitted to a Fast Fourier transform, which was used to calculate PSD. The resulting spectral power (μV2) values were integrated over intervals of unit width in the range of interest for the following bands (2–3 Hz, 3–4 Hz, …, 19–20 Hz). Additionally the PSD data were united in broader frequency bands as following: slowwave (2–6 Hz), alpha 1 (8–10 Hz), alpha 2 (10– 12 Hz), beta (15–20 Hz). The logarithmic values of PSD of the bands were used for statistical analysis.
2.7.2 Peak alpha frequency (PAF)
Alpha peak frequency identification was conducted using a fast Fourier transform (FFT). PAF was identified as the center of gravity frequency within the 8–13 Hz band to exclude missing PAF that lies outside of the traditional fixed bandwidths after visual inspection of the highest local peak in the spectra in order to be sensitive to the entire shape of the alpha peak [31]. Furthermore, the gravity frequency approach has been suggested to provide a more accurate estimate of alpha frequency particularly in cases when multiple peaks are identifiable [32]. If no peak was present, it was not counted.
2.7.3 Higuchi fractal dimension (HFD)
HFD estimates the complexity of EEG signal obtaining the fractal dimension of time‐series signals. We evaluated HFD using the Higuchi algorithm [33]. The calculations of the examined signal bandpass‐filtered were conducted in the range of interest (2–20 Hz) with a Butterworth filter of order 12 with IIR filter (Matlab, MathWorks).
2.7.4 Envelope mean frequency (EMF)
To evaluate the (de‐)synchronization dynamics of the rhythms, we applied the following method. First, we calculated the envelope of the EEG signal for the whole frequency range (1.6–30 Hz) and the alpha rhythm (8–13 Hz) using the Hilbert transform [34]. Second, we assessed the (in‐)stability of the envelope’s amplitude by calculating its average frequency using FFT (wideband – EMF, alpha – EMFA) and the ratio of its standard deviation to its mean [wideband – ratio of amplitude transformation (RAT), alpha – ratio of amplitude transformation for alpha band (RATA)].
2.7.5 Hjorth parameters
Hjorth complexity (HC) represents the change in frequency and indicates how the shape of a signal is similar to a pure sine wave [30]. This parameter was calculated for wideband 1.6– 30 Hz filtered signal in the following way: complexity
2.8 Statistical analysis
We used the ANOVAs with the following post‐hoc comparison (Turkey, p < 0.05) to determine group effects on EEG metrics. To conduct statistics on the PSD, the repeated measures ANOVA for merged frequency PSD values, which confirmed a significant group effect for broader frequency bands, was applied. The post‐hoc comparisons were adjusted for multiple comparisons by Bonferroni correction: p‐value 0.05/4 where 4 represents four studied frequency bands–low frequencies (2–6 Hz), alpha 1 (8–10 Hz), alpha 2 (10–12 Hz), beta (15–20 Hz).
The Mann‐Whitney test was used to determine the of group differences in behavioral assessment results. Only significant (p < 0.05) correlations and differences were reported.
We analyzed a possible association of the EEG metrics with the ratings of neuropsychological and behavioral testing using Spearman correlation analysis corrected for multiple comparisons by cluster‐based permutation test [Matlab toolbox for brain–computer interface (BCI)] with 500 permutations at each node (the Bonferroni corrected p‐value of 0.05). All analytical steps were performed with scripts implemented in MATLAB R2018b (The MathWorks, Inc., USA).
3 Results
3.1 Self‐report rating and behavioral results
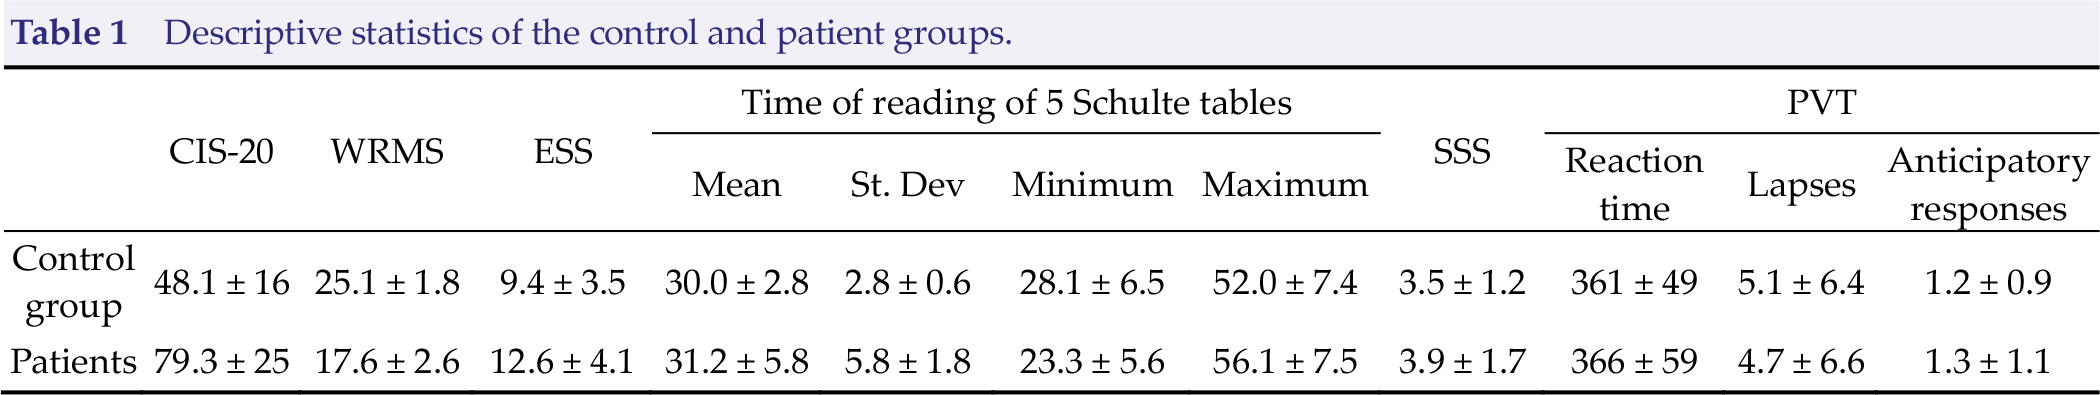
Table 1 represents the mean values and standard deviation of psychological and behavioral tests. The fatigue ratings of CIS‐20 were significantly higher in patients with TBI compared to the control group (z = 5.3, p = 0.00002). The ratings of the ESS were significantly higher in the group of patients (z = 4.6, p = 0.00016). The rating of WRMS was significantly lower in the group of patients (z = −4.1, p = 0.0009).
A comparison of the mean reaction time, lapses, and anticipatory responses of PVT, general performance, and scores of SSS did not show significant group differences. The mean and maximum time of Schulte’s tables reading did not differ between the groups. The standard deviation (z = −10.8, p < 0.00001) of Schulte’s tables reading was significantly higher in the group of patients. The minimum time of Schulte’s tables reading was significantly shorter in the group of patients (z = 4.8, p < 0.000001).
Descriptive statistics of the control and patient groups.
3.2 Differences in resting‐state EEG patterns between groups of TBI patients and healthy controls
Comparing to healthy controls, patients with moderate TBI had significantly higher slowwave (2–6 Hz) PSD in rsEEG predominantly in the frontal areas [F(1, 226) = 7.264, p = 0.00317], lower alpha‐rhythm (10–12 Hz) PSD [F(1, 226) = 13.658, p = 0.00028] in occipital area and higher beta‐rhythm PSD (15–20 Hz) in central areas [F(1, 226) = 11.225, p = 0.00198; Fig. 1].
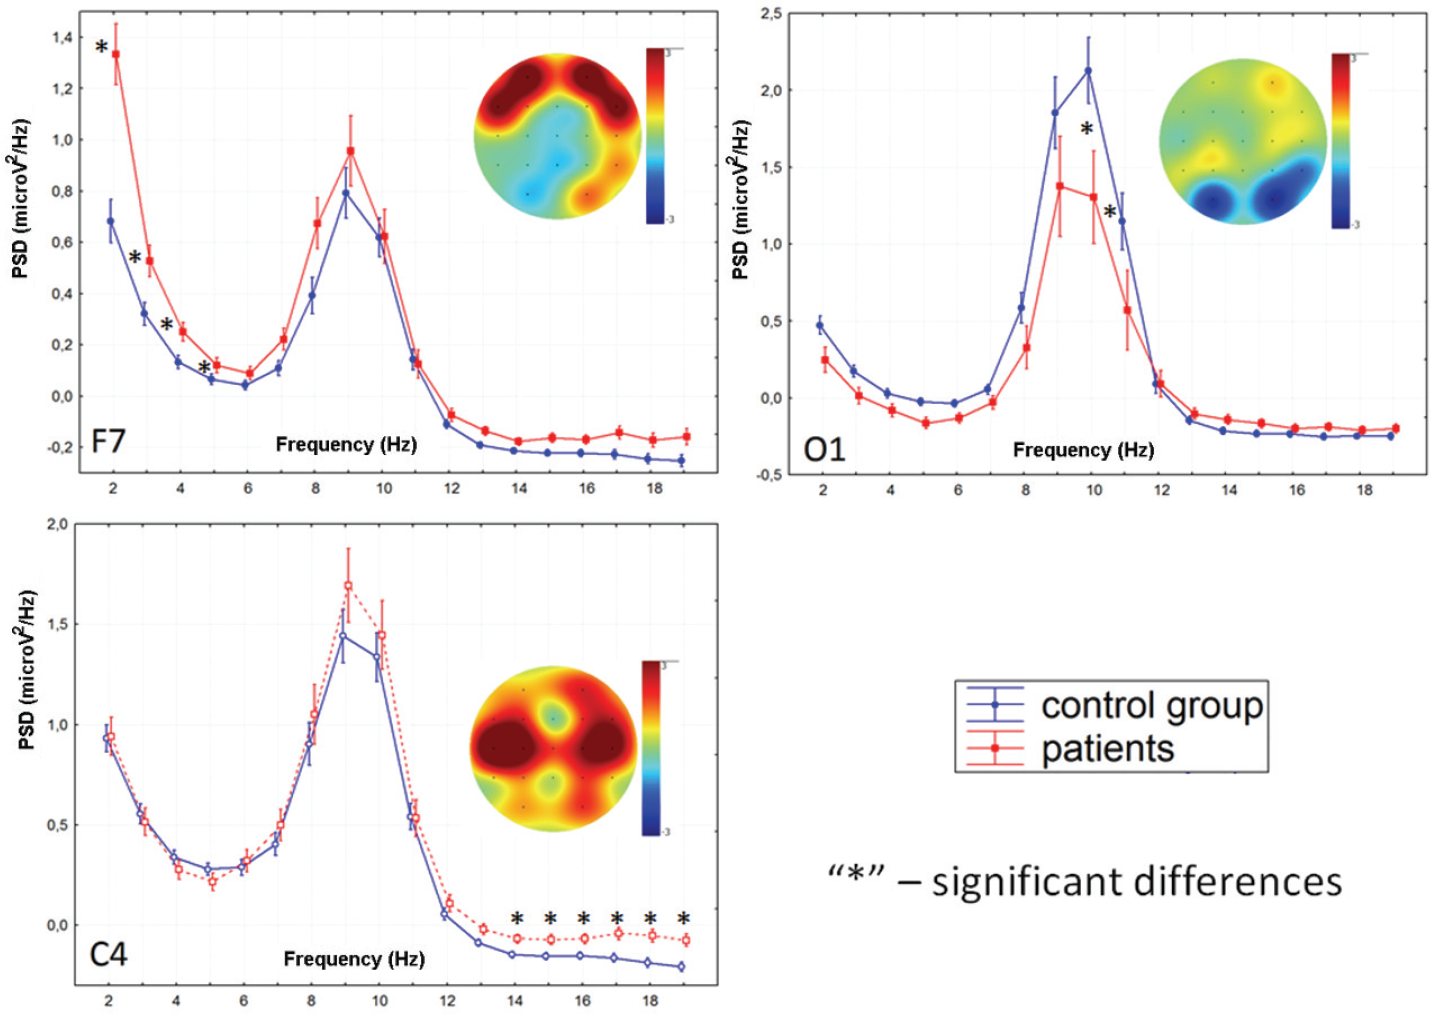
Localization of logarithmic PSD differences between groups of subjects (F7, 2–6 Hz; O1, 10–12 Hz; C3, 15–20 Hz).
PAF of rsEEG did not differ significantly between groups [Fig. 2(A)]. However, EMFA was significantly higher in the group of patients [F(1, 226) = 13.287, p = 0.00033] at all electrodes [Fig. 2(E)]. The RATA was significantly lower in the group of patients [F(1, 226) = 11.692, p = 0.00074] at all electrodes [Fig. 2(F)].
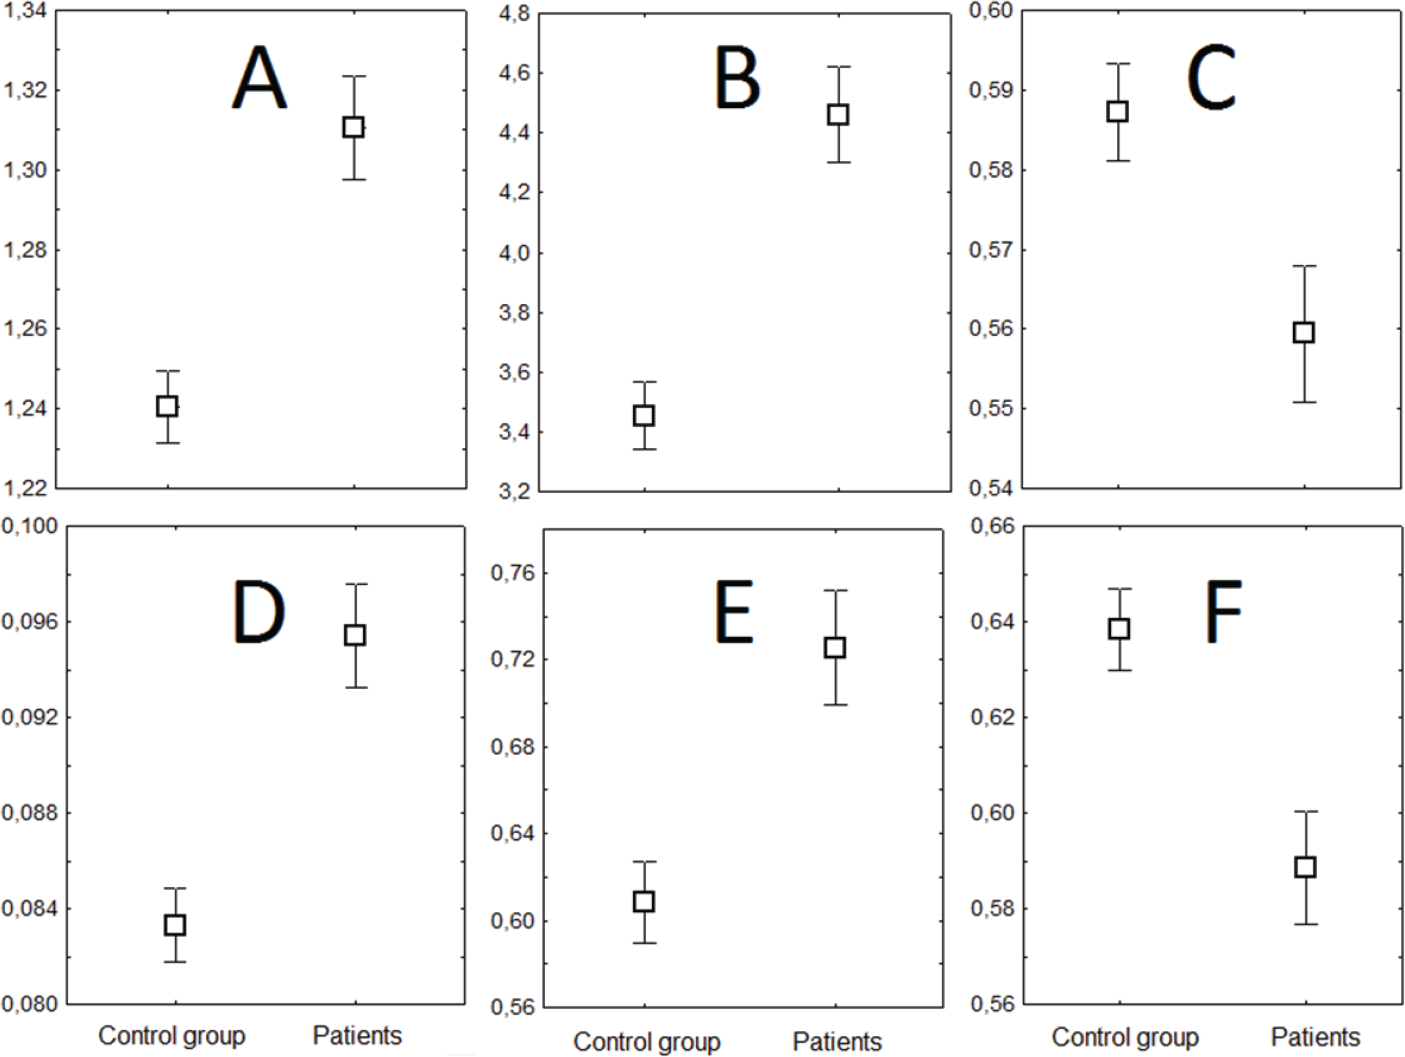
Plots of group differences in non‐linear dynamics of the EEG. (A) HFD (averaged by all electrodes). (B) EMF, 1.6–30 Hz. (C) RAT, 1.6–30 Hz. (D) HC. (E) EMFA, 8–13 Hz. (F) RATA, 8–13 Hz (averaged by T3, T5, O1 electrodes). Y (ordinate axis) represents EEG metrics according to order, X (abscissa axis) represents the category (the group of subjects).
Wideband EMF of rsEEG was significantly higher in the group of patients [F(1, 226) = 26.568,
p =0.00000] at all electrodes [Fig. 2(B)], while RAT lower in the group of patients in the left temporal areas T3, T5, and O1 [F(1, 226) = 6.9522, p = 0.00895; Fig. 2(C)].
HFD and HC of rsEEG were significantly higher in TBI patients at all electrodes: F(1, 226) = 19.545, p = 0.00002; F(1, 226) = 21.054, p = 0.00001, correspondingly [Fig. 2(D)].
3.3 Correlation of resting‐state EEG patterns and psychological rating
ESS (r = 0.69) and subjective fatigue scores (CIS‐20) positively correlated (r = 0.72) with 2–5 Hz PSD of rsEEG in the group of patients [Fig. 3(A)] and negatively correlated with HC in the frontal and central areas in both patients (r = −0.64, p = 0.0009) and controls [r = −0.52, p = 0.007; Fig. 3(B)]. Figure 4 demonstrated the similar correlations between ESS rates and HC values in different groups of subjects. Despite ESS rates and HC values were significantly higher in the group of patients, as was mentioned before, these parameters demonstrated inverse correlations in both groups.
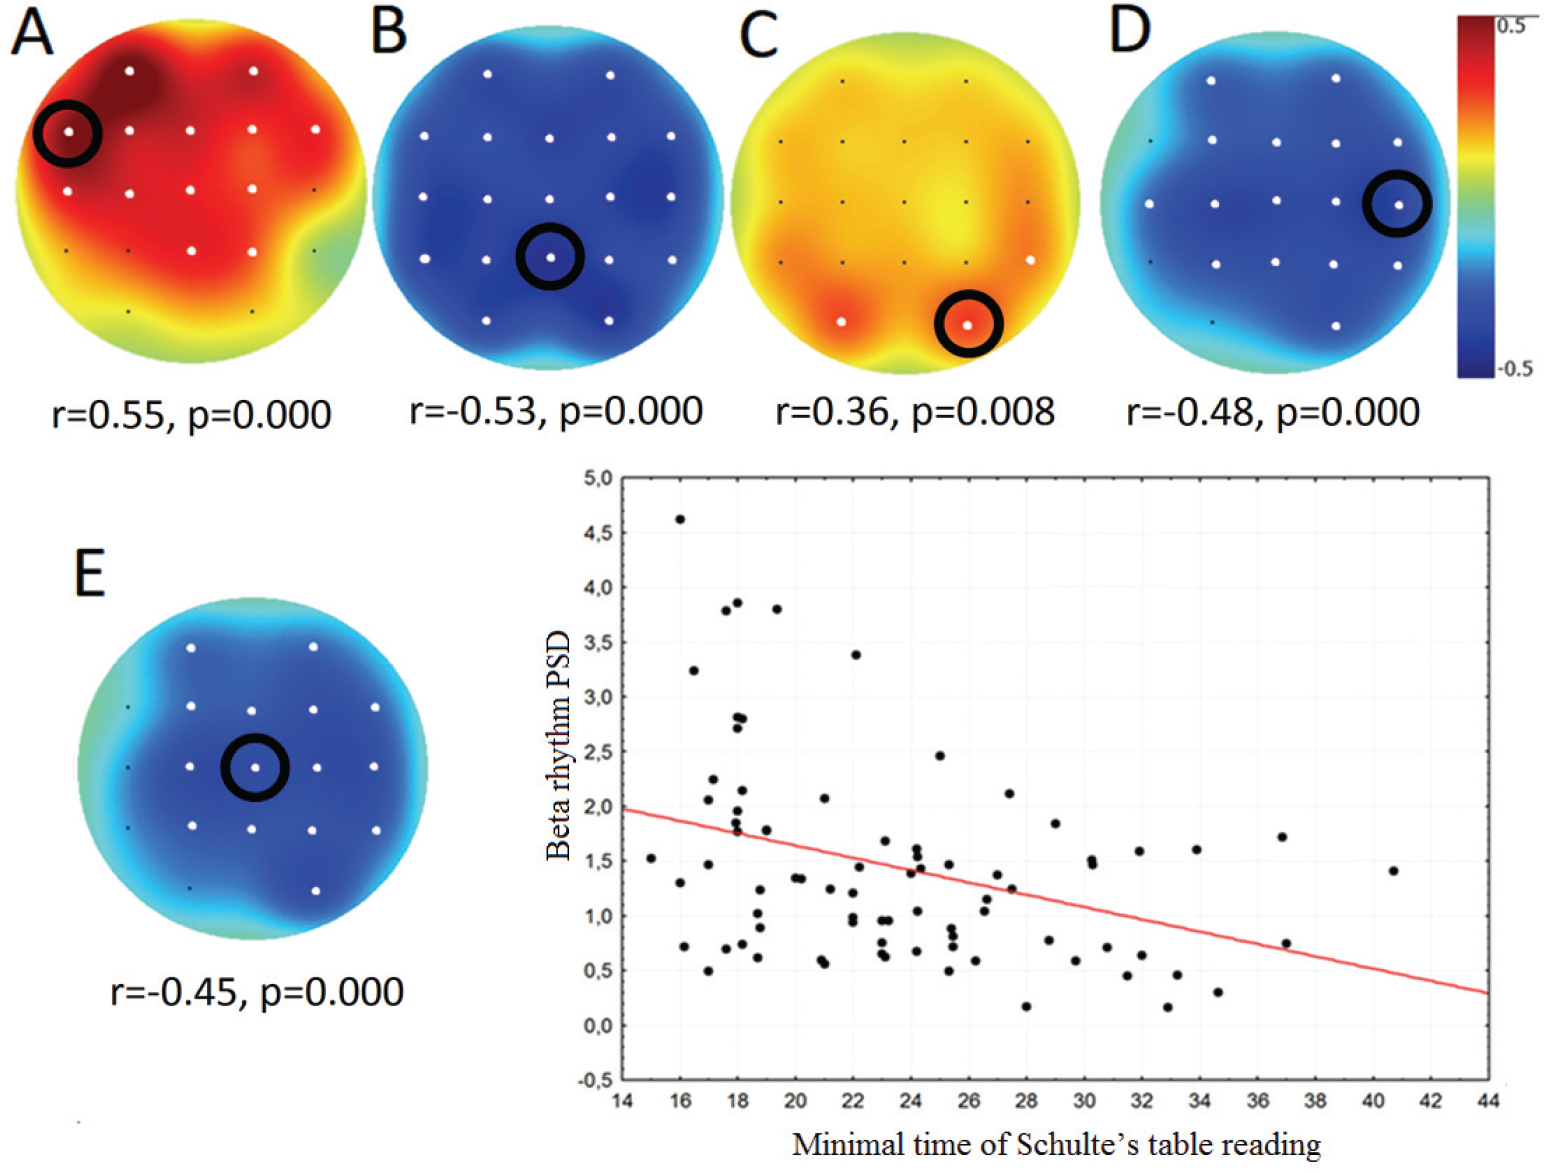
Topographical plots showing the strength of Spearman correlation for all channels in the group of patients: (A) between ESS and PSD of 2–5 Hz; (B) between ESS and HC; (C) between the minimum time of Schulte’s table reading and 10–11 Hz PSD; (D) between the mean time of Schulte’s table reading and 15–20 Hz PSD; (E) between the minimum time of Schulte’s table reading and 15–20 Hz PSD. White dots indicate channels with significant correlation (p < 0.05). Scatterplots of beta rhythm PSD (ordinate axis) and minimal time of Schulte’s table reading (abscissa axis) correspond to the Cz channel in the group of patients. Black dots in the Scatterplot represent individual values of participants (both patients after TBI and controls).
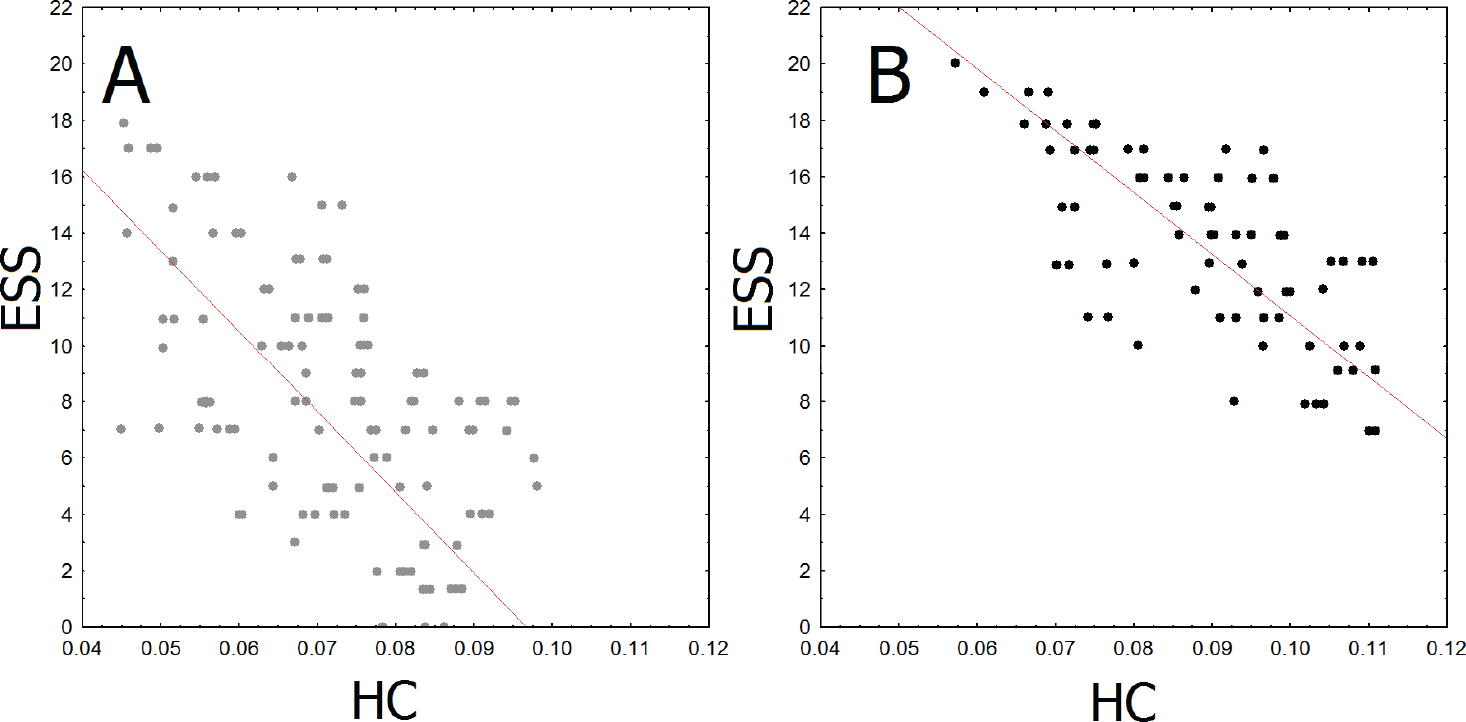
Scatterplots of correlations between ESS (ordinate axis) and HC in the frontal area (Fz) (abscissa axis) in control group (A) and patients (B). Dots (grey or black) represents individual values of participants: grey – controls, black – participants after TBI.
The minimum (r = −0.49, p = 0.006) and average time (r = −0.48, p = 0.007) of Schulte’s tables reading correlated negatively with betarhythm PSD (15–20 Hz) of rsEEG only in the group of patients. The minimum time also positively correlated with 10–12 Hz alpha rhythm PSD in occipital areas only in patients with moderate TBI [r = 0.49, p = 0.006; Fig. 3(A), (B)].
Thus, patients with moderate TBI demonstrated the association between low‐frequency PSD and symptoms of sleepiness and fatigue. At the same time, the association between cognitive abilities and EEG parameters was ambivalent: the better results during Schulte’s table reading were associated with higher alpha rhythm PSD and lower beta‐rhythm PSD in patients but not in the control group.
3.4 Correlation between cognitive and psychological ratings
The ratings of CIS‐20 positively correlated with ESS in the group of patients (r = 0.69, p = 0.000) and control group (r = 0.71, p = 0.000). The standard deviation of Schulte’s tables reading mentioned that higher variability in attentional performance positively correlated with CIS‐20 and ESS in the group of patients (r = 0.51, p = 0.001) and control group (r = 0.35, p = 0.02).
4 Discussion
Our study is the first to demonstrate significantly altered dynamic features of rsEEG in patients with moderate TBI even years after full recovery. We found that patients had significantly higher PSD of low‐frequency oscillations in the frontal areas, higher beta‐rhythm PSD in the central areas, and lower alpha‐rhythm PSD in the occipital areas compared to the control group. Moreover, daytime sleepiness and subjective fatigue scores correlated positively with 2–5 Hz PSD of rsEEG in the TBI patient group. The observed correlation of EEG patterns with behavioral testing supports our assumption about the presence of altered rsEEG activity in patients with moderate TBI. Mainly, the highest sleepiness and fatigue rates were revealed in patients with a higher PSD of low‐frequency activity [35]. Our findings were consistent with previous studies that reported an increase in delta and theta bands in subjects with high levels of fatigue and sleepiness [36] that could be one of the residual effects of brain injury.
The revealed increase of delta‐activity replicates previous studies describing the low‐frequency activity as a peculiarity of EEG‐profile of TBI as a sign of brain dysfunction induced by trauma [35]. The observed decrease of alphaand beta‐rhythm PSD in patients with moderate TBI is also repeating previous data of altered EEG in patients with minor head injuries [37]. The data on beta‐rhythm alterations are more contradictory as beta‐rhythm power could vary depending on experimental environments [38, 39], trauma severity, acuity of the disease, effectiveness of rehabilitation, and the existence of trauma‐related complications [40]. Nevertheless, the decrease of beta‐rhythm power was noted in patients with higher severity of TBI, especially at the acute stage, as well as in patients with considerable cognitive impairment [38]. In our study, the increased beta‐rhythm PSD could reflect compensatory neural activity in EEG. Previously, the arousal of the beta‐rhythm was associated with higher cognitive, emotional, and mental activity [41] and the solving of tasks, including sensory processing [42], self‐control, control of executive functions [43, 44], and planning [45]. In our study, the increase of betaand decrease of alpha‐band dynamics were associated with patients’ accelerated ability to solve attention tasks. Despite a lack of group differences between the average scores for the attention task, the patient group achieved the better results of five attempts, while the control group demonstrated the worse performance. The patients with the best results of Schulte’s tables reading (in one of the attempts) had lower alpha‐rhythm power in occipital areas, and higher beta‐rhythm power in central areas [Fig. 3(A), (B)]. According to previous findings, the decrease in alpha rhythm and the increase in beta rhythm have been associated with higher brain activity during the motor, cognitive, and emotional tasks [46, 47] and auto‐arousal cerebral compensatory effort [48, 49]. Moreover, the combination of beta‐increase and alphadecrease correlated with better reaction time in visual and attentional‐perceptual tasks in healthy subjects [50]. Summarizing the findings mentioned above and considering that the beta‐rhythm acceleration was also reported as a specific brain plasticity phenomenon in other studies [51, 52], we may assume a correlation between alpha- and beta‐rhythm dynamics behavioral performance in patients with moderate TBI reflects compensatory neural activity.
Apart from the linear indices such as PSD, we found that resting‐state EEG of patients with moderate TBI was characterized by higher variability, instability, complexity, and entropy measured by HFD, wideband envelope, alpha‐rhythm frequency, and HC. According to different studies, an increased HFD in the EEG was associated with arousal or higher emotional response [53, 54]. We have also reported an association between the HFD of EEG and the fMRI signal in the limbic system [9]. Therefore, the increased HFD may be a sign of background neural activity rather than a pathological marker. In support of this assumption, HFD changes, reported in previous studies, were rather controversial, especially in severe neurological diseases. For example, in patients in the acute phase of a stroke, the EEG’s entropy is usually decreased [55]. A similar trend was also observed for HC in our study. The EEG complexity depends on vigilance state, as previously suggested, based on that comatose patients had significantly lower EEG complexity than the control group [12]. The present results indicate a negative correlation of HC with self‐report sleepiness rating. We observed higher HC in both patients and controls with lower daytime sleepiness. Importantly, patients with moderate TBI estimated their daytime sleepiness significantly higher than healthy participants of our study. Accordingly, our findings imply that an increased HC and HFD could be associated with higher arousal, compensating both naturally caused sleepiness in healthy controls and the injury‐related chronic sleepiness.
Hilbert envelope parameters (EMF and RATA), which could be interpreted as measures of EEG amplitude instability [9] were significantly lower in the patient group. These parameters were poorly investigated previously; however, similar measures also revealed a significant decrease in the peak frequency’s entropy in moderate TBI patients [56]. Due to the limited data on these non‐linear parameters of EEG and the lack of correlations with psychological testing, it is difficult to conclude whether these differences are related to compensatory or pathological changes in brain activity.
A comparison of self‐report ratings also demonstrated that patients with moderate TBI experienced increased sleepiness and fatigue levels than the control group. Regarding the sleepiness, the group differences were absent for SSS rates but were significant for ESS, indicating chronic sleepiness in patients. ESS estimates average sleep propensity to measure the probability of falling asleep in a variety of situations [26]. Notably, ESS was found to associate with the degree of hypoxemia in patients with sleep disorders [57]. ESS was also better correlated with health, balance, satisfaction with life, depression, and fatigue than the total amount of sleep [58]. Simultaneously, the SSS was also associated with deficits in alertness following sleep deprivation, but it was not sensitive to sleepiness related to chronic sleep loss [59]. Thus, our findings are consistent with previous data supporting that increased level of sleepiness as a frequent symptom of TBI patients [60] presumably associated with chronic hypoxemia and resulted in low sleep quality, low life satisfaction, with feelings of tension, depression, and fatigue. In our study, moderate TBI patients also reported lower life satisfaction compared to the control group. This specificity of self‐reported well‐being in the group of patients was consistent with previous data showing variable mood disturbances, emotional lability, symptoms of hypomania, depression, and anxiety [61].
Remarkably, chronic sleepiness and fatigue parameters were associated with low‐frequency PSD and non‐linear Hjorth complexity parameters. In contrast, an increase in the power of delta and theta rhythms correlated with symptoms of sleepiness only in the group of patients and could be potentially a complication after TBI [62, 63], the correlation between Hjorth complexity and chronic sleepiness did not depend on a history of TBI and hardly could be associated with the consequences of TBI (Fig. 4). Despite HC values and ESS rates were significantly higher in participants with TBI, the inverse correlation between two parameters was detected in both groups. So, despite the predisposition of patients after TBI to chronic fatigue, the HC could be potentially assumed as a universal marker of chronic sleepiness and fatigue, especially in TBI cases.
We did not find a significant difference in the average scores for the attention task and reaction time between the patient and control groups. Meanwhile, patients with moderate TBI usually demonstrate symptoms of cognitive deficit associated with impairment in executive functions, attention, and working memory that could be detected even in the latter stages of rehabilitation [15, 64]. Our results showed that at least the ability to retain a level of voluntary attention was fully compensated in patients with moderate TBI a year after physiological recovery. Remarkably, the patients had a shorter minimum reading time than healthy controls. However, our findings suggest that patients could have a mild cognitive impairment reflected in significantly higher standard deviation in the reading time of Schulte’s tables despite the rehabilitation of primary cognitive functions. The higher standard deviation implies that moderate TBI patients demonstrated a higher variability of attention level during five attempts at Schulte’s time reading, previously reported as attentional impairment [65]. Thus, we may only hypothesize that shorter minimum reading time accompanied by higher variability of the mean reading time reflects compensatory process rather than a complete recovery of the cognitive impairment after moderate TBI. In support of this assumption, we found that the patients with TBI had higher variability in attentional performance correlating with their fatigue level.
Limitations
The results of this study should be considered in light of several limitations. Mainly, our hypothesis about compensatory changes should be confirmed in a longitudinal study from the acute stage of moderate TBI to full recovery and return to premorbid life activities. We do not have data on patients’ initial cognitive abilities before the injury to assess the severity of cognitive deficit. Further research is also crucial to control the homogeneity of the patient and control groups by social status, level of education, and occupation that may reflect the level of cognitive abilities and compensatory potential.
5 Conclusions
Complaints to cognitive deficits often persist in patients after moderate TBI, even in full physiological recovery and return to premorbid life activities. Here we have shown that specific EEG patterns significantly alter in the brain resting‐state EEG of patients with moderate TBI reflecting both direct impacts of injury and compensatory neuroplastic changes. The mentioned injury‐dependent changes in EEG included increased low‐frequency EEG activity during resting state in patients with moderate TBI accompanied by feelings of fatigue, sleepiness, and mood disturbances. Summing up our findings and previous data, we suggest compensatory changes in the EEG were reflected in a decrease of alpha‐band power, an increase of beta‐rhythm power, and increasing entropy and complexity of the EEG signal. The increase of non‐linear EEG patterns was associated with better results in attention tasks.
Footnotes
Conflict of interests
All contributing authors have no conflict of interests.
Financial support
The reported study was funded by RFBR according to the research project No. 18‐00‐01670 (18‐00‐01511) and the state assignment of Ministry of Education and Science of the Russian Federation for 2019‐2021 (No. АААА‐ А17‐117092040004‐0).