
Abstract
Background
There is preliminary evidence that patients with chronic rhinosinusitis (CRS) and comorbid obstructive sleep apnea (OSA) have reduced quality-of-life (QOL) improvements after functional endoscopic sinus surgery (FESS) compared with patients without OSA. The effect of OSA severity on QOL improvement after FESS is unknown.
Objectives
To better characterize the QOL improvement after FESS for patients with comorbid OSA and to assess whether QOL improvement is dependent on OSA severity.
Methods
This multi-institution, retrospective cohort study evaluated adult patients with CRS who underwent FESS between 2007 and 2015. Preoperative, 1-month, 3-month, 6-month, and 1-year postoperative 22-Item Sino-Nasal Outcome Test scores were used to evaluate QOL. We compared patients without OSA with patients with stratified OSA based on the preoperative apnea-hypopnea index. A multilevel, mixed-effects linear regression model was used for the analysis.
Results
Of 480 participants, 83 (17%) had OSA, and 47 of these patients had polysomnography results available for review. Both patients with OSA and patients without OSA reported significant QOL improvement after surgery (p < 0.0001) relative to baseline. In the unadjusted model, the subjects with OSA demonstrated a statistically worse outcome in 22-Item Sino-Nasal Outcome Test scores at each time point (2.4 points higher per time point, p = 0.006). When controlling for covariates, the adjusted model showed no difference in QOL outcome based on OSA status (p = 0.114). When stratified by OSA disease severity, the adjusted model showed no difference in the QOL outcome.
Conclusions
Patients with CRS and comorbid OSA had worse QOL outcomes after FESS; however, when controlling for patient factors, there was no difference in QOL outcome. OSA disease severity did not seem to predict QOL improvement after FESS.
Functional endoscopic sinus surgery (FESS) is an accepted treatment for medically recalcitrant CRS with documented QOL improvement after surgery.7,8 A recent study showed that, in patients with CRS and comorbid OSA, QOL improvement can be achieved with FESS, albeit to a lesser extent than in patients with CRS alone. 1 Although improvement has been shown, an analysis of QOL trajectories has not been described. In addition, the effect of OSA disease severity has not been investigated. Herein we aimed to perform the largest analysis of QOL outcome in patients with comorbid OSA who were undergoing FESS. Longitudinal linear mixed-effects modeling was used to capture all the data and provide a comprehensive analysis of QOL outcomes among patients with CRS and with and without OSA. In addition, we aimed to examine the impact of OSA disease severity on QOL after FESS based on the apnea-hypopnea index (AHI).
Methods
A retrospective cohort study was performed on 515 patients who underwent FESS between April 19, 2007, and October 12, 2015, at the involved tertiary care academic medical centers. Eligibility included age >18 years and patients undergoing FESS for medically recalcitrant CRS. Exclusion criteria included having a known autoimmune disorder or immunodeficiency, primary ciliary dyskinesia, cystic fibrosis, history of therapeutic radiation exposure to the paranasal sinuses, sinonasal tumor or malignancy, skull base encephalocele or cerebrospinal fluid leak, or a history of sinonasal trauma. Thirty-five patients were excluded due to these criteria. In total, 480 patients were eligible for analysis. All study protocols and informed consents were collected and approved by the institutional review board at both tertiary care centers.
The 22-Item Sinonasal Outcome Test (SNOT-22) was given to every patient in the study at each visit. Completed questionnaires before surgery and then at ~1-, 3-, 6-, and 12-month intervals were used for statistical analysis. Of the 480 patients, there were a total of 1523 completed SNOT-22 forms over the five time points. The SNOT-22 is a well-validated disease-specific QOL questionnaire, with a high Cronbach alpha (α = 0.91) and has a test-retest reliability of 0.93. 9 Psychometric validity research by Hopkins et al. 9 found the minimally clinically important difference that is the smallest change in SNOT-22 score that can be detected by a patient to be 8.9 points. Baseline characteristics included sociodemographic information, comorbidities, and Lund-MacKay computed tomography (CT) scores. Sociodemographic data were collected by a combination of chart review and patient self-report. Comorbidities were assessed by chart review of the preoperative reports at the time of surgery. All the chart reviews were independently entered into a data base by two independent research personnel and then checked for agreement (S.G.B, C.H.Y.). Lund-MacKay computed tomography scores were scored from 0 to 2 for six bilateral areas of sinus opacification for a possible score of between 0 and 24. A higher Lund-MacKay computed tomography score indicates greater severity of CRS.
Statistical Analysis
Distributions for demographic and clinical variables, including comorbidities, surgery history, and preoperative scores, were compared by OSA group by using Fisher exact tests for categorical variables and general linear models for continuous variables. Longitudinal linear mixed-effects modeling was used to examine the relationship between SNOT-22 and OSA status. The distribution of the SNOT-22 measure follows a unimodal symmetric distribution and satisfies the assumptions for mixed-effects modeling. Mixed-effects modeling takes advantage of all available data (up to the point of loss to follow-up or withdrawal) and also can address missing data. Because the level of missingness was not excessive and patterns of missingness were not detected, the mixed-effects modeling relied on all available data.10–13 Both random slopes and intercepts were modeled to represent the subject-level deviation from the average slope over time and intercept.
Restricted maximum likelihood estimation was used, along with an unstructured covariance structure. The outcome was analyzed as repeated observations (five assessments over 1 year at before surgery and ~1, 3, 6 and 12 months after surgery). Time was measured as a continuous variable. An unadjusted mixed-effects model was estimated by regressing longitudinal outcome on time, OSA status, and the OSA time interaction. Then an adjusted model was built by considering potential fixed effects (e.g., age, sex) identified by using simple main effects and two-way interaction-with-time models based on an inclusion criterion, p ≤ 0.20.12,14 An initial multivariable mixed-effects model was constructed by using all of the aforementioned significant two-way interaction-with-time covariates, along with the corresponding main effects.
By using this full model, interactions were sequentially eliminated based on least significance until only interaction effects that demonstrated p ≤ 0.20 remained.12,14 Covariates that were not included in the aforementioned final interaction model but demonstrated p ≤ 0.20 in simple main-effects models were then added to the final multivariable interaction model and assessed sequentially as described earlier. With the exception of the OSA group, time, and the two-way interaction between OSA group and time (which were forced into the model), the final multivariable model only included covariates and interaction terms that demonstrated significance at the p ≤ 0.20 level. Patients with OSA were then broken into groups of normal, mild, moderate, and severe based on AHI score by using all available sleep study data to investigate possible differences in postoperative outcomes between AHI stratum. Forty-nine of the 83 patients with OSA had sleep study data (Table 1). Unadjusted and adjusted longitudinal linear mixed-effects models were also fitted for this categorical predictor by using the same model-building method. All statistical analyses were carried out by using Stata 13.1/IC (StataCorp, LP, College Station, TX). Alpha was set at 0.05 (two-tailed).
AHI by category

AHI = Apnea-hyponea index; OSA = obstructive sleep apnea.
Results
Baseline Characteristics
Patients with OSA versus their non-OSA counterparts were found to be more commonly male patients (45 versus 29%), diabetic (22 versus 6%), older age (55 versus 49 years), and higher body mass index (32 versus 27 kg/m2) (Table 2). The overall cohort was 88% white, 9% African American, and 3% other. Patients with OSA did not differ significantly from patients without OSA in preoperative sinus disease severity or in disease-specific QOL. There also were no observed differences in primary versus revision surgery status between the groups (Table 3).
Demographic and clinical covariates

OSA = Obstructive sleep apnea; GERD = gastroesophageal reflux disease; AERD = aspirin-exacerbated respiratory disease; SD = standard deviation; BMI = body mass index; SNOT-22 = 22-Item Sino-Nasal Outcome Test; CT = computed tomography.
The number of previous surgeries
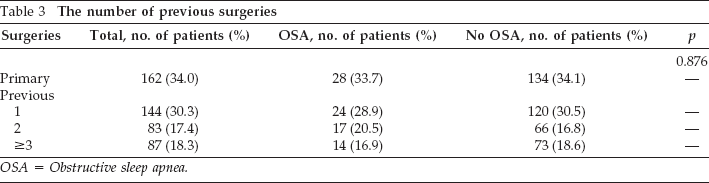
OSA = Obstructive sleep apnea.
Longitudinal Outcomes
There were no significant differences between the groups in terms of completed SNOT-22 forms at any of the five time points. Results from the unadjusted and adjusted longitudinal linear mixed-effects model by using the dichotomous OSA variable (OSA versus non OSA) as the predictor of interest are provided in Table 4. SNOT-22 scores were significantly lower than the baseline score for all the patients (a 6.00-point decrease per time point, p < 0.001). In the unadjusted model, the subjects with OSA demonstrated a statistically worse predicted outcome in SNOT-22 scores over the 12-month follow-up period relative to patients without OSA (2.4 points higher per time point, p = 0.006). This trend was seen in every subscale of the SNOT-22 in the unadjusted model as well (Table 4). In the adjusted model, no differences were seen between the groups. The adjusted model for the “extra-nasal” subscale demonstrated differences between patients with OSA and patients without OSA of approximately half a point for each follow-up time point (p = 0.002). Longitudinal linear mixed-effects models were also fit for the categorical predictor of AHI category (Table 5). A similar trend was seen in these models as well, in which the unadjusted model showed significant differences between normal (AHI score of <5) and all other groups (p = 0.002), and, in the adjusted model, no significant differences were seen.
Unadj. and adj. mixed model: OSA status—SNOT-22 total scores

Unadj. = Unadjusted; adj. = adjusted; OSA = obstructive sleep apnea; SNOT-22 = 22-Item Sino-Nasal Outcome Test; SE = standard error; CI = confidence interval.
Discussion
OSA is a potentially debilitating chronic medical condition that has increased in prevalence over time. The prevalence of OSA in our study cohort was found to be 17%, which was similar to the reported prevalence of OSA in the general U.S. population. 15 In addition, more patients with OSA were male patients, (p = 0.007), consistent with published estimates. 16 Baseline data also revealed that patients with OSA were older (p < 0.001), had a higher body mass index (p < 0.001), and more commonly had diabetes (p < 0.001). Baseline SNOT-22 scores were no different between the patients with CRS and those with comorbid OSA (p = 0.791). This held true across the five subdomains of the SNOT-22 (Table 2). Intriguingly, the patients with CRS and without OSA experienced similar sleep disturbance when compared with the patients with comorbid OSA as measured by the sleep disturbance subdomain (p = 0.184), which was in agreement with literature that supports abnormal sleep quality in patients with CRS. 6
All the patients showed significant improvement after FESS (p < 0.001). The QOL trajectories of the study groups with inclusion of the adjusted model are demonstrated in Fig. 1. As shown, there was significant improvement in the total SNOT-22 score at each test interval among all the groups; however, the patients with OSA showed less improvement than patients without comorbid OSA (p = 0.006). By using the linear regression model, patients with OSA would be expected to have a clinically significant higher SNOT-22 score at 12 months (—9.6 points) when compared with patients without OSA. 9 When controlling for covariates, the adjusted model revealed no difference in QOL outcome between the patients with OSA and the patients without OSA (p = 0.114). This is depicted in Fig. 1, in which the QOL trajectory of the patients with OSA in the adjusted model nearly overlapped with the trajectory for the patients without OSA. In addition, this finding held true for all subdomains, except the extra-nasal subdomain (p = 0.002); however, this effect was small and represented only a half-point difference for each follow-up time point.
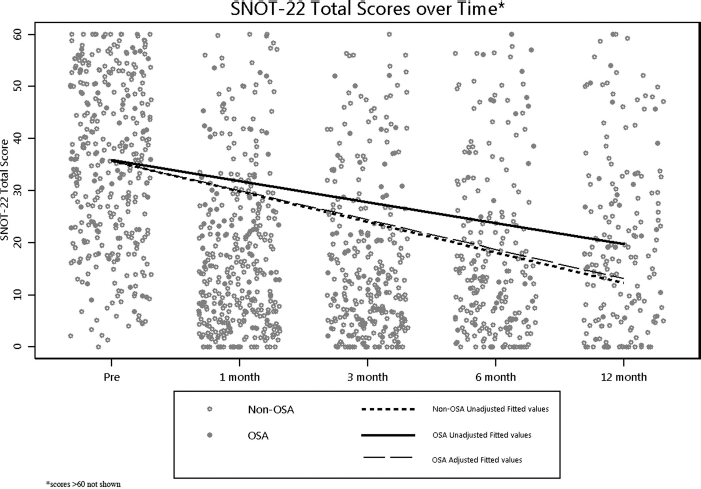
Quality-of-life trajectories among the study groups, with inclusion of the adjusted model.
Alt et al. 1 performed the only other study to assess QOL outcomes after FESS for patients with comorbid OSA. They found that patients with comorbid OSA demonstrated less improvement in SNOT-22 rhinologic symptom domain scores, which we did not demonstrate in the current study. 1 The disparity likely lies in differences in methodology. In their study, improvement was assessed by subtracting the preoperative SNOT-22 score from the last available follow-up score (with at least a 6-month follow-up evaluation). 1 This method does not allow for missing data and, therefore, excluded patients who might have missed a response but nonetheless completed baseline, 1-month, and 3-month questionnaires. To circumvent this, we elected to use a mixed-effects model in our analysis to allow inclusion of all data. In addition, the use of a mixed-effects model takes into account within-subject variance. For example, if a patient had a preoperative SNOT-22 score of 15 and a 6-month score of 0, then a calculated difference of 15 was scored. This was a considerably different outcome compared with a patient with a preoperative score of 100 and a 6-month score of 85. As such, linear mixed-effects regression modeling, as chosen for the current study, was more appropriate for repeated-measures outcomes data because it further incorporates a random-effects term to account for individual differences in the QOL trajectory.
Analysis of the data reported in this work indicated that, although patients with comorbid OSA had a reduced QOL outcome after FESS, this was the result of comorbidities associated with OSA and not the effect of OSA itself. OSA is a chronic condition characterized by recurrent episodes of apnea or hypopnea that cause intermittent hypoxemia and hypercapnia, oxidative stress, and sleep fragmentation. OSA has been independently associated with diabetes, hypertension, coronary artery disease, stroke, depression, gastroesophageal reflux disease, and cardiovascular mortality. 16 These associated comorbidities are likely the cause of reduced QOL after FESS. Only a few studies delineated how specific comorbidities affects QOL outcomes after FESS. Zhang et al. 17 showed that patients with diabetes and comorbid CRS had worse QOL outcomes and were more likely to have Pseudomonas aeruginosa infection and nasal polyps. Steele et al., 18 in their multi-institutional treatment outcomes investigation, showed that patients with comorbid obesity report reduced QOL gains after FESS. Otherwise, the effect of premor-bid cardiovascular disease on QOL outcomes after FESS has yet to be clearly delineated.
Few reports exist regarding QOL outcomes based on OSA severity. Dutt et al., 19 in their prospective study of QOL outcomes in patients with OSA, showed no correlation between QOL impairment and the severity of OSA. This finding was also supported in three additional reports that used different measures of QOL.20–22 Specific to sinonasal concerns, Kuan et al. 23 found no correlation between AHI and SNOT-22 scores in patients with OSA and without CRS. To date, no investigation has evaluated sleep apnea severity as it relates to QOL outcomes after FESS. Our results indicated no difference in QOL outcome after FESS based on AHI grouping in the adjusted model (Table 5), which was consistent with the previous stated literature that indicated that the severity of QOL impairment was independent of OSA severity. A larger sample size will be necessary to establish more definitive relationships because only 47 patients with OSA had complete polysomnography data for review.
Unadj. and adj. mixed model: OSA by AHI category—SNOT-22 total scores

Unadj. = Unadjusted; adj. = adjusted; OSA = obstructive sleep apnea; AHI = apnea-hypopnea index; SNOT-22 = 22-Item Sino-Nasal Outcome Test; SE = standard error; CI = confidence interval.
Conclusion
Here we performed the largest study, to our knowledge, that evaluated QOL outcomes after FESS in patients with CRS and sleep apnea. Patients with comorbid sleep apnea had worse QOL outcomes when compared with patients without OSA; however, this finding was not true when controlling for potential confounding variables. In addition, there was no difference in QOL outcome when evaluating patients based on OSA severity. The results in this study have important clinical implications for physicians when counseling patients with comorbid OSA regarding expected outcomes after FESS.