
Abstract
Reporter gene–based labeling of cells with iron is an emerging method of providing magnetic resonance imaging contrast for long-term cell tracking and monitoring cellular activities. This report investigates 9.4 T nuclear magnetic resonance properties of mammalian cells overexpressing MagA, a putative iron transport protein from magnetotactic bacteria. MagA-expressing MDA-MB-435 cells were cultured in the presence and absence of iron supplementation and compared to the untransfected control. The relationship between the transverse relaxation rate (R2) and interecho time was investigated using the Carr-Purcell-Meiboom-Gill sequence. This relationship was analyzed using a model based on water diffusion in weak magnetic field inhomogeneities (Jensen-Chandra model) as well as a fast-exchange model (Luz-Meiboom model). Increases in R2 with increasing interecho time were larger in the iron-supplemented, MagA-expressing cells compared to other cells. The dependence of R2 on interecho time in these iron-supplemented, MagA-expressing cells was better represented by the Jensen-Chandra model compared to the Luz-Meiboom model, whereas the Luz-Meiboom model performed better for the remaining cell types. Our findings provide an estimate of the distance scale of microscopic magnetic field variations in MagA-expressing cells, which is thought to be related to the size of iron-containing vesicles.
GENE-BASED IRON LABELING is an emerging method of providing magnetic resonance imaging (MRI) contrast for long-term cell tracking and monitoring of cellular activities.1–3 Development of this tool could ultimately lead to effective MRI reporter gene expression that enables the noninvasive, in vivo tracking of transcription factor activity. Hence, this technique may provide a valuable tool for studying the underlying mechanisms of tumor growth and metastasis,2,4 as well as for following stem cell migration and differentiation to optimize regenerative stem cell therapy. 5 To achieve gene-based iron labeling, which in turn leads to increased intracellular levels of iron nanoparticles, several types of iron-handling proteins have been examined.6,7 Of these, MagA, a putative iron transport protein found in magnetotactic bacteria, has been explored in the context of mammalian cell tracking with MRI.1–3,8 Although the expression of MagA in nonmagnetic bacteria such as Escherichia coli is implicated in iron transport, 9 the exact mechanism of enhanced iron accumulation in mammalian cells has yet to be described. 1 However, this enhanced iron accumulation in mammalian cells due to MagA expression and iron supplementation has been demonstrated in the past.3,8,10 In these studies, increased cellular iron influenced the magnetic resonance (MR) signal as quantified by measurements of transverse relaxation rates, including R28,10 as well as R2* and R2′ (R2′ = R2* — R2). 10 This effect has allowed longitudinal MRI tracking of mouse tumor xenografts from transplanted MagA-expressing cells.2,3
Further characterization of the nuclear magnetic resonance (NMR) properties of MagA-expressing cells could provide information on the microscopic distribution of iron within cells as well as information to aid the optimization of MRI acquisitions for detection of these cells. In addition, this characterization may provide insight for developing strategies to differentiate signal change associated with iron–containing, MagA-expressing cells from other sources of MR signal change, as well as possibly from endogenous iron. In the future, NMR analysis could be applied to compare different gene-based, iron-labeled systems and may help guide their further development for reporter gene expression using MRI.
Among various MRI parameters, those that are more specifically influenced by microscopic magnetic field inhomogeneities, such as those created by iron particles compared to other tissue characteristics, are of particular interest. In a previous work, the transverse relaxation rate known as R2′, which is thought to be more strongly influenced by iron than by other tissue properties, was explored. 10 In the present article, we consider a different NMR characteristic of iron-containing systems, namely, the change in transverse relaxation rate (R2) with interecho time (2τ) using the Carr-Purcell-Meiboom-Gill (CPMG) sequence. 11 Several studies have shown that R2 increases with increasing interecho time in iron-containing tissues.11–15 That is, the decay becomes more irreversible as the refocusing (RF) pulses are moved further apart, providing more time during each RF interval for changes in the local magnetic field experienced by protons. Previously, theoretical models have been developed and applied in an attempt to understand the factors that influence these NMR signal changes in biological samples.
An early mathematical model (the Luz-Meiboom model 16 ), developed to describe changes in R2 with interecho time, was based on fast exchange between protons in different discrete chemical environments. Although initially derived in the context of a system with multiple chemical environments, the model could apply to multiple physical environments (e.g., compartments with different local magnetic fields). The application to multiple compartments assumes a common lifetime for all compartments/environments. (Refer to the appendix in Luz and Meiboom. 16 ) In the context of tissues, this model has been applied to describe the experimental dependence of R2 on interecho time in various settings, including deoxygenated blood17–23 and brain tissue.17,24
More recently, Jensen and Chandra developed a mathematical model describing the R2 dependence on interecho time based on water diffusion through a microscopic magnetic field spatial distribution. 14 This model relies on an assumed spatial correlation function (equation 26 of Jensen and Chandra 14 ) that corresponds to treating the microscopic magnetic field as a random variable of position. Compared to the Luz-Meiboom model, the Jensen-Chandra model 14 provided a better fit to experimental data from iron-containing tissues and deoxygenated red blood cell suspensions and in more recent studies showed a slightly better fit for human blood samples.19,20 Despite these findings, it is not clear which model would be superior in other systems, such as gene-based, iron-labeled cells, in which iron could be distributed differently (i.e., magnetosome, which is a membrane-enclosed compartment of magnetite (Fe3O4) 1 ) from those previously studied.
In the present study, the relationship between R2 and interecho time was studied, using a 9.4 T NMR system, in MagA-expressing cells and their untransfected parental control, cultured in the presence and absence of iron-supplemented medium. To our knowledge, this is the first report describing this relationship in cultured cells using gene-based iron labeling. Analyses of the relationship between R2 and interecho time in each cell group using both the Luz-Meiboom 16 and the Jensen-Chandra 14 models are presented. Performance of these models is compared for all cell groups. Values of model parameters are compared to those previously obtained for various tissues. In particular, the values of the spatial correlation length from the Jensen-Chandra model provide insight regarding the distance scale of the microscopic magnetic field variations from iron, which is thought to be related to the size of iron-containing vesicles.
Methods
Cell Preparation
The human tumor cell line MDA-MB-435 was stably transfected with magA as previously described. 25 A clonal line of MagA-expressing cells (MagA) and the untransfected parental cell line (P) were cultured in low-glucose Dulbecco's Modified Eagle's Medium (DMEM) with up to 1% penicillin/streptomycin and 10% fetal bovine serum. All cell culture reagents were purchased from Invitrogen (Carlsbad, CA) unless otherwise noted. MagA expression was maintained with 800 μg/mL Zeocin. Cultures with and without iron supplementation (± Fe) were prepared, providing four experimental cell groups (MagA+Fe, MagA—Fe, P+Fe, and P—Fe). Iron-supplemented cells were incubated in medium containing 250 μM ferric nitrate for a minimum of 5 days. Since we expect the MagA+Fe cells to have the greatest iron uptake, we refer to the remaining groups (MagA—Fe, P+Fe, and P—Fe) as the “control cells.”
At harvest, cells were washed with phosphate-buffered saline (PBS) pH 7.4 and counted using a hemacytometer, as previously described. 10 Five million cells were placed in a custom-made NMR-compatible vial with a 2.2 mm inner diameter and centrifuged for 5 minutes at 400g and 15° C to form a compact pellet. Excess PBS was removed from the vial by inserting a custom-made plunger to the PBS-pellet boundary. Unused cells were lysed in 850 μL radioimmunoprecipitation assay (RIPA) (10 mM Tris-HCl pH 7.5/140 mM NaCl/1% NP-40/1% sodium deoxycholate/0.1% sodium dodecyl sulfate)/150 μL Complete Mini Protease Inhibitor Cocktail (Roche Diagnostic Systems, Laval, QC) such that approximately 10 million cells were solubilized per milliliter lysis buffer and stored at −20° C for iron analysis.
Iron Analysis
Trace element analysis of iron was performed by the Analytical Services Laboratory of Western University (London, ON) using inductively coupled plasma mass spectrometry (ICP-MS). Protein levels were determined using the bicinchoninic acid assay 26 and were used to normalize iron contents.
NMR Measurement
R2 measurements, as a function of 2τ, were performed on cell pellets: MagA+Fe (n = 5), MagA–Fe (n = 3), P+Fe (n = 3), and P—Fe (n = 3). To ensure that any observed changes in R2 were not due to artifacts from imperfect RF pulses, R2 was also measured as a function of 2τ in 100 μM MnCl2(aq) (n = 3). All R2 measurements were completed within 7 hours of the initial cell harvest.
R2 was measured on a 9.4 T NMR spectrometer (Varian Inova 400 equipped with an autoswitchable double resonance coil [Agilent Technologies, Santa Clara, CA]) using the CPMG sequence provided by the vendor. For this implementation of the CPMG sequence, only a single echo signal was acquired following each train of 180° pulses, with signal acquisition starting at the echo RF time. Each echo contributed to a single point on the associated R2 decay curve. Multiple echo points (8–15 points) on this curve, each at a different signal echo time (TE), were obtained by varying the number of RF pulses in the train while the interecho time was fixed. Here TE refers to the time between initial excitation and data acquisition. An even number of RF pulses was applied in all acquisitions to minimize errors arising from imperfect RF pulses. The procedure was repeated with interecho times (2τ) ranging between 0.2 and 16 ms (TE = 2τ X (number of pulses in the train)). The decay of echo signals were all acquired for 1 second with a spectral width of 49,751 Hz (dwell time ~ 10 ms) and averaged over an eight-signal phase cycling scheme. 27 On average, the RF pulse duration was 27.2 ± 0.85 μs. All measurements were acquired on resonance at 25° C.
R2 Analysis
A linear fit was applied to the time interval between 100 and 1,000 μs of each echo signal to determine the signal value for that TE and 2τ. The signal values as a function of TE (8 to 15 echo values for each 2τ) were fitted to a monoexponential decay function to determine the value of R2. Individual R2 values were corrected based on the assumption that signal decay rate has a twofold reduction during the time period in which each RF pulse was applied. 28 (The RF pulse occupied approximately 12% of the shortest interecho time interval [0.2 ms].) All signal analysis was done using Matlab R2013a (MathWorks, Natick, MA).
Theoretical Models
Two previously developed mathematical models were applied to the experimentally determined R2 values at various 2τ using the Levenberg-Marquardt algorithm. The Jensen-Chandra model 14 describes the dependence of R2 on interecho time (2τ) as
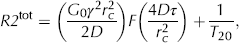
where G0 is the variance of the microscopically inhomogeneous magnetic field, γ is the proton gyromagnetic ratio, rc denotes the spatial correlation length associated with the microscopic magnetic field inhomogeneity, D is the diffusion coefficient of water within the cells or tissue, and 1/T20 is the transverse relaxation rate in the absence of these microscopic field inhomogeneities. The function F is defined by 14

The adjustable parameters (

where K0 is the variance of the microscopically inhomogeneous magnetic field, τc indicates the exchange time constant, and 1/T20 is the transverse relaxation rate in the absence of exchange. Similarly, the adjustable parameters (
Goodness of fit was assessed using the coefficient of nondetermination (1 – r2), defined by

where r is the correlation coefficient, SSE is the sum of squared errors, and SST is the total sum of squares. In particular,

where yi represents the ith experimental data point, fi is the estimated value of that data point according to the model, and the subscript avg represents average. The value of 1 – r2 measures the degree of uncertainty in the data that is not explained by the model.
Diffusion Coefficient Analysis
The diffusion coefficient (D) used in equation 1 was determined from separate diffusion-weighted MRI experiments (3T, mMR system, Siemens, Munich, Germany) using a standard echoplanar imaging acquisition, with b = 0 and b = 1,000 s/mm 2 . Using this sequence, the apparent diffusion coefficient was measured in compact pellets of MagA- expressing cells (n = 4).
Results
Iron content (normalized to protein) is provided in Figure 1. Iron levels are shown for all samples except for two that were not measured: MagA+Fe (1) in Table 1 (see also the top curve in Figure 2) and MagA–Fe (1) in Table 2. MagA+Fe samples accumulated more iron than all of the other samples except P+Fe (1), which showed an iron level comparable to those of MagA+Fe. Iron measurement of P+Fe (1) was repeated three times to determine a representative standard error of this measurement (approximately 5%). For this particular sample, the mean value is reported in Figure 1.

Intracellular iron concentration measured by ICP-MS. Each bar represents the iron measurement from an individual NMR sample. Iron levels were not measured in the samples denoted as MagA+Fe (1) (highest R2 in Figure 2) and MagA–Fe (1) in Table 1 and Table 2, respectively. Based on triplicate measurement of one sample (P+Fe (1)), there is an approximate 5% standard error of the mean in iron measurement.
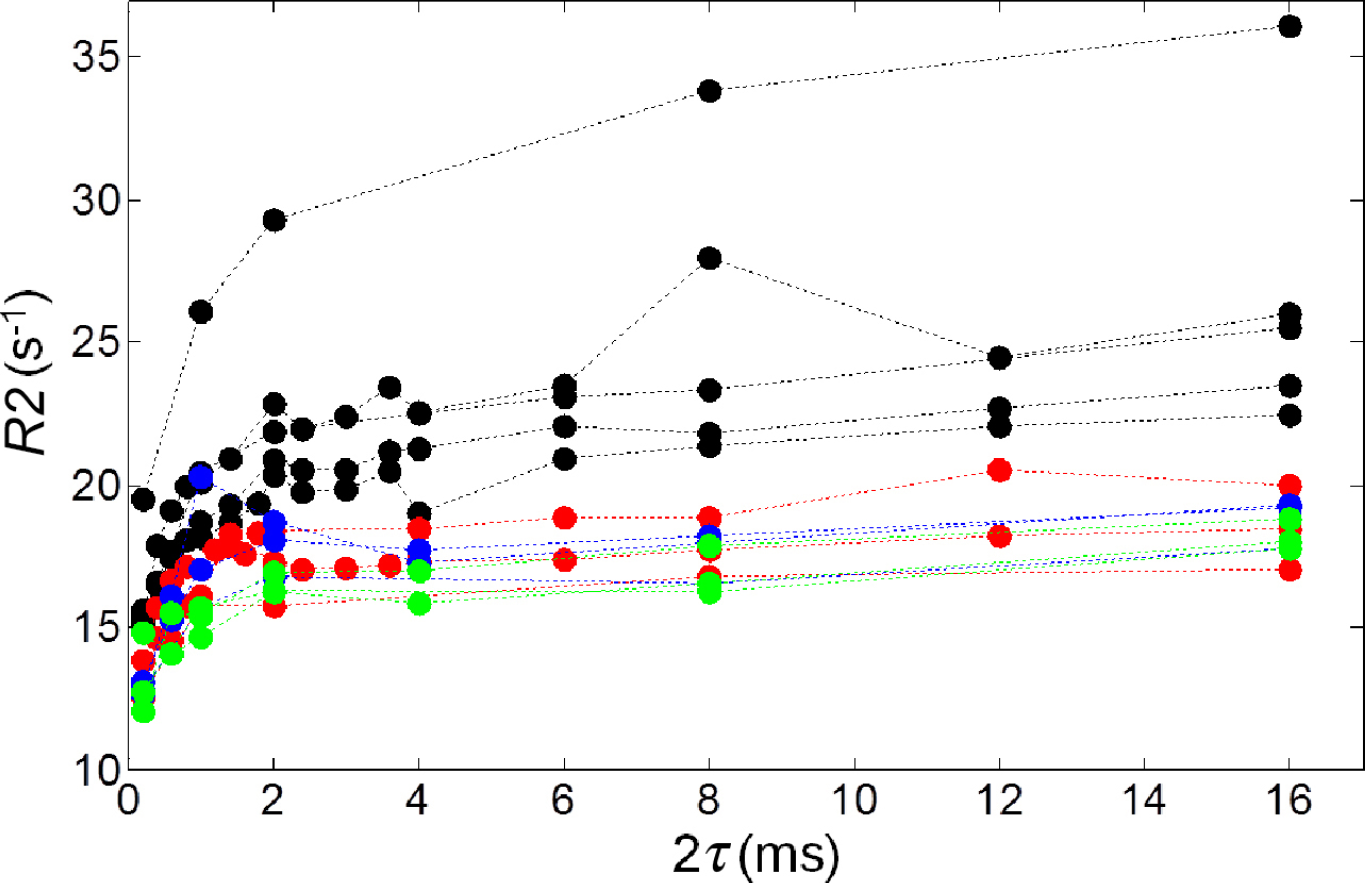
Measured R2 values at various 2τ in MagA+Fe (n = 5), MagA–Fe (n = 3), P+Fe (n = 3), and P–Fe (n = 3). MagA+Fe samples are represented with black circles. Control cells (MagA–Fe, P+Fe, and P–Fe, n = 3 each) are marked with circles (red, blue, and green, respectively). For individual R2 values, uncertainties (standard errors) were less than 0.25 s−1 for all but two individual R2 values that had uncertainties close to 0.5 s−1.
Model Parameters and Coefficients of Nondetermination (1 – r2) Obtained from Applying the Jensen-Chandra Model to Iron-Supplemented, MagA-Expressing Cells

γ2G0r2 c /2D represents the total amplitude of a curve.
Model Parameters and Coefficients of Nondetermination (1 – r2) Obtained from Applying the Luz-Meiboom Model to Control Cells *
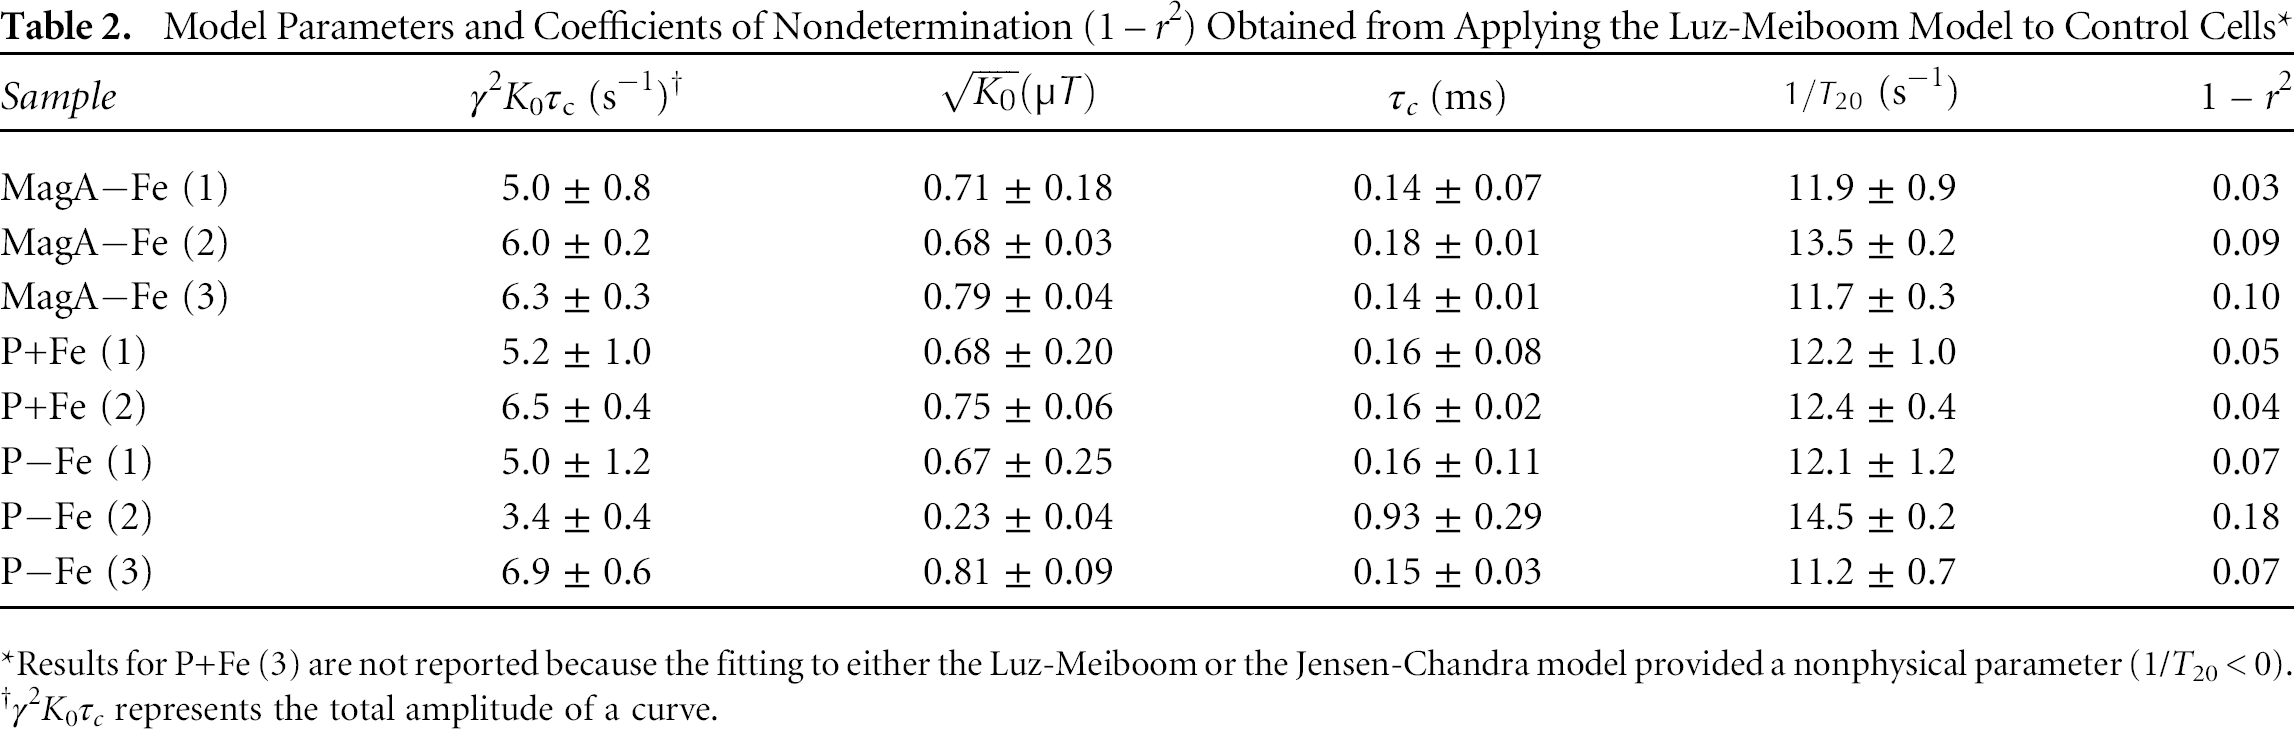
Results for P+Fe (3) are not reported because the fitting to either the Luz-Meiboomor the Jensen-Chandra model provided a nonphysical parameter (1/T20 < 0).
γ2K0τ c represents the total amplitude of a curve.
For all samples, R2 increased with increasing 2τ regardless of MagA expression or iron supplementation, with 2τ values ranging from 0.2 to 16 ms (see Figure 2). However, the increase in R2 with 2τ was stronger in MagA+Fe (n = 5) than for control cells (see Figure 2). For control cells, R2 tended to plateau over the 2τ region between 2 and 16 ms, with changes in R2 over this region being < 2 s−1. In contrast, for MagA+Fe cells, the change in R2 over this region ranged from approximately 2 to 7 s−1. For one of the MagA+Fe samples (MagA+Fe (1), the top curve in Figure 2, no iron level measured), all R2 values and the change in R2 with 2τ (ranging from 0.2 to 16 ms) appeared to be substantially higher than for other samples. The normalized signal decay curves in Figure 3 illustrate the difference in the rate of signal decay as 2τ changes in a representative sample of MagA+Fe (the highest black circles in Figure 2).

The normalized signal intensity decay curves of a representative sample (MagA+Fe (1)) with different values of 2τ. Amplitudes were normalized to have an initial value of 1. The solid curves indicate monoexponential decay fit to the corresponding data. The signal intensity decays faster with higher 2τ values compared to lower 2τ.
For 100 μM MnCl2(aq) samples (n = 3, Figure 4), variations of R2 as a function of 2τ were small compared to changes for cell samples (with any deviations at short 2τ being within ± 1 s−1 of long 2τ values), indicating that the R2 variation with 2τ observed in cells was not an artifact associated with an increasing number of refocusing pulses applied with the shorter 2τ values.
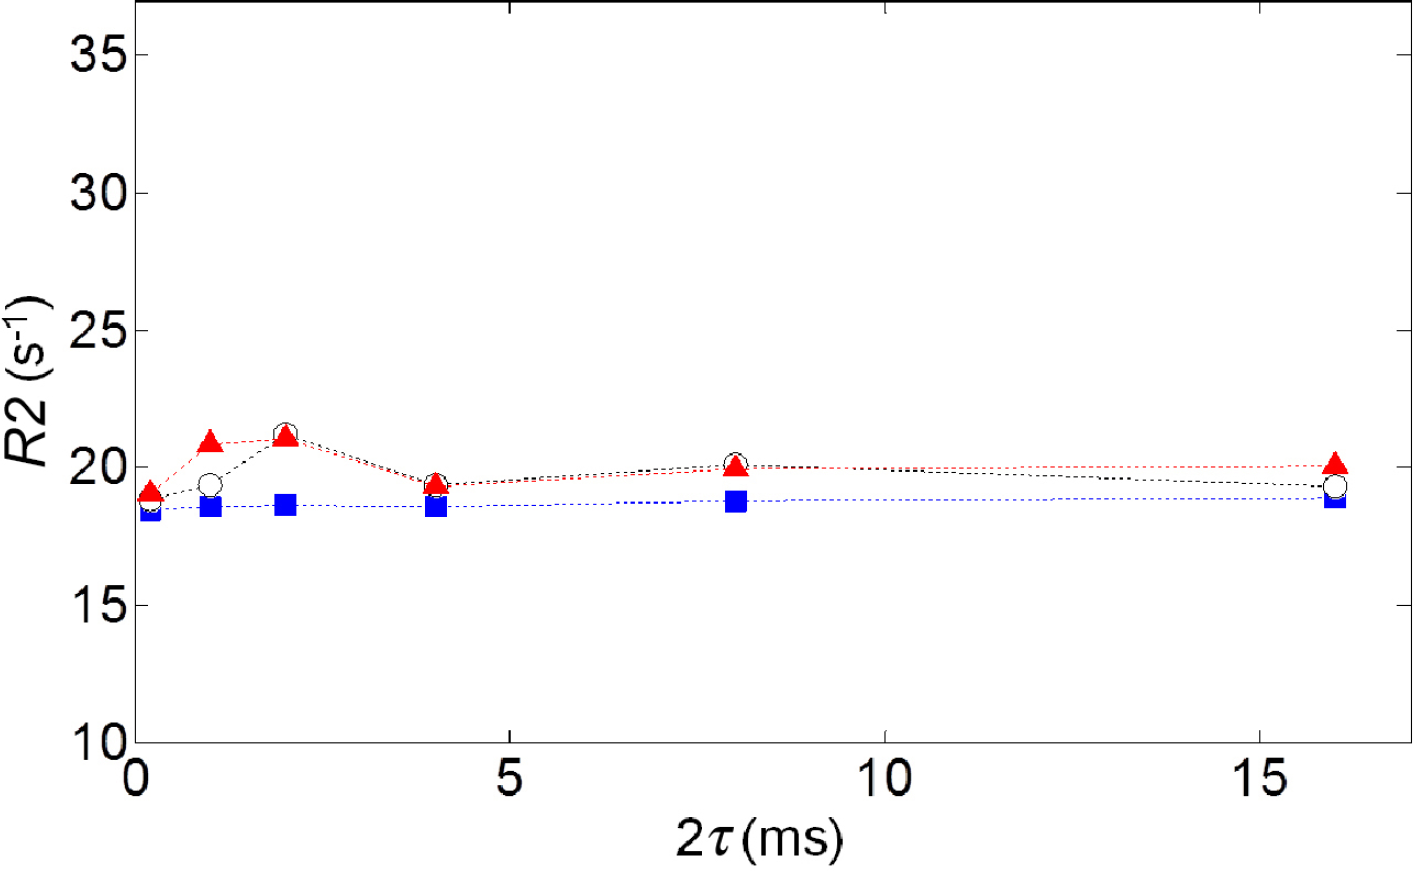
Measured R2 values at various 2τ for 100 μM MnCl2 samples (n = 3). The three different symbols correspond to the three samples of MnCl2.
Figure 5 illustrates fitted curves for MagA+Fe (n = 5) obtained with the Jensen-Chandra model (solid curves). The Luz-Meiboom model (dashed curves) is also shown for two of the samples. The Jensen-Chandra model provides a better fit than the Luz-Meiboom model, as evaluated by the ratio of the coefficient of nondetermination (1 – r2) obtained with the Luz-Meiboom model to that of the Jensen-Chandra model. This ratio was greater than 1 for all samples (13.4 for the sample with the highest R2 values [the highest black circles in Figure 2] and ranged from 1.4 to 2.7 for the other four samples).

Application of the Jensen-Chandra and the Luz-Meiboom models to measured R2 values in MagA+Fe (n = 5). Individual samples are distinguished by different colours. All heavy-weighted curves indicate the Jensen-Chandra model fit to the corresponding samples. The two dashed curves indicate representative fitting to the Luz-Meiboom model.
Model parameters of fit and the coefficients of nondetermination (1 – r) derived from fitting the Jensen-Chandra model for MagA+Fe samples are listed in Table 1. The values of rc were calculated using the mean value of D (0.55 μm 2 /ms) obtained from diffusion-weighted imaging experiments. (The standard deviation of D was 0.08 μm 2 /ms.) Standard errors obtained from the fitting procedures are also provided for each parameter estimated in Table 1.
Figure 6 illustrates curves obtained from fitting the Luz-Meiboom model to representative samples from each subgroup of control cells (MagA–Fe, P+Fe, and P–Fe). The fitted curves from the Jensen-Chandra model are not shown as these provided, in most cases, nonphysical parameter estimates (1/T20 < 0 for seven samples and 1/T20 was within one standard error of zero for an eighth sample); therefore, the Jensen-Chandra model was not considered a reasonable representation of these data. Model parameters of fit and the coefficients of nondetermination (1 – r2) derived from applying the Luz-Meiboom model to control samples are summarized in Table 2. Model parameters for one of the P+Fe samples (P+Fe (3)) are not provided in Table 2 because fitting to either the Luz-Meiboom or the Jensen-Chandra model provided a nonphysical parameter (1/T20 < 0). Similarly, model parameters (

Discussion
In this article, we have demonstrated and quantified the dependence of the transverse relaxation rate (R2) on interecho time in MagA-expressing cells and the corresponding parental cell line. To our knowledge, this is the first report to investigate this dependence in gene-based, iron-labeled cells. The relationship between R2 and interecho time was further characterized with previously developed mathematical models, providing quantitative estimates of parameters thought to be associated with MR relaxation mechanisms. In the future, this type of analysis could be applied to compare different gene-based, iron-labeled systems and may help guide their further development for reporter gene expression using MRI.
Iron Content
The iron levels reported here can be directly compared to those previously reported for iron-supplemented, MagA- expressing cells of the same type cultured under the same iron-supplemented conditions (250 μM ferric nitrate). 10
These authors reported a mean iron level of 0.67 ± 0.11 μg Fe/(mg of protein), which is comparable to values reported here (see Figure 1). It should also be noted that our values in Figure 1 do not include levels for one of our samples (the highest black circles in Figure 2), which may have had the highest iron content of our samples. Although bacterial magnetosomes can be formed in the absence of magA gene expression,29,30 other reports and our iron content analysis showed that MagA overexpression results in an increased level of cellular iron.8,10
We calculated the iron content per cell to compare our results to estimates reported in other studies of gene-based iron labeling. In our samples, there were approximately 370 million cells per milliliter (based on pellet volume and number of cells in the pellet), and we assumed that protein accounts for approximately 20% of total cell weight 31 and that the mass density of samples is approximately 1.0 g/mL. This leads to an estimate of 0.19 – 0.33 pg Fe/cell for our MagA+Fe samples, which is comparable to iron levels (0.59 ± 0.14 pg/cell) found in another MagA-expressing mammalian cell line cultured in the presence of 200 μM ferric citrate. 8
To compare our iron levels to values reported for tissue, we again assumed that protein accounts for approximately 20% of total cell weight. 31 This leads to estimated iron levels per unit mass of pellet of 0.07 to 0.12 mg Fe/mg for our MagA+Fe samples, which is comparable to human brain iron levels (0.05–0.21 μg Fe/mg) and levels in human liver (0.13 μg Fe/mg). 32 Interestingly, iron levels are quite low (0.02 μg Fe/mg) in the mouse brain, 33 which is advantageous for cell tracking, in contrast to other mouse organs (0.21 μg Fe/mg of liver, 0.11 μg Fe/mg of heart, and 0.14 μg Fe/mg of kidney 34 ).
Analysis Using the Jensen-Chandra and the Luz-Meiboom Models
The curves shown in Figure 5 suggest that the relationship between R2 and 2τ for MagA+Fe samples is better described by the Jensen-Chandramodel than the Luz-Meiboom model. This is supported by our reported ratios of 1 – r2 and the previous assessment of Jensen and Chandra in iron-containing tissues. The superior performance of the Jensen-Chandra model and the apparently monoexponential shape of the R2 decay curves (see Figure 3) provide support for the contention that this model, which depends on the weak field approximation, 14 is appropriate for iron-supplemented, MagA-expressing systems. The application of the Jensen-Chandra model in MagA+Fe samples is further supported by noting that our data satisfy the following weak field approximation condition provided by Jensen and Chandra 14 :

where ΔR2 is the contribution to R2 from microscopic magnetic field inhomogeneities. From the values of rc (see Table 1), our D value (0.55 μm 2 /ms), and measured change in R2 (ΔR2) from very short to long interecho times, it is clear that this condition is satisfied for the iron-supplemented, MagA- expressing system.
It is interesting that the spatial correlation lengths (rc) for MagA+Fe samples tended to be smaller than those previously found for iron-containing tissues. Our values of rc (see Table 1) ranged between 0.24 and 0.45 μm, whereas rc values of 2.3 to 3.1 μm were measured for regions of human brain and 0.9 μm for liver. 14 The larger rc values obtained for brain tissue may reflect larger distances between iron-containing cells (compared to compact cell pellets) since, in gray matter of brain, iron is not uniformly distributed in all cells but is highest in oligodendrocytes. 35 Perhaps this difference could be exploited in helping to differentiate the MagA-derived iron label from endogenous iron in MRI.
Additionally, one may also speculate that our measured values of rc provide rough estimates of the dimensions of iron-filled vesicles within the cells. Jensen and Chandra showed theoretically that for a random distribution of uniformly magnetized spheres, rc ~ 0.9R, where R is the radius of the spheres. 14 They found that this relationship held to a reasonable approximation for experimentally determined rc values in red blood cell suspensions. Interestingly, the electron microscopy images of MagA-expressing cells displayed in Figure 2 of Zurkiya and colleagues show vesicles containing iron particles from MagA-expressing cells having radii ranging from approximately 100 to 350 nm, and these values are roughly similar to rc values found in our study (which range from 240 to 450 nm; see Table 1). 8
We can also compare our values of the root-mean-square field inhomogeneity (
Although the Jensen-Chandra model performs well for MagA+Fe samples, it fails to characterize the relationship between R2 and 2τ in control cells, whereas the Luz-Meiboom model does fit these data reasonably well. This difference in model fitting is consistent with the visual appearance of the R2 versus 2τ curves, which indicates a difference in shape for the control cells compared to the MagA+Fe cells. The control cell curves increase sharply in the short 2τ region (≥ 2 ms) and then almost plateau, whereas for MagA+Fe, the curves show a more gradual increase in the longer 2τ region. The reasons for the better performance of the Luz-Meiboom model for the control cells are unclear. Possibly, iron within these cells is not uniformly distributed at the microscopic level (i.e., clustered), making a compartment model more appropriate. Also, given that, in comparison to the MagA+Fe samples, some of the control cells have rather low iron levels (~ 0.05 μg Fe/(mg of protein); see Figure 1), it is possible that non–iron-related sources of microscopic field inhomogeneities (associated with microscopic magnetic susceptibility variations) contribute to the change in R2 with 2τ. An estimate of such a noniron effect is provided by previous experiments with lipoprotein micelles.
37
The authors found that by changing the lipoprotein core radius from approximately 50 to 200 Å, the frequency of protons inside the core varied over approximately 0.05 ppm, and this was shown to be consistent with predictions based on the magnetic susceptibility anisotropy of the shell. This frequency shift (0.05 ppm) would correspond to a microscopic magnetic field shift of approximately 0.5 μT at our field strength (9.4 T), which is similar in order of magnitude to our values of
Implications for In Vivo MRI Acquisition
The R2 dependence on 2τ that we observed in this work could be applied for MRI-based detection of MagA-expressing cells in vivo. A simple scheme would be to acquire image-based R2 measurements (R2 maps) with two 2τ values and determine the difference between the two R2 measurements to assess the iron-related contribution to R2. This type of strategy has been previously applied for detection of endogenous iron in human brain imaging,12,38 using 2τ values of 6 and 60 ms. For detection of MagA-expressing cells, our data suggest that the 2τ values should be much shorter than those used in these brain iron studies, with the shorter 2τ value being no more than 1 or 2 ms. (The shorter 2τ value [< 2 ms] should be possible with small animal MRI systems.) If more 2τ values are acquired, then it might be possible to differentiate the iron label from sources of endogenous iron based on the shorter rc value of the former, as indicated above. Finally, it should be noted that because the values of rc may be related to the size of iron particle clusters, the optimal 2τ values for such imaging measurements, especially if only two 2τ values are used, could differ for other gene expression systems; hence, for other gene expression systems, in vitro studies should be performed to estimate rc values.
Limitations and Unexplained Observations
As shown in Figure 2, R2 values for one of our MagA+Fe cells were quite high compared to those of the other four samples. Although it is possible that this could be, in part, due to higher iron levels in this sample, this possibility cannot be confirmed because an iron measurement was not carried out for this sample. However, iron levels as high as 1.4 mg Fe/(mg of protein) have been obtained from iron-supplemented, MagA-expressing cells of the same type cultured under the same iron-supplemented conditions. 39 Variability in MRI- based R2 measurements from these previously studied samples was associated with variability in iron levels based on correlation analysis. 39
Although the difference in shape and lower amplitude of the R2 versus 2τ data for control samples compared to MagA+Fe samples seems reasonable based on the lower iron levels of the former, this does not explain the observations for one of the control samples (P+Fe (1)). For this sample, the R2 versus 2τ data (including model fitting) were similar to those of the other control cells despite the high iron levels (see Figure 1). Although the explanation for this is not clear, one might speculate that a high level of iron remained in this sample due to a transient fluctuation in iron homeostasis 40 that is not representative of the major form of iron found in MagA+Fe samples.
Measurement of the R2 versus 2τ relationship can, in principle, be confounded by the changes in R2 decay curve sampling that naturally occur with increasing 2τ. For this work, in which an even number of refocusing pulses was applied, the earliest sample was collected at a signal echo time of 4τ; hence, regions of the curve at times less than 4τ were not observed. This issue is apparent on the R2 decay curve for 2τ = 16 ms (see Figure 3), where the first data point is located at a signal echo time of 32 ms, which is approximately equal to the T2 (1/R2) for that curve.
Conclusion
Our NMR studies of iron-supplemented, MagA-expressing cells demonstrated that the dependence of R2 on interecho time is well described by the Jensen-Chandra weak field model. The spatial correlation lengths for iron-supplemented, MagA- expressing cells obtained from the Jensen-Chandra model were found to range from 240 to 450 nm, and this is consistent with iron-filled vesicles having radii on the order of a few hundred nanometers. Nonsupplemented MagA-expressing cells and their parental controls also showed observable changes in R2 with interecho time, but this was largely at short (< 2 ms) interecho times, whereas variation in R2 at longer interecho times was larger for iron-supplemented, MagA-expressing cells. Interestingly, for nonsupplemented MagA-expressing cells and the parental controls, the Luz-Meiboom model provided a more reasonable fit than the Jensen-Chandra model, suggesting a difference in the microscopic magnetic field distribution in these samples relative to the iron-supplemented, MagA- expressing cells.
Footnotes
Acknowledgments
The authors would like to thank Lynn Keenliside for creating the NMR-compatible vial, Dr. Mathew Willans for helping with NMR spectroscopy, and Anindita Sengupta for providing the raw diffusion-weighted MRI data used to calculate a specific apparent diffusion coefficient for MagA-expressing cells. We would also like to thank Karina Quiaoit and Linshan Liu for helpful discussions.
Financial disclosure of authors: This research was supported by an Ontario Research Fund award (ORF-ICT Project #02-038) to F.S. P., R.T.T., and D.E.G. in partnership with Multi-Magnetics Inc and by an Natural Sciences and Engineering Research Council of Canada award to F.S.P.
Financial disclosure of reviewers: None reported.