
Abstract
The objective of this work was to evaluate the sympathetic nervous system and structure remodeling during the progression of heart failure in a rodent model using dynamic cardiac single-photon emission computed tomography (SPECT). The spontaneously hypertensive rat (SHR) model was used to study changes in the nervous system innervation and perfusion in the left ventricular (LV) myocardium with the progression of left ventricular hypertrophy (LVH) to heart failure. Longitudinal dynamic SPECT studies were performed with seven SHR and seven Wistar-Kyoto (WKY) rats over 1.5 years using a dual-head SPECT scanner with pinhole collimators. Time-activity curves (TACs) of the 123I-MIBG and 201Tl distribution in the LV blood pool and myocardium were extracted from dynamic SPECT data and fitted to compartment models to determine the influx rate, washout rate, and distribution volume (DV) of 123I-MIBG and 201Tl in the LV myocardium. The standardized uptake values (SUVs) of 123I-MIBG and 201Tl in the LV myocardium were also calculated from the static reconstructed images. The influx and washout rates of 123I-MIBG did not show a significant difference between SHRs and WKY rats. The DVs of 123I-MIBG were greater in the SHRs than in the WKY rats (p = .0028). Specifically, the DV of 123I-MIBG became greater in the SHRs by 6 months of age (p = .0017) and was still significant at the age of 22 months. The SUV of 123I-MIBG in SHRs exhibited abnormal values compared to WKY rats from the age of 18 months. There was no difference in the influx rate and the washout rate of 201Tl between the SHRs and WKY rats. The SHRs exhibited greater DV of 201Tl than WKY rats after the age of 18 months (p = .034). The SUV of 201Tl in SHRs did not show any significant difference from WKY at all ages. The higher DV of 123I-MIBG in the LV myocardium reveals abnormal nervous system activity of the SHRs at an age of 6 months, whereas a greater DV of 201Tl in the LV myocardium can only be detected at an age of 18 months. The results show that the abnormal nervous system activity appears earlier than perfusion. Furthermore, the comparison between the DV and the SUV indicates that dynamic SPECT with 123I-MIBG and 201Tl with the kinetic parameter DV is capable of detecting abnormalities of the LV at an early age.
HEART FAILURE occurs when the heart is unable to pump sufficient blood to meet the needs of the body. The reasons causing heart failure are complicated, including myocardial infarctions, ischemic heart disease, hypertension, and cardiac myopathies. The development of hypertension can lead to left ventricular hypertrophy (LVH), which is a condition of the enlargement and thickening of the left ventricular (LV) muscle and can result in heart failure. During this process, the function of the sympathetic nervous system and the structure of the LV myocardium deviate from normality.
In this work, we used dynamic single-photon emission computed tomography (SPECT) with 123I-metaiodobenzylguanidine (123I-MIBG) and 201thallium (201Tl) to detect abnormalities in the cardiac sympathetic nervous system and perfusion at an early stage of LVH using the spontaneous hypertensive rat (SHR) as a model. Rat models have been the most widely used heart failure models in research 1 ; SHRs and their healthy counterparts, normotensive Kyoto-Wistar (WKY) rats, were employed in this study. The SHR (Okamoto and Aoki strain) is a rodent model of hypertension associated with generalized dyslipidemia and insulin resistance. The CD36 gene on chromosome 4 in the SHR is defective, 2 with multiple sequence variants, resulting in a defective fatty acid translocase, which is a membrane protein involved in the transport of long-chain fatty acids into the cell. This compromises tissue use of fatty acid and increases the basal glucose metabolism and hyperinsulinemia. A high rate of glucose uptake increases insulin requirement, and overexpression of glucose membrane transporters results in eventual insulin resistance. The SHR provides a reliable model of a naturally developing pressure overload akin to essential hypertension. 3
MIBG is an analogue of the false neurotransmitter guanethidine taken up by adrenergic neurons, similar to norepinephrine. MIBG was developed by Wieland and colleagues for the purpose of functional imaging of the adrenal glands.4,5 When tagged with iodine-123, 123I-MIBG can be used to image adrenergic receptors in many organs, including the heart. 6 123I-MIBG has been used in preclinical7–9 and clinical10–12 studies to evaluate ischemic heart disease,13,11 diabetes mellitus,9,15,16 and heart failure. 11 There are two uptake mechanisms of MIBG, uptake-1 and uptake-2. Through uptake-1, MIBG is sequestered by sympathetic nerve terminals. The distribution of 123I-MIBG in neuronal cells reflects the myocardial sympathetic innervation and allows a unique characterization of alterations in regional sympathetic nerve function. Uptake-2 involves uptake of MIBG into nonneural cells for which the mechanism can vary between species and is reported not to be present in large mammals, including humans 17 and rabbits. 18 However, in the rat heart, the uptake-2 mechanism contributes to the uptake of MIBG.1,19,20
201Tl is a myocardial perfusion agent that has been widely used to assess myocardial perfusion and viability. The kinetic analysis of 201Tl in myocardial tissue has been extensively studied.21–28 The early distribution of 201Tl after intravenous administration is proportional to regional myocardial blood flow times the myocardial extraction. 27 After the initial uptake, there is continuous exchange between 201Tl in the myocardium and 201Tl in the blood pool. This process forms the basis of redistribution whereby an abnormal redistribution of 201Tl is an indication of ischemia.
We used 123I-MIBG and 201Tl as the radiotracers in SPECT to study abnormal changes in the LV myocardium in the progression of LVH to heart failure in the SHR model. We calculated and assessed the following indices in these two rat models: (1) the influx and washout rates of 123I-MIBG, (2) the influx and washout rates of 201Tl, (3) the distribution volume (DV) of 123I-MIBG and 201Tl, (4) the standardized uptake value (SUV) of 123I-MIBG and 201Tl in the LV myocardium, and (5) postmortem heat to body weight ratios. Since the mediastinum is difficult to recognize in rat, the SUV was calculated from the static reconstructed images instead of the heart to mediastinum ratio. We hypothesized that some or all of these indices could discriminate the SHR group from the WKY group by showing significant difference in the values, with some of the indices detecting differences earlier than others.
Materials and Methods
Radiotracer Synthesis
The 201Tl was obtained locally from Cardinal Health Pharmacy (Richman, CA). 123I-MIBG was obtained from AnazaoHealth Corporation (Tampa, FL) in a freeze-dried form. Before injecting, it was diluted in saline to a concentration of approximately 185 MBq per milliliter.
Animal Study Design
Two groups of rats, seven SHRs and seven normotensive WKY rats, were used in this work. The imaging study began at age 6 months, and the rats were imaged throughout their life span at four separate times (imaging studies I, II, III, and IV), corresponding to the ages of 6, 11 to 12, 18, and 21 to 22 months. In each imaging study, rats were imaged using two radiotracers, 201Tl followed immediately by 123I-MIBG. The number of rats in each group in each imaging study is shown in Table 1. All rats were not fasted but were freely fed standard Purina rat chow and water. All imaging studies were performed in accordance with Institutional Animal Care and Use Committee–approved protocols at Lawrence Berkeley National Laboratory.
Number of Rats in the 123I-MIBG and 201Tl Imaging Studies
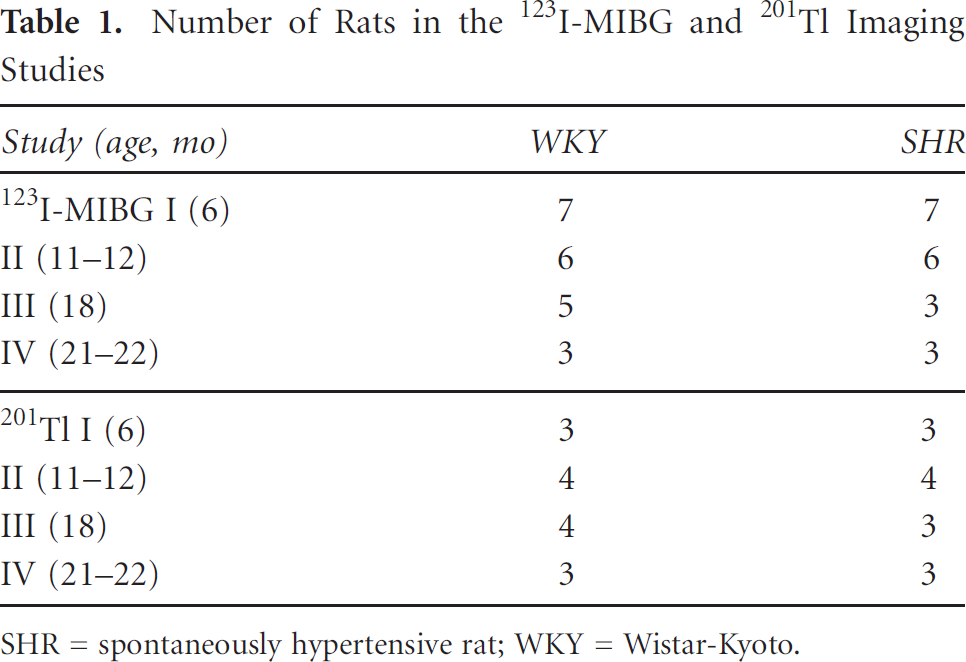
SHR = spontaneously hypertensive rat; WKY = Wistar-Kyoto.
Imaging Protocol
The imaging studies were performed using the GE Millennium VG3 Hawkeye dual-head SPECT/CT system at Lawrence Berkeley National Laboratory. The detector heads were arranged in H mode (the two heads of the scanner were parallel and opposite to each other with the rat positioned between the two parallel heads) and equipped with custom-designed pinhole collimators with tungsten inserts with apertures of 1.5 × 2 mm, providing a sensitivity of 0.03 cps/kBq and a resolution that could resolve hot spots in the micro Jaszczak Phantom separated by 1.2 mm. 29 The point response of the pinhole was modeled, but no scatter or attenuation was included. Each rat was anesthetized with 2% isoflurane and oxygen. Isoflurane can influence the heart rate in humans and consequently the uptake of 201Tl. 30 However, the isoflurane was applied the same to all animals in both groups and unlikely to change the differences between the groups. Radiotracers were administered via tail vein using bolus injections with activities of 227.18 ± 46.25 and 60.31 ± 11.47 MBq for 123I-MIBG and 201Tl, respectively. The energy window for 123I-MIBG was 159 ± 10% keV (20% window) and 70 ± 10% keV (20% window) for 201Tl. Image acquisition began at the same time as the injection. First, the acquisition of 201Tl lasted 20 minutes for 12 rotations, followed by the acquisition of 123I-MIBG for 100 minutes (66 rotations). No correction was performed in this study for crosstalk between the two tracers because the contamination of 201Tl is small (less than 5%) in the projections of 123I-MIBG. The acquisition protocol performed the lower energy 201Tl study first, which is regarded as a solution for this dual-tracer acquisition because 201Tl washes out rapidly, leaving very little contribution from the 10% of the 201Tl emissions at 167 keV. 31 Each of the two detector heads of the SPECT camera sampled 90 projection angles in 90 seconds per rotation, making 90 × 2 projection data sets. The number of the detector bins for each projection was 120 × 88, so the dimensions of the projection data were 120 × 88 × 90 × 2 for each rotation.
Image Analysis
All projection data were processed in the following steps.
Extraction of Time-Activity Curves
The projections were divided into two parts according to the acquisition time. In the first part, the projections in the first rotation were reconstructed using the four-dimensional reconstruction algorithm that we developed and validated in previous work 32 to estimate the time-activity curves (TACs) for the first 90 seconds. This method used a sparse matrix to reduce spatial dimensions. The sparse matrix was constructed from the three-dimensional image (Figure 1) that was reconstructed from the late projections (summation of projections from the second rotation to the 66th rotation). Each column vector in the sparse matrix represents a functional region within which the activity is assumed to be similar during the imaging procedure. In the temporal dimension, the TACs were estimated by reconstructing coefficients of the nonuniformly distributed B-spline basis functions selected adaptively according to the rules in Zan and colleagues. 32 In the second part, TACs from the second rotation to the 66th rotation were extracted from the series of static reconstructed images for each rotation by averaging the activity in each region of interest (ROI), such as the LV blood pool and LV myocardium. The ROI were segmented from the three-dimensional reconstructed image using a repeated fuzzy C-means algorithm. 33

A late 3D static image of the rat heart (reconstructed from the summation of projections from the second rotation to the 66th rotation). Note that the uptake in the spine is as one would expect for the sympathetic innervation of the heart.
Kinetic Modeling
All estimated TACs were used to fit a one- or two-compartment model (Figure 2) using the Levenberg-Marquardt algorithm34 in MATLAB to determine two parameters (K1 and k2) for the one-compartment model and four parameters (K1,k2,k3,k4) for the two-compartment model.

(A) One-compartment model and (B) two-compartmental model used in the study of the biochemical process of 123I-MIBG and 201Tl.
In the one-compartment model (see Figure 2A), the tissue uptake was modeled by the following equation:

where K1 is the influx rate and k2 is the washout rate constant, 35 C t (t) represents the radiotracer concentration in the measured tissue at time t, C p (t) is the radiotracer concentration in the blood at time t, and fv is the blood-volume fraction in the measured tissue (0 ≤ fv ≤ 1).
In the two-compartment model (see Figure 2B), the tissue uptake was modeled by the following equation36:


where K1 is the influx rate of the radiotracer related to the blood flow and extraction, which is an important index in the evaluation of myocardial function using SPECT perfusion imaging; k2,k3, and k4 are the rate constants shown in Figure 2B; C p (t) is the input function of the two-compartment model, which represents the function of the radiotracer concentration in the capillary; C t (t) is the output function of the two-compartment model calculated from the convolution between the input function C p (t) and the system response function of the two-compartment model; C t (t) represents the radiotracer concentration in the measured tissue; and fv is the blood-volume fraction in the measured tissue.
Distribution Volume
The DV representing the ratio of tissue to blood-pool radioactivity concentration during transient equilibrium was considered to evaluate the retention of the radiotracer in the tissue of the LV myocardium.
For the one-compartment model, the DV was calculated with influx rate K1 and washout rate k2 by the following equation:

For the two-compartment model, the DV was calculated as described in Lau and colleagues24:

Standardized Uptake Value
SUV, 37 a semiquantitative metric often used clinically in nuclear medicine, was calculated using

where Activity ROI is the mean activity (μCi/g) of the radiotracer in the ROI, Dose injected is the injected dose (μCi) of the radiotracer, and BW is the body weight (in grams) of the rat. The SUV of the radiotracer in the LV myocardium was calculated from the static reconstructed images with the ROI acquired from the construction of the sparse matrix de-scribed in the section on extraction of TACs.
Quantitative Analysis of 123I-MIBG
As described in the introduction, 123I-MIBG is taken up by the presynaptic nerve endings, stored in vesicles, and released via exocytosis during nerve excitation. Since the compartment models used for the MIBG kinetic modeling are still controversial, the one-compartment model 10 and the two-compartment model 7 were both employed to model the uptake process of 123I-MIBG to determine the model parameters that are best identifiable for the acquired data. Through kinetic modeling, the influx rate K1, washout rate k2 and DV (Equation 4) from the one-compartment model and the DV (Equation 5) from the two-compartment model of 123I-MIBG were evaluated for the two groups (WKY rats and SHRs). The SUV of the 123I-MIBG was also calculated using Equation 6.
Quantitative Analysis of 201Tl
More than 60% of 201Tl uptake occurs via active transport by use of the Na+,K+-adenosine triphosphatase sarcolemmal membrane transport system. 27 In vivo, 201Tl myocardial uptake reaches its peak within several minutes 27 after intravenous injection, corresponding with a rapid clearance of the tracer from the blood pool. 201Tl is sequestered intracellularly by normal myocytes. 27 According to the transport process of 201Tl, the TACs of 201Tl were fit to a two-compartment model. 24 For the two-compartment model, the influx rate K1, the washout rate k2 and the DV (Equation 5) of 201Tl in the myocardium were estimated to evaluate the progression of LVH. The SUV of 201Tl was also calculated from the static reconstructed image.
Statistical Analysis
All results were presented as mean ± SD. The Kruskal-Wallis nonparametric test was used to compare the mean of the interested parameters for the two rat models with unequal variances at each given time point, as well as the postmortem heart to body weight ratios. For all tests, p values less than .05 were considered statistically significant. Two-way analysis of variance (ANOVA) with repeated measures was used to evaluate the effect of independent variables (rat model and age) and to identify possible interaction between the means of these two variables.
Results
Assessment of Heart to Body Weight Ratios
All rats were weighed after natural death or after being euthanized at the end of the imaging studies. The body weight of each rat at the time of the imaging study (age = 6, 11–12, 18, 21–22 months) is shown in Table 2. The body weight in the WKY group increased with age, whereas the value in the SHR group increased but then decreased as they became sick. The weight ratio between heart and body was calculated for each rat (Table 3). For the WKY group, all rats were euthanized after imaging study IV (21–22 months), except for rat 2, which was euthanized before imaging study II (11–12 months). For the SHR group, one rat (#1) died before imaging study II (11–12 months) and two rats (5 and 7) died before imaging study III (18 months). Other WKY rats and SHRs were euthanized after imaging study IV (21–22 months). The weight ratio between heart and body for the SHR group was significantly larger than that in the WKY group (p = .002). The heart to body weight ratio increased with age.
Body Weight of Each Rat at Each Imaging Study
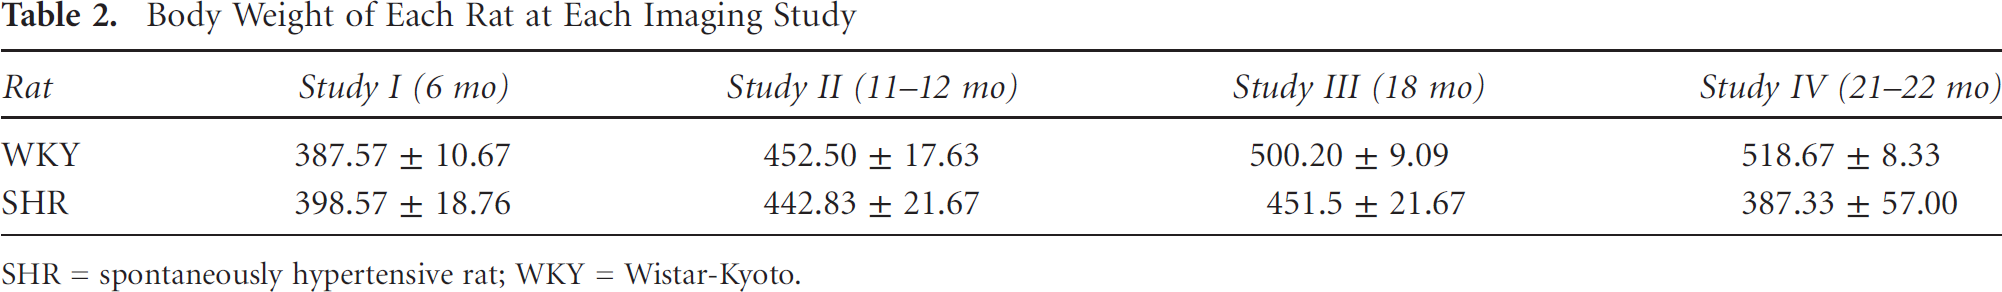
SHR = spontaneously hypertensive rat; WKY = Wistar-Kyoto.
Influx Rate of 123I-MIBG from the LV Blood Pool to the Myocardium
The one-compartment influx rate of 123I-MIBG reflects the uptake of 123I-MIBG by myocardium from the blood pool. Figure 3A shows the mean and standard deviation of the influx rate of 123I-MIBG in each group for each imaging study. According to the statistical result, there was no significant difference between the WKY group and the SHR group (p = .19). The change in the influx rate with age was also not significant according to the two-way ANOVA with repeated measures (p = .36). The interaction effect between the groups (WKY group vs SHR group) and age was also not significant (p = .98). For each imaging study, the SHR group did not show any significant abnormality in the influx rate (p = .18 for study I at the age of 6 months, p = .20 for study II at the age of 11–12 months, p = .65 for study III at the age of 18 months, and p = .51 for study IV at the age of 21–22 months).
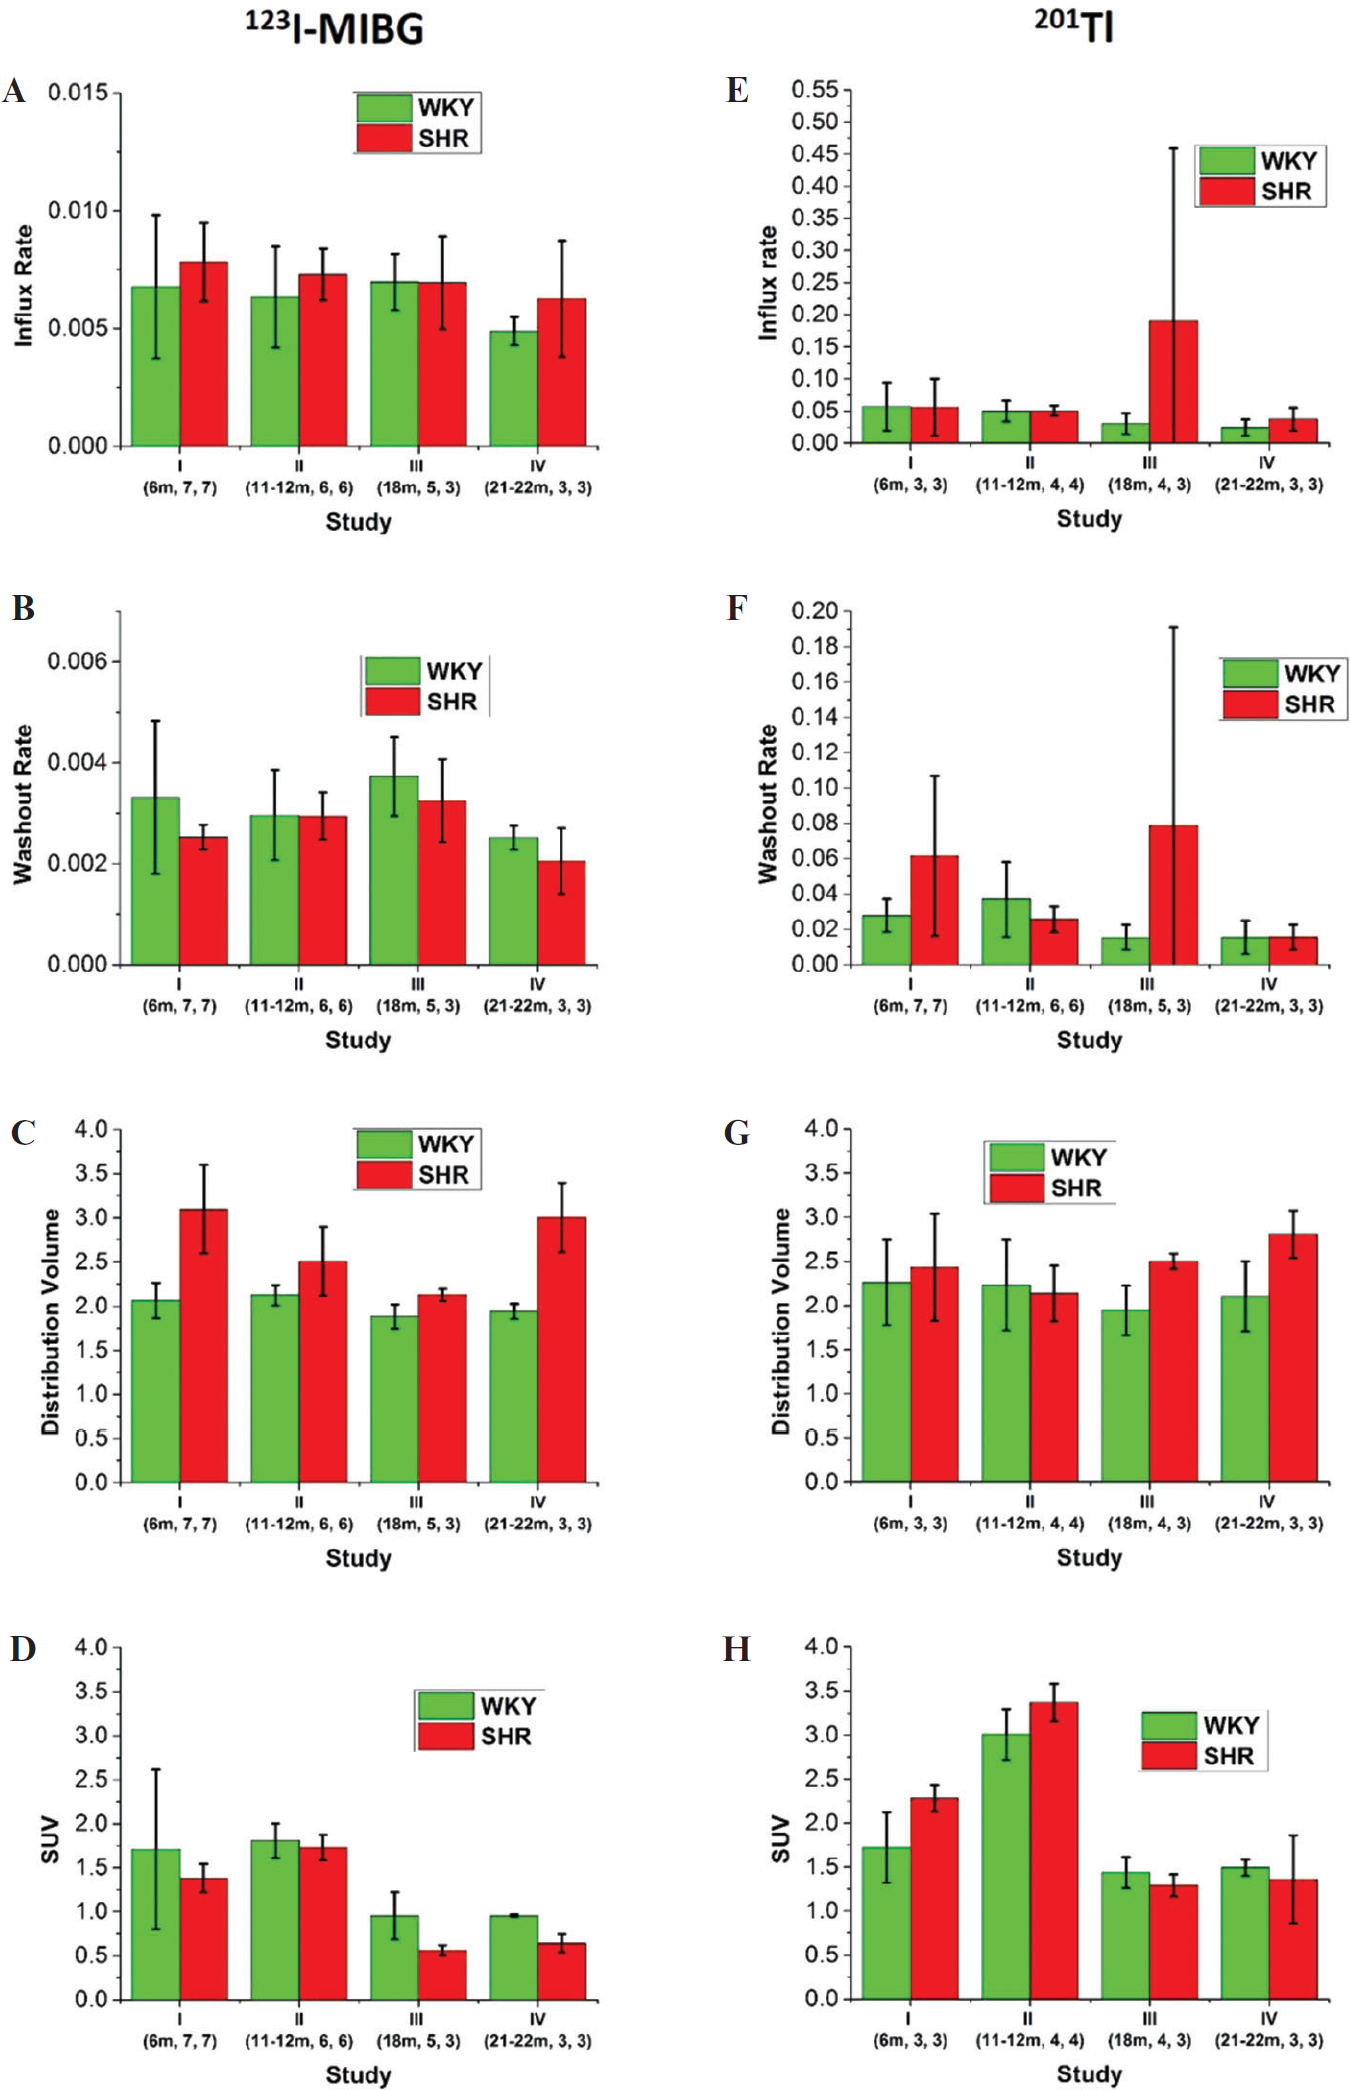
(A) Influx rate, (B) washout rate, (C) distribution volume (DV), and (D) standardized uptake value (SUV) of 123I-MIBG and (E) influx rate, (F) washout rate, (G) DV, and (H) SUV of 201Tl for left ventricular myocardium. The error bar represents the standard deviation. Numbers under the study labels correspond to the ages of rats and the number of samples measured for the WKY group and the SHR group, respectively.
Washout Rate of 123I-MIBG from the Myocardium to the LV Blood Pool
The washout rate of 123I-MIBG is reported to be a good measurement of cardiac sympathetic activity. 9 Figure 3B shows the mean washout rate of 123I-MIBG in each group for each imaging study. The two-way ANOVA with repeated measures showed no significant main effect difference between the WKY group and the SHR group (p = .59). The decrease in the washout rate with age was also not significant according to the results of the two-way ANOVA with repeated measures (p = .22). The interaction effect between group and age was also not significant (p = .60). The Kruskal-Wallis test for each imaging study (age = 6, 11–12, 18, 21–22 months) showed that the difference between the WKY group and the SHR group was not significant for each imaging study (p = .57, p = .63, p = .46, and p = .51, respectively).
DV of 123I-MIBG in the LV Myocardium
Since individual rate constants are not always a reliable parameter, 9 the DV of the 123I-MIBG in the LV myocardium for the one-compartment model was compared between the WKY group and the SHR group. Figure 4A shows an example of the fitting results of the myocardium TACs for 123I-MIBG. The fitted myocardium TACs for the two-compartment model is better than that for the one-compartment model. However, the DVs for the one-compartment model are not significantly different from those for the two-compartment model (Table 4). The statistical analysis of the DVs for the one- and two-compartment models also shows the same result in terms of whether DVs between the two groups of rats are significantly different. This comparison between the one-compartment model and the two-compartment model indicates that when the DV is the physiologic parameter, the DV for a onecompartment model is sufficiently identifiable for the acquired data. In this work, because we used the DVs as a metric to evaluate heart function, we chose the one-compartment model to fit the myocardium TACs. The DVs mentioned hereafter were from a one-compartment model. Figure 3C shows the mean DV for each group in each imaging study. The two-way ANOVA with repeated measures showed that the DV of 123I-MIBG in the LV myocardium in the SHR group was significantly higher than that in the WKY group (p = .0028). The changes in the DV of 123I-MIBG with age were significant (p = .0002). The interaction effect of group and age was significant with a p value of .0015. The Kruskal-Wallis test for each imaging study showed that the DV of 123I-MIBG in the SHR group began to be significantly larger than that in the WKY group in imaging study I at the age of 6 months (p = .0017). The larger DV of 123I-MIBG in the SHR group was also observed in all of the following imaging studies (p = .025 for study II at the age of 11 to 12 months, p = .025 for study III at the age of 18 months, and p = .0495 for study IV at the age of 21–22 months).

Examples of the fits for one myocardium time-activity curve (TAC) of 123I-MIBG (A) using a one-compartment model and a two-compartment model and the fit for one myocardium TAC of 201Tl (B) using a two-compartment model.
Heart to Body Weight Ratio of Each Rat
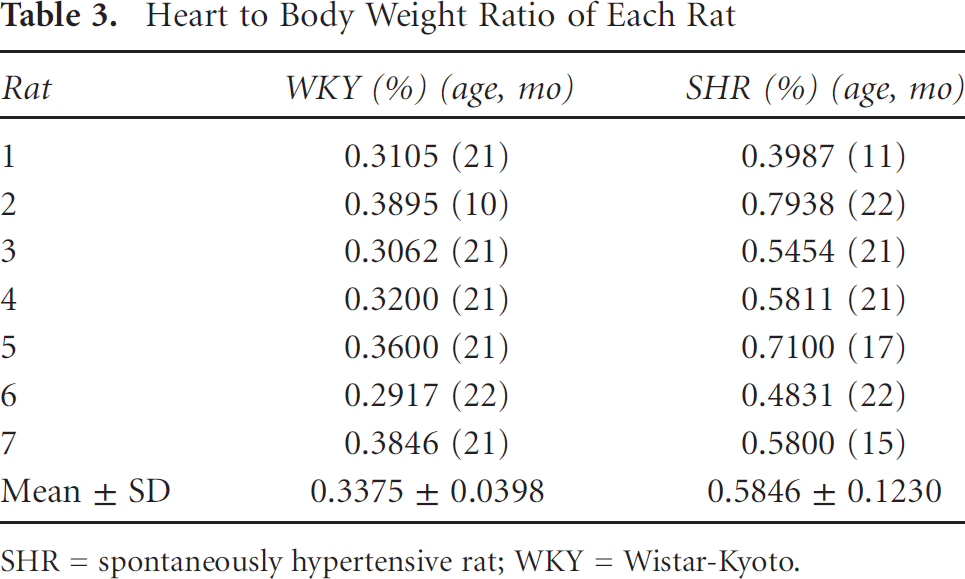
SHR = spontaneously hypertensive rat; WKY = Wistar-Kyoto.
Means of DV in Each Study from the One-Compartment and Two-Compartment Models

DV = distribution volume; SHR = spontaneously hypertensive rat; WKY = Wistar-Kyoto.
Volume Fraction of 123I-MIBG
The volume fraction represents the fraction of the vasculature space in the measured tissue and contamination of spill-in from blood exterior to the tissue being measured. The two-way ANOVA shows that the volume fraction in SHR was significantly higher than that in the WKY rats (p = .0028), which may indicate the changes in heart volume in SHRs. The change in volume fraction over age was also significant (p < .0001). The volume fraction in SHRs decreased from imaging study I to imaging study III and then increased from imaging study III to imaging study IV. The volume fraction in WKY rats decreased from imaging study I to imaging study IV. In each imaging study, the volume fraction in SHRs was larger than that in WKY rats (p = .0017 for imaging study I, p = .0163 for imaging study II, and p = .0495 for study IV), except for imaging study III (p = .4561).
SUV of 123I-MIBG in the LV Myocardium
The mean SUVs of 123I-MIBG for each group in each imaging study are shown in Figure 3D. The results of the two-way ANOVA test with repeated measures showed that there was no significant difference between the WKY group and the SHR group (p = .20). The SUV decreased with age from imaging study I at the age of 6 months to imaging study IV at the age of 21 to 22 months (p = .0001). The interaction effect of group and age was not significant (p = .68). The Kruskal-Wallis test results for each imaging study showed that the mean SUV in the WKY group and the SHR group exhibited significant difference in study III at the age of 18 months (p = .03) and study IV at the age of 21 to 22 months (p = .05).
Influx Rate of 201Tl into the LV Myocardium
The influx rate of 201Tl correlates with myocardial blood flow. Figure 3E shows the mean influx rate of each group for each imaging study. The two-way ANOVA with repeated measures showed that there was no significant difference between the WKY group and the SHR group (p = .24). The influx rate did not significantly change with age (p = .64). The interaction effect of group and age was not significant (p = .56). The Kruskal-Wallis test for each imaging study showed that the influx rate of 201Tl at each imaging time point did not show a significant difference between the WKY group and the SHR group (p = .51, p = .77, p = .29, and p = .83, respectively).
Washout Rate of 201Tl from LV Myocardium to Blood Pool
The washout rate of 201Tl reflects the transition ability of 201Tl from LV myocardium to LV blood pool. Figure 3F shows the mean washout rate of 201Tl of each group for each imaging study. The two-way ANOVA with repeated measures showed that there was no significant difference between the WKY group and the SHR group (p = .28). The change in the washout rate over ages was also not significant (p = .56). The interaction effect between group and age was not significant (p = .45). For each imaging time point, the difference between the WKY group and the SHR group was not significant (p = .28, p = .39, p = .48, and p = .83).
Volume Fraction of 201Tl
The volume fraction of 201Tl in SHRs did not show a difference from that in WKY rats according to the two-way ANOVA (p = .06). The change in the volume fraction over age was also not obvious (p = .81). In each imaging study, the difference in volume fraction between SHRs and WKY rats was also not significant (p = .28, p = .77, p = .48, and p = .51, respectively).
DV of 201Tl in the LV Myocardium
The DV reflects the retention of 201Tl in the extravascular tissue of the myocardium. Figure 4B shows an example of the fitting results of the myocardium TACs for 201Tl. The mean DV in each group in each imaging study is shown in Figure 3G. The two-way ANOVA with repeated measures indicated that the DV of 201Tl between WKY rats and SHRs was not significant (p = .57). The change in DV with age was not significant (p = .22). The interaction effect of group and age was not significant (p = .33). The Kruskal-Wallis test results for each imaging study showed that the difference in DV between the WKY group and the SHR group at each imaging time point became significant in and after imaging study III (p = .034 for study III at the age of 18 months and p = .0495 for study IV at the age of 21–22 months).
SUV of 201Tl in the LV Myocardium
The mean SUV of 201Tl calculated from the static SPECT image is shown in Figure 3H. The two-way ANOVA with repeated measures showed that there was no significant difference between the mean SUV of 201Tl in the WKY group and the mean SUV of 201Tl in the SHR group (p = .13). The mean SUV first increased and then decreased with age (p < .0001). The interaction effect of group and age was significant (p = .026). The Kruskal-Wallis test in each imaging study indicated that the SUV of the SHR group was not significantly different from the WKY group in all imaging studies (p = .13 for study I at the age of 6 months, p = .08 for study II at the age of 11–12 months, p = .15 for study III at the age of 18 months, and p = .51 for study IV at the age of 21–22 months).
Discussion
The goal of this work was to longitudinally evaluate the sympathetic nervous system function and blood perfusion during the progression of LVH to heart failure in the SHR, with the hope that an imaging procedure could be developed for early detection of abnormality during progression to heart failure before irreversible alteration in structure. The assessment using two radiotracers with dynamic SPECT provided insightful information reflecting the pathophysiology of the progression of LVH to eventual heart failure in the SHR as well as detecting cardiac abnormalities at an early stage of LVH.
201Tl is a perfusion imaging agent. The influx rate of 201Tl from the LV blood pool into the myocardium extravascular tissue is a function of blood flow and tissue extraction fraction. The influx rate of 201Tl in the WKY group and the SHR group did not exhibit differences, indicating that there was no significant infarction or ischemia in the SHRs. 23 The DV of 201Tl in the SHR group was significantly greater than that in the WKY group in imaging study III (p = .0335) and IV (p = .0495). This may imply that 201Tl imaging could see changes due to LVH beginning at the age of 18 months. The SUV of 201Tl in SHRs did not show a significant difference between the WKY rats and SHRs in any of the four imaging studies. The SUV of 201Tl increased from imaging study I (at age of 6 months) to imaging study II (at age of 12 months) and then decreased from imaging study I to imaging study IV (at age of 21–22 months), whereas the increase in DV of 201Tl with the increase in age was not significant (p = .22).
123I-MIBG shares an uptake, storage, and release mechanism similar to that of norepinephrine in the adrenergic nerve terminals. 123I-MIBG is removed from the synapse through two pathways, uptake-1 and uptake-2.7,38 Through uptake-1 (neuronal uptake), 123I-MIBG is taken up by the presynaptic nerve terminal cells, whereas uptake-2 involves extraneuronal uptake, through which 123I-MIBG is taken up by nonneuronal postsynaptic cells. 39 Both uptake-1 and uptake-2 contribute to the uptake of 123I-MIBG in the rat heart19,20; however, their roles in the abnormal uptake of 123I-MIBG in the progression of heart failure remain unclear. The uptake-1 mechanism reflects the sympathetic nervous system function, whose function is regarded as an important aspect in the progression of heart failure.11,12
Recently, the uptake-2 mechanism was also reported to be involved in the progression of heart failure. 1 Studies in mice have indicated that the OCT3 (organic cation transporter) is the principal component for cardiac uptake-2, the abnormal expression of which could also have influence in heart failure, 40 although more validations are required. These studies imply that 123I-MIBG may not be appropriate in rat heart imaging for the assessment of sympathetic nervous activity. However, as reported in DeGrado and colleagues, 7 when the uptake-2 mechanism was inhibited in rats, the washout rate did not show any significant changes, which means that through the remaining uptake-1 mechanism, neuronal uptake is secure and thus has a slow clearance rate and long retention time.7,38 On the other hand, when uptake-1 was inhibited, the washout rate increased fivefold, and the DV reduced by 88%, which means that the portion of 123I-MIBG taken by the nonneuronal postsynaptic cells through uptake-2 has a fast clearance rate and a short retention time.
This is consistent with the results in our study where the DVs of 123I-MIBG in SHRs were greater than those in WKY rats, which implies that the change in 123I-MIBG uptake in SHRs mainly results from changes in uptake-1. In the SHRs, uptake-1 is enhanced; therefore, the rats show a longer retention of MIBG. Another observation is that the washout of 123I-MIBG in SHRs did not show significant variation from that in WKY rats. The unchanged washout rate in SHRs indicates that the change in 123I-MIBG uptake in SHRs (observed through the parameter DV) should not result from changes in uptake-2 (nonneuronal uptake); otherwise, the dominant and enhanced uptake-2 would show fast washout in SHRs. The two observations in our study show that although both the uptake-1 and the uptake-2 mechanisms are involved in the progression of heart failure in rats, the uptake-1 mechanism has the major influence.
In SHRs, the sympathetic nervous activity is enhanced in order to preserve the cardiac output. Some studies have shown that the reuptake of norepinephrine increased41,42 or remained unchanged in SHRs compared to WKY rats. 43 Both the unchanged and increased function of the norepinephrine transporter (NET) could be the possible reason for the unchanged washout rate and the larger DV of 123I-MIBG in SHRs in study I (6 months) and study II (11–12 months) because otherwise the decreased function of NET may have consequences of a higher washout rate and a smaller DV. This is consistent with the uptake and retention of 201Tl in SHR showing no significant abnormality via the influx rate and DV of 201Tl in SHRs and WKY rats in study I and study II. The unchanged uptake and retention of 201Tl indicate that the LV did not show any structural abnormality at the age of 12 months. With the development of heart failure in SHRs, the long stimulation of norepinephrine to the NET impairs the NET sites. In our study, three SHRs died naturally before the final euthanasia. Rat 1 died before study II, and rats 5 and 7 died before study III. Their DVs in the last imaging study before death were all relatively smaller than other rats in the same group. The DV of rat 1 in study I was 2.3235, which was much smaller than the mean DV of other rats in study I (DV = 3.2268 ± 0.3999). The mean DV of rats 5 and 7 in study II was 2.1488, which was also much smaller than the mean of other rats in study II (DV = 2.6848 ± 0.3529). The results conformed to an impaired NET in the late stage of heart failure.
Another change in SHRs is the decreased capillary density during the development of heart failure in SHRs. Engelmann and colleagues found that the capillary density in the LV of SHRs showed a drastic decline from 6 months of age and remained lower than that of the age-matched WKY rats up to 18 months. 44 The lower capillary density increased the diffusion distance, decreasing the outflow of 123I-MIBG to plasma, which could be the reason for the larger DV of MIBG in SHRs than in WKY rats in study III (at age 18 months) and study IV (at age 21–22 months). This is also identified by the larger DV of Tl in SHRs than that in WKY rats in study III. The SUV of 123I-MIBG studies did not show any abnormality between SHRs and WKY rats according to the two-way ANOVA test with repeated measures. However, the SUV 123I-MIBG in study III (at age 18 months) and study IV (at age 21–22 months) showed a significant difference between the SHRs and WKY rats (p = .0253 for study III, p = .0495 for study IV). The marginal result in study IV is probably due to the small sample size (n = 3 for each group), which is one of the limitations of this work.
The above observations of MIBG and Tl studies have also been confirmed via heart to body weight ratios. With the increase in age, the body weight of the rats increased in the normotensive WKY rats, whereas the body weight in the SHRs increased until they became sick, at which time, it decreased. The heart to body weight ratio also increased with age. At a young age (10–11 months), the heart to body weight ratio of the SHR (rat 1 with a ratio of 0.3987%) was almost the same as that for the WKY rat (rat 2 with a ratio of 0.3895%). However, when the rats grew to an age of 21 to 22 months, the heart to body weight ratio of the SHR was significantly greater than that of the WKY rat. The result indicated that the hypertrophied heart in SHRs becomes heavier during the progression of LVH, which is in accordance with that reported by other authors.3,45
In summary, we found that the earliest stage when dynamic SPECT with 123I-MIBG can detect an abnormality in the LV of SHRs is at 6 months. Dynamic SPECT with 201Tl can detect perfusion abnormalities in the LV of SHRs at 18 months. Static SPECT with 123I-MIBG can detect abnormalities in the LV of SHRs at 18 months. Static SPECT with 201Tl cannot detect abnormalities in the LV of SHRs. The time of appearance of a significant difference for each metric is shown in Table 5.
Appearance Time of the Significant Difference between the SHR Group and the WKY Group for Every Metric

DV = distribution volume; SUV = standardized uptake value.
Significant difference between the two groups.
Limitations
The main limitation of this study was the small sample size, which decreased as rats died over the course of the study, with only three animals remaining in each group at the final time point. Since this was a longitudinal study, it was difficult to keep some of the sick SHRs alive for our goal of a 2-year study. In future studies, one would want to have more SHRs in the cohort of animals.
Histologic data were limited to measuring only heart to body weight ratios as a measure of cardiac hypertrophy, as previously done in other studies. 46 Measures of heart size and LV wall thickness from the images or using echocardiography to measure function could have provided additional information that would have strengthened our study. In another article published by our group, we reported significant changes in deformation due to hypertrophy in a study of a separate cohort of SHR and WKY rats. 47
We did model the point response of the pinhole collimator. This compensates for some of the partial volume effect; however, this does not provide a perfect correction. As the heart becomes larger in the SHRs, the partial volume becomes less of an effect and the accuracy in the SHR parameters is expected to improve. Some of the changes will be compensated for in our modeling for the volume fraction of blood in the myocardial tissue curves, which is usually much greater than the expected 5% because of partial volume and scatter effects.
In addition, we did not quantify the free iodine due to radiolysis that was taken up in other organs. Even though we did observe 123I uptake in the thyroid region, we do not feel that this affected our kinetic analysis of 123I-MIBG in the heart, which relied on measuring rate parameters. However, it may have had a small effect in calculating the SUV because the degree of radiolysis might not have been the same for all of the animals or for different times during the evaluation of each animal. This is something that needs to be studied more closely in future studies.
Finally, we did not correct for attenuation and scatter, which we and others 48 have observed to be a small effect in small animals. Also, extracting the blood input function from a dynamic study using rats with a recirculation time of 6 to 8 seconds can be a challenge when acquiring the data using a slowly rotating camera. However, our methods 32 have been optimized to obtain the very best results in this very difficult data processing task.
Conclusion
In this work, we evaluated abnormal changes in the LV myocardium during the progression of LVH to heart failure in the SHR model using dynamic pinhole SPECT imaging of 123I-MIBG and 201Tl. The longitudinal evaluation allowed us to study dynamic changes during the progression of LVH. There was a significant elevation of the DV of 123I-MIBG in 6-month-old SHRs before abnormalities in perfusion (larger DV of 201Tl) in SHRs at 18 months, which implies that a sympathetic nervous system abnormality can be detected earlier than structural alterations in the progression of LVH, providing an earlier diagnostic metric for LVH. The comparison between DV and SUV indicates that dynamic SPECT may be able to detect earlier abnormalities of LVH than static SPECT.
Footnotes
Acknowledgments
We want to thank Rod Gullberg of Clearview Statistical Consulting for his assistance with the statistical analyses. We also want to thank Kathleen Brennan for assisting with the animal studies and Stephen Hanrahan for preparing the 123I-MIBG vials for injection.
Financial disclosure of authors: This study was supported by the National Science Foundation of China (Nos. 81201114, 81271610, and 91330102); the National Institutes of Health of the U.S. Department of Health and Human Services under grant R01-EB007219; and the Director, Office of Science, Office of Biological and Environmental Research of the U.S. Department of Energy under contract DE-AC02-05CH11231.
Financial disclosure of reviewers: None reported.