
Abstract
Xenograft tumor models are widely studied in cancer research. Our aim was to establish and apply a model for aggressive CD20-positive B-cell non-Hodgkin lymphomas, enabling us to monitor tumor growth and shrinkage in a noninvasive manner. By stably transfecting a luciferase expression vector, we created two bioluminescent human non-Hodgkin lymphoma cell lines, Jeko1(luci) and OCI-Ly3(luci), that are CD20 positive, a prerequisite to studying rituximab, a chimeric anti-CD20 antibody. To investigate the therapy response in vivo, we established a disseminated xenograft tumor model injecting these cell lines in NOD/SCID mice. We observed a close correlation of bioluminescence intensity and tumor burden, allowing us to monitor therapy response in the living animal. Cyclophosphamide reduced tumor burden in mice injected with either cell line in a dose-dependent manner. Rituximab alone was effective in OCI-Ly3(luci)-injected mice and acted additively in combination with cyclophosphamide. In contrast, it improved the therapeutic outcome of Jeko1(luci)-injected mice only in combination with cyclophosphamide. We conclude that well-established bioluminescence imaging is a valuable tool in disseminated xenograft tumor models. Our model can be translated to other cell lines and used to examine new therapeutic agents and schedules.
NON-HODGKIN LYMPHOMAS (NHLs) are one of the most common hematologic malignancies and represent approximately 3 to 4% of all cancer cases. 1 Recent clinical trials revealed that combinations of a conventional cytotoxic chemotherapy regimen and rituximab (Rx) immunotherapy resulted in considerable improvement in therapy outcomes for CD20+ B-cell lymphoma.2,3 However, optimal dosing and timing schedules of the components of immunochemotherapy are largely unknown and possibly dependent on tumor subentities. Since well-defined measures of tumor control are lacking for humans treated in the framework of clinical trials, it is important to study and compare the effectiveness of different immunochemotherapy regimens in preclinical models.
Rx is a chimeric mouse/human anti-CD20 monoclonal antibody (mAb).4,5 It consists of murine light- and heavy-chain variable regions and human gamma-1 heavy-chain constant regions. The surface marker CD20 is an excellent target for antibody therapy because there is no significant antibody shedding or internalization of CD20 after binding to the specific antibody. 5 The discussed mechanisms of action are antibody-dependent cytotoxicity (ADCC), complement-dependent cytotoxicity (CDC), cell cycle arrest, apoptosis, 6 and the potential of Rx to sensitize cells to further chemo- and immunotherapy. 7 It is of note that Rx can also sensitize chemoresistant tumor cells to chemotherapy through inhibition of p38 mitogen-activated protein kinase, nuclear factor κB, extracellular signal–regulated kinase 1/2, and AKT antiapoptotic survival pathways. This results in downregulation of antiapoptotic gene products such as Bcl-2, Bcl-xL, and Mcl-1. As further mechanisms, it is discussed that Rx-induced growth inhibition may be mediated through a ceramide-triggered pathway 8 and that accumulation of CD20 in lipid rafts of the plasma membrane may lead to an apoptotic signal. 9
The mechanism of resistance against Rx treatment is not fully understood. An obvious possibility for Rx resistance may be the modulation of CD20 expression and circulating CD20. 10 Bonavida suggests that a failure of Rx to alter survival signaling pathways in tumor cells causes resistance. 11
Preclinical models of cancer are a valuable approach to evaluate the efficacy of drugs. In the past, subcutaneous tumor models were established.12–14 However, these models do not mirror human lymphoma adequately because lymphomas are typically disseminated in humans. Therefore, a disseminated xenograft tumor model would be more appropriate to study chemotherapy effects in a preclinical model. Thus, the NOD/SCID mouse is a preferable strain.15,16 This mouse strain supports the engraftment of human cancer cell lines better than SCID, nude, and Rag-1-deficient mice. 17 It was recently shown that it is possible to create a disseminated tumor model of NHL in NOD/SCID by injecting tumor cells intravenously, 18 although disseminated tumor models are described in other mouse strains. 19 One can expect that insights from chemo- and immunotherapy of this model can be better translated to the human situation compared to models based on subcutaneous tumors.
However, a major challenge is to perform repeated measurements of the tumor load in the same individual to monitor treatment response. In this work, we implemented bioluminescence imaging (BLI) to assess overall tumor burden in the living animals. The aim was to evaluate time series data of tumor load in animals injected with two different aggressive B-cell lymphoma lines and treated with combinations of chemo- and immunotherapy.
To validate BLI-based assessments, we correlated them to already established “gold standards” of measuring tumor load, that is, flow cytometric measurement of human cells in the animals. After establishing the model, we treated the animals with different schedules of Rx monotherapy, cyclophosphamide (CP) monotherapy, and combinations of both. The outcomes demonstrate the suitability of the model.
Material and Methods
Animals and Cell Lines
NOD/SCID mice of both sexes were housed under specific pathogen-free conditions in individually ventilated cages. Animal experiments followed national guidelines and were approved by the local animal protection committee. Two different cell lines were used: Jeko1 (mantle cell lymphoma; see ACC 553, German Collection of Microorganisms and Cell Cultures [DSMZ]), and OCI-Ly3 (diffuse large B-cell lymphoma; see ACC 761, DSMZ). All cells were cultivated with RPMI 1640 medium supplemented with 10% fetal calf serum (FCS), 100 U/mL penicillin, and 100 μg/mL streptomycin (PAA, Cölbe, Germany) at 37°C in a humidified atmosphere of 5% CO2 in air, and supplemented medium was partially replaced three times per week.
Stable Transfection of Lymphoma Cell Lines
For electroporation of OCI-Ly3 cells, we used a commercially available transfection system: the Neon Transfection System (Invitrogen, Karlsruhe, Germany). The cell line Jeko1 was transfected by electroporation using Nucleofector Amaxa (Lonza, Cologne, Germany) according to the manufacturer's instructions and commercially available transfection instruments (Nucleofector Amaxa). The plasmid pGL 4.50[luc2/CMV/Hygro] (Promega, Mannheim, Germany) was used for detection of tumor cells in vivo. The plasmid harbors the luc2 gene, a modified form of the firefly luciferase gene for expression in mammalian cells, under control of the cytomegalovirus promotor as well as a hygromycin resistance. After transfection, we cultivated the cells with RPMI 1640, 10% FCS, and 150 μg/mL hygromycin to select luciferase-expressing cells, generating OCI-Ly3(luci) and Jeko1(luci) cells. Hygromycin treatment was continued until 1 week before injection. Then the medium was changed to RPMI 1640 supplemented with 10% FCS and penicillin/streptomycin.
In Vitro Bioluminescence Assays of Living Cells
Prior to in vitro experiments, we determined viability by counting living and dead cells via trypan blue staining in a Neubauer counting chamber. For testing the luminescence intensity of luciferase-expressing tumor cells in vitro, an intact cell assay was performed with a dilution series of living cells from 1 million to 61 cells in phosphate-buffered saline (PBS) + 5% FCS and 10 μL per well of a 600 μg/mL solution of d-luciferin (Beetle Luciferin Potassium Salt, Promega) in PBS. Imaging was done immediately after injecting d-luciferin with a multichannel pipette into black 96-well plates using only every second well to prevent light contamination between wells.
Injection of Cells in NOD/SCID Mice
Mice were intravenously injected with 107 tumor cells in 100 μL preconditioned cell culture medium (RPMI 1640 with 10% FCS) at the age of 8 to 12 weeks. For stable engraftment of tumor cells, viability of cells was detected by trypan blue staining and a LIVE/DEAD Fixable Green Dead Cell Stain Kit (Invitrogen) before injection to ensure the viability of injected cells.
In Vivo BLI
For BLI, mice were injected intraperitoneally with 150 mg/kg d-luciferin (Promega) in PBS (15 mg/mL) and then placed into an anesthesia induction chamber with 3% isoflurane in oxygen for inducing anesthesia. After 11 minutes, dorsal and ventral bioluminescent images were taken by a cooled charge-coupled device camera with 2,048 × 2,048 pixels in a light-tight chamber. An overlay image with a white-light image was made for anatomic orientation. The values used for field of view, binning, and f/stop were 12.5 cm, 4 and 1 (open aperture, f/stop = 1), respectively. Exposure time was adjusted between 10 and 120 seconds to reach the recommended number of counts (600 to 60,000 counts). In general, imaging was performed in three animals simultaneously. In case of high-bioluminescence signal levels, single animals were imaged to avoid light contamination. Anesthesia was applied for the duration of imaging using 2% isoflurane in oxygen. Images were analyzed using Living Image 3.2 software (Caliper Life Sciences, Mainz, Germany) by drawing a region of interest over the animal and using photons per second as the unit. As a final outcome, resulting light values of dorsal and ventral images were summed up for each individual.
Establishment of the Animal Model
To compare BLI to invasive tumor cell detection, we measured tumor cells by flow cytometry (huCD45+/huCD19+/huCD20+) and counted cells of blood, spleen, bone marrow, and brain. Based on these data, a total tumor burden per animal was estimated using the following formula: tumor burden [whole body] = (huCD45 in blood [%]/100 × total blood leukocytes) + (huCD45 in spleen [%]/100 × total cells in spleen) + (huCD45 in bone marrow [%]/100 × total cells in bone marrow) + (huCD45 in brain [%]/100 × total cells in brain). Later, estimated invasively measured tumor burden was compared to the results of BLI from dorsal and ventral ROI.
For Jeko1 or Jeko1(luci), we sacrificed mice after BLI on days 7, 14, 21, and 28 (n = 5) and collected blood, spleen, bone marrow, and brain. In the fifth week, the nine remaining mice were also bioluminescence imaged and sacrificed due to bad general conditions and weight loss. Similarly, for OCI-Ly3 or OCI-Ly3(luci), mice were sacrificed on days 7, 14, and 21 (again n = 5 for each time point).
Determination of Tumor Burden by Flow Cytometry
Blood was collected from the lateral tail vein with heparinized capillary tubes. Afterwards, mice were sacrificed by cervical dislocation. Cells from the bone marrow of femoral and tibial bone were collected by flushing the bone with RPMI medium using a 10 mL single-use syringe (B. Braun, Melsungen, Germany) and filtering the obtained suspension through a 70 μm nylon cell strainer (BD Biosciences, Heidelberg, Germany). Spleen and brain were similarly treated by filtering the mechanically homogenized organs with a cell strainer. Thereafter, cell suspensions were centrifuged in a 50 mL tube at 250g for 10 minutes, and cell pellets were resuspended in 5 mL of PBS. Suspensions were used for fluorescence-activated cell sorting (FACS) analysis after cell count determination with Turks solution using a Neubauer counting chamber. Cell suspension and Turk solution were mixed in equal shares for 5 minutes. For detection of cell-surface antigens, 1 μL mouse seroblockFcR (AbD Serotec) was mixed with 100 μL (106 cells) single cell suspension and incubated at room temperature for 10 minutes. Subsequently, an appropriate mixture of fluorescently labeled mAbs (antihuman CD19 phycoerythrin [PE]-labeled mAb, antihuman CD45 allophycocyanin [APC]-labeled mAb, antihuman CD20 V450-labeled mAb, all from BD Biosciences) was added and incubated for 30 minutes at room temperature in the dark. For blood samples, 1 mL BD FACS Lysing Solution (BD Biosciences) was added after 20 minutes. After washing twice, cell pellets were resuspended in 250 μL PBS and measured at a FACS Canto II. Data analysis was done with FACSDiva software (BD Biosciences). The human panleukocyte marker CD45 excludes all murine cells for analysis of tumor cells; huCD19 marks B cells and, in this case, human NHL cells. HuCD20 served as a therapeutic target for Rx.
Histologic Examination
After removal, one half of each spleen and brain and one skinned hindlimb were fixed in 4% buffered formalin for 24 hours. The time between death and fixation was 30 minutes on average, never exceeding 1 hour. In our experience, this variation has no impact on the histologic outcomes. For histomorphologic examination, cross sections of each spleen and brain were embedded in Paraplast (Leica Biosystems, Wetzlar, Germany), sectioned at 3 to 4 μm, and stained with hematoxylin and eosin. To provide a histologic investigation of the bone and bone marrow, hindlimbs were dissected longitudinally and decalcified in OSTEOSOFT (Merck Millipore, Darmstadt, Germany) for 3 days. Afterwards, bone, including bone marrow, was embedded, sectioned, and stained in the same way as it was done for brain and spleen. The histomorphologic investigation was carried out by a veterinary pathologist. In this context, the appearance of tumor cells and extent of their infiltration (mild, moderate, strong) within the specimens were of particular interest.
Studying Therapy Effects in the Animal Model
After establishing BLI as a surrogate marker of tumor load, we performed experiments with CP and Rx alone and in combination to assess the effects of dosing and timing and the interaction of chemo- and immunotherapy for both cell lines. Experimental schedules are presented in Table 1. Whereas CP was injected intraperitoneally, Rx was injected into the lateral tail vein.
Treatment Schedule for Animal Experiments

CP = cyclophosphamide; RX = rituximab; S1 = CP treatment on days 0, 4, and 8; S2 = CP treatment on days 0, 2, and 4. n = 4–6.
BLI was performed on day 4 before treatment, day 0 (day of treatment), and days 2, 4, 6, 8, 10, 14, 16, and 20 after treatment (Figure 1). The start of therapy was 14 days after tumor cell injection in Jeko1(luci)-injected mice and 7 days after injection in OCI-Ly3(luci)-injected ones.

Schedule of therapy experiments. After injection of luciferase-transfected tumor cells into the tail vein of NOD/SCID mice, cyclophosphamide (CP) at four dose levels (50/100/150/200 mg/kg) was applied three times, on days 0, 4, and 8, or in an intensive scheme on days 0, 2, and 4 with or without rituximab (Rx). Rx was applied once at day 0 at a dose of 25 mg/kg in combination with CP or at doses of 25 or 50 mg/kg as a single agent. Whole body bioluminescence imaging (BLI) was performed for the specified time points.
Statistical Analysis
To establish noninvasive assessments of tumor load, the correlation between invasively measured tumor load and noninvasive BLI measurements in untreated mice was analyzed. For this purpose, we determined these values at days 7, 14, 21, 28, and 35 for Jeko1(luci) and at days 7, 14, and 21 for OCI-Ly3(luci) and calculated Spearman correlation coefficients.
To estimate the efficacy of immunochemotherapeutic regimens, we calculated the area under the curve (AUC) of logarithmized BLI measurements as the primary outcome of treatment schedules (see Figure 2 as an example). The aim was to simplify comparisons of therapies by introducing a single variable that measures therapy efficacy. To achieve this, one retrieves more informative and reliable results on integrating the therapeutic response over time instead of looking at single time points only, which may be far more affected by individual or technical outliers. We started to calculate the AUC at day 0. To exclude direct interference with therapy, we also analyzed the AUC starting at day 12 with similar results (not shown). The effects of dosing and timing of CP, effects of Rx treatment, and interaction of CP and Rx were assessed by multivariate linear regression models, separately for Jeko1(luci) and OCI-Ly3(luci). Since initial tumor load is highly correlated with AUC, we adjusted AUC for this confounder throughout. The statistical software R (<http://www.r-project.org>) was used for all data analyses.

Evaluating therapy response by comparing area under the curve (AUC) values of light intensities. As an example, we present the data of Jeko1(luci)-injected mice treated with cyclophosphamide (CP) alone. The means of bioluminescence imaging data are shown for different time points after being treated with CP applying either 50, 100, or 150 mg/kg. The AUC is calculated for each mouse between time points 0 days and 20 days after the start of CP treatment. These values served as primary therapy outcomes and were compared between schedules.
Results
Luminescence Intensity Increases with Cell Count
To monitor tumor growth and therapy outcome in our preclinical model, we generated two B-cell lymphoma cell lines stably expressing luciferase. To evaluate the correlation between photon flux and cell count of these cells, we performed in vitro measurements of transfected cells in a 96-well plate at the Xenogen IVIS. For OCI-Ly3(luci), correlation coefficient was R = .99 (p = .0001). For Jeko1(luci), the correlation coefficient was R = .94 (p = .016). Figure 3 shows cell concentrations and photon flux for both cell lines. This experiment was performed after 3 months of hygromycin selection.

Correlation between cell counts and light signals. Measurements were performed in a 96-well plate immediately after adding 10 μL d-luciferin (600 μg/mL) per well with a multichannel pipette. Wells contained different cell concentrations ranging from 1 million to 61 cells per well. Analysis was done by drawing a region of interest around each cell-containing well using Living Image software.
Transfected and Original Cell Lines Exhibit Similar Characteristics
For our studies, it is important that the stably transfected cell lines retain critical characteristics of the parental cell lines. Hence, we compared growth kinetics of parental and transfected cell lines by assessing tumor growth in vivo. No significant differences were observed.
We also measured CD20 expression by flow cytometry in cells from cell culture and from single cell suspensions from different organs. This is important for studying Rx as a therapeutic antibody against this epitope. For OCI-Ly3, CD20 expression was detectable on 66 to 100% of CD19+ B cells from single cell suspensions and on 99% from cell culture. Likewise, OCI-Ly3(luci) showed CD20 expression in 80 to 100% of CD19+ tumor cells and those directly removed from cell culture flasks. Similar results were obtained for Jeko1 and Jeko1(luci), with percentages of CD20+ cells among tumor cells ranging between 90 and 100% in single cell suspensions for both the transfected and original cell lines except for five values under 90% (total N = 94) in the transfected group with only 51% CD20+ tumor cells as a minimum. In additional in vitro experiments, we found that the original cell lines Jeko1 and OCI-Ly3 have different proliferation characteristics after the addition of 4-hydroperoxycyclophosphamide (Figure S1, online version only).
Histologic Characterization of the In Vivo Model Shows Tumor Cell Infiltration in Examined Organs
Affected organs in human NHL comprise blood and spleen as part of the hematologic system, lymph nodes, bone marrow, and brain. We determined tumor burden in our mouse model on the basis of blood, spleen, bone marrow, and brain because swellings of lymph nodes were not observed in the animals. After injection of tumor cells into NOD/SCID mice, we eventually detected tumor cells in all of these organs. In some animals, other organs, such as ovaries or liver, were also affected, particularly if the overall tumor burden was high. For invasive assessment of overall tumor load, these organs were not taken into consideration.
In some cases, tumor cell infiltration could be detected not only in the bone marrow but also in the adjacent periosteum and skeletal muscles (Figure 4, A vs B and C). This finding might explain the frequently observed paralysis of hindlimbs in these animals. Moreover, in the central nervous system of a few animals, the meninges (Figure 5, A vs B) and, in some cases, the perivascular “Virchow-Robin space” were characterized by an infiltration of numerous tumor cells, whereas the adjacent gray and white matter were nearly unaffected.

Tibia with surrounding musculature of a healthy mouse compared to a tumor-bearing mouse. A, Tibia (unaffected): in the bone marrow, numerous cells of hematopoiesis (H) and some adipocytes (arrows) can be detected; C = compacta; EC = epiphyseal cartilage with area of calcification (arrowheads); M = musculature; P = periosteum (×4 original magnification). B, Tibia with lymphoma infiltration: next to cells of hematopoiesis (H), an area of necrosis (N) and several lymphatic tumor cells (arrows) are detectable in the bone marrow; between periosteum (P) and compacta (C), as well as in the adjacent musculature (M), numerous tumor cells (T) can be observed; EC = epiphyseal cartilage with an area of calcification (arrowheads) (×4 original magnification). C, Space between tibial periosteum (P) and tibial compacta: the space is filled with masses of lymphatic tumor cells, which show a high cellular pleomorphism, large nuclei (arrows), and sometimes multiple nucleoli as well as numerous mitoses (arrowheads) (hematoxylin-eosin staining, ×20 original magnification).

Observed effects of the central nervous system in a tumor-bearing mouse compared to a control animal. A, Central nervous system (unaffected): the pia mater (P) consists of a thin and well-vascularized connective tissue that covers the brain. Within the gray matter of the cerebral cortex (C), neurons (arrows), glia cells (arrowheads), and vessels (v) can be detected. Sometimes a discrete perivascular and perineuronal edema is detectable (#) (×10 original magnification). B, Central nervous system (affected): within and on the pia mater (P), numerous lymphatic tumor cells (T) can be detected, whereas the gray matter of the cerebral cortex is unaffected. Sometimes a discrete perivascular and perineuronal edema is detectable (#); neurons (arrows); glia cells (arrowheads); vessels (v) (hematoxylin-eosin staining, ×10 original magnification).
BLI Serves Well as a Surrogate Marker for Tumor Burden
To verify that BLI values can serve as noninvasive markers of tumor burden, we correlated weight-adjusted, invasively measured tumor burden with BLI signals in the plasma of untreated mice. We observed a close correlation between BLI data and tumor burden for both cell lines. In more detail, Jeko1(luci) tumor burden correlated with BLI with R = .71 (p < .001). For OCI-Ly3(luci), tumor burden correlated with BLI with R = .92 (p < .001) (Figure 6). These results indicate that BLI can serve as a noninvasive marker for tumor burden in a longitudinal experimental setting.
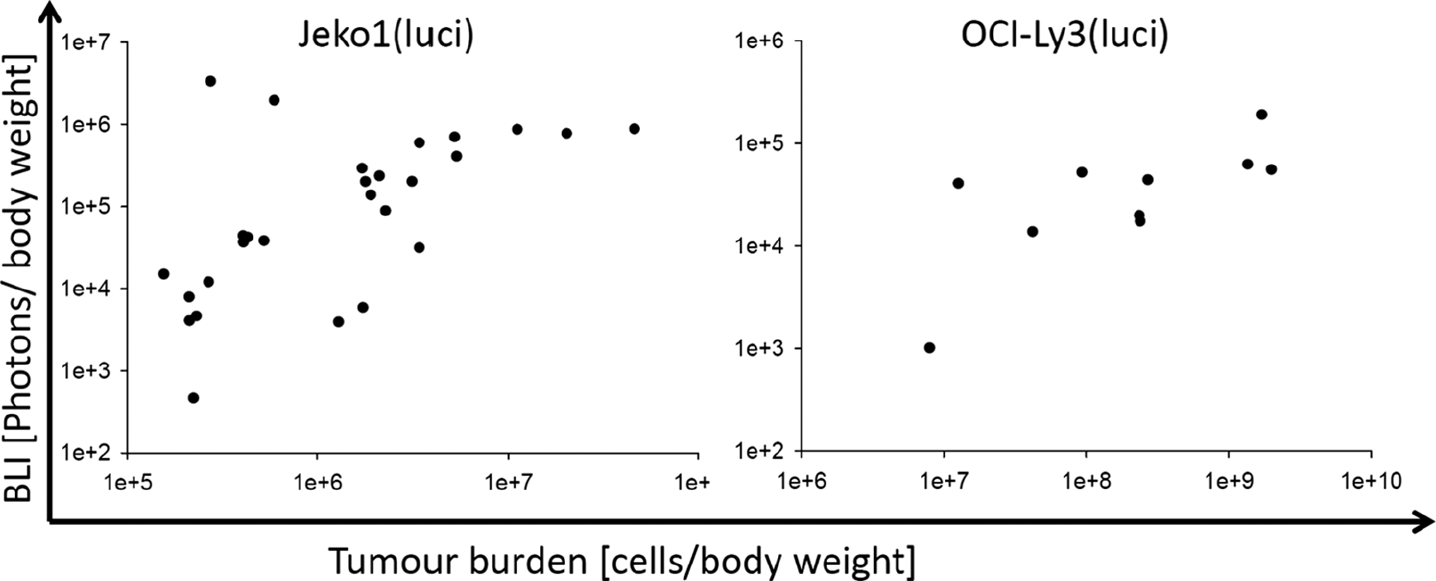
Correlation between invasively calculated tumor burden and bioluminescence imaging (BLI) measurement. BLI was performed to defined time points by injecting d-luciferin (Promega, Mannheim, Germany) intraperitoneally and bioluminescence intensity was measured with the IVIS system (Caliper Biosciences, Mainz Germany). Thereafter, blood was taken and animals were sacrificed by cervical dislocation. Blood and single cell suspensions from different organs were stained for flow cytometric analysis and total cell count was determined.
CP Reduces Tumor Burden in a Dose-Dependent Manner
We analyzed time series data of tumor burden under therapy with CP alone (for the experimental schedule, see Table 1, first part). The aim of this experiment was to determine the dose-dependent therapeutic effect of CP (Figure 7). Figure 8, A and C, illustrate our results. In both cell lines, CP-reduced tumor burden in a clearly dose-dependent manner (Jeko1(luci): p < .001; OCI-Ly3(luci): p < .001). According to preliminary in vitro experiments, Jeko1 cells are less sensitive to CP than OCI-Ly3 cells. Therefore, we adapted the CP dose for the treatments in vivo. After adjustment for initial tumor load, all chemotherapy groups performed significantly better than the control group except for Jeko1(luci)-injected mice treated with 50 mg/kg CP, where the difference to controls was not significant.

Performance of imaging in OCI-Ly3(luci)-injected mice. For anatomic orientation, overlay images are created. This measurement was done by injecting 150 mg/kg d-luciferin dissolved in phosphate-buffered saline (15 mg/mL) intraperitoneally into mice. After 11 minutes, bioluminescence imaging was performed with the Xenogen IVIS (f/stop = 1, binning = 4, time = 10 seconds). Images were analyzed with Living Image software. Mice treated with different dose levels of cyclophosphamide (A: 50 mg/kg; B: 100 mg/kg; C: 150 mg/kg) are shown. Dose-dependent therapy effects can be clearly detected.

Effects of different therapy schedules. These figures illustrate different therapy outcomes in terms of area under the curve (AUC) of bioluminescence imaging; AUCs were calculated from day 0 to day 20 and used for comparing therapy outcomes. The results of different therapy options are presented as box plots; boxes represent the 25th and 75th percentiles, and the line within each box represents the median of the therapy group. A (Jeko1(luci)) and C (OCI-Ly3(luci)) show AUC declines in a dose-dependent manner from the control group to the highest cyclophosphamide (CP) dose applied (asterisks represent p values of comparisons with the control group using the notation *p < .05, **p < .01, ***p < .001). In B and D, the results of CP time-intensified regimens (marked with an “i”) are shown (asterisks represent comparisons with corresponding nonintensified dose groups). In subfigures E and G, we present the results of rituximab (Rx) monotherapy. Although Rx alone is effective for OCI-Ly3(luci), no differences in the control group were observed for Jeko1(luci)-injected mice (asterisks represent comparison of the Rx dose groups with controls). Finally, subfigures F and H present the results of combined CP and Rx treatment. Both cell lines showed improved therapy outcome after combined Rx + CP compared to CP alone (asterisks represent comparisons of CP vs CP + Rx for corresponding dose levels of CP).
In contrast, time-intensified therapies did not perform significantly better for either cell line (Figure 8, B and D). Moreover, we observed a trend toward lower efficacy of time-intensified therapies for OCI-Ly3(luci), which was significant for 50 mg/kg.
Rx Alone Is Effective in OCI-Ly3(luci)-Injected Mice but Only in Combination with CP in Jeko1(luci)-Injected Mice
Rx alone was given once intravenously with two different doses. Jeko1(luci)-injected mice did not show any difference between control (AUC = 330 ± 7.6), 25 mg/kg (AUC = 331 ± 12.9), and 50 mg/kg (AUC = 331 ± 19.3) of Rx (Figure 8E). In contrast, BLI analysis of mice injected with OCI-Ly3(luci) showed a clear Rx effect, which, however, was independent of dose (p = .80 for comparison of dose groups; Figure 8G). Here mice of the control group had a higher bioluminescence signal (AUC = 445 ± 3.8) compared to mice treated with 25 mg/kg (AUC = 413 ± 13.9) and 50 mg/kg Rx (AUC = 414 ± 18.0).
Finally, we analyzed combinations of Rx and CP to evaluate potential synergistic effects of the two therapeutic drugs. We found no evidence of interaction of Rx and CP dose (p = .29 for interaction term in a multivariate linear model) in OCI-Ly3-injected mice; that is, CP and Rx appear to act additively. In consequence, Rx plus CP is significantly superior compared to CP alone (Figure 8H) and significantly superior to Rx alone (p = .0050 for 50 mg/kg CP and p < .001 for 100 mg/kg CP).
Although Rx alone showed no effect for Jeko1(luci), we observed an Rx effect in combination with CP; that is, Rx plus CP was significantly superior compared to CP alone (Figure 8F). However, no interaction with CP dose was observed (p = .62); that is, Rx acts additively as long as CP is applied.
Discussion
The main purpose of this work was to establish and apply an orthotopic tumor model for aggressive NHL to monitor chemotherapy effects in a noninvasive manner. First, we established BLI signals as a noninvasive measure of tumor burden. Second, we used the model to answer clinically relevant questions regarding CP and Rx effects and their interaction for two different lines of tumor cells, namely Jeko(luci) and OCI-Ly3(luci). We observed clear dose effects of CP but no effects of time intensification for both cell lines. Although Rx and CP are effective as single agents and act additively in combination for OCI-Ly3(luci), for Jeko1(luci), an effect of Rx is observed only in combination with CP.
A number of alternative animal models and ways of tumor quantification were studied in the literature: although studying tumor growth and therapy response using subcutaneously injected tumor cells is not representative of pathologic conditions in humans, this approach is widely used in cancer research due to the ease of measuring tumor growth via calipers.17,20,21 Other researchers use disseminated models and therefore have to develop alternative approaches of measuring tumor load. Lapalombella and colleagues used the period of time until hindleg paralysis as a parameter for therapy response.22,23 It appears questionable, however, whether this represents a sufficiently exact method for the evaluation of therapy effects. Another straightforward method for the assessment of therapeutic success is the use of median survival time. 24 This approach, however, does not meet the intention of the European Union for improved animal welfare in laboratory animals.
In our experiments, we used BLI for a longitudinal, noninvasive assessment of tumor load in a small animal model of cancer similar to the approach of Inoue and colleagues, who studied both gaussia and firefly luciferase–transfected cells. 25 In another study, correlation of tumor burden and BLI values was not verified prior to experiments. 26 To verify bioluminescence intensity is not correlated to apoptosis rather than to cell survival we performed additional in vitro experiments (Figure S2, online version only). In our opinion this is necessary because a high amount of apoptosis within the tumor site was reported to yield an augmented BLI signal without an increase in tumor burden. 27 Furthermore, the use of polyclonal luciferase-expressing populations of the original cell lines can lead to variations in the bioluminescence intensity. 28 In addition, bioluminescence intensity can be heterogeneous between cells depending on the insertion site of the luciferase gene. 29 We controlled for these problems by experimentally verifying the correlation of BLI intensity and tumor burden prior to our therapy studies.
Another reason for inaccuracies in bioluminescence intensity measurements could be the activity of constitutive promoters in cytomegalovirus-based vectors 30 and the fact that after treatment with a chemotherapeutic agent, the promoter activity can transiently increase. 31 Therefore, we decided to use AUCs as summary measures of therapy response. We calculated AUC between day 0 and day 20, including time points where chemotherapy was applied. For sensitivity analysis, we restricted AUC analysis to the time period of day 12 to day 20, when the short-term effects of the chemotherapy are no longer expected. This restriction did not change the outcomes of our study (not shown).
Alternative imaging techniques that can be used for assessing tumor burden comprise magnetic resonance imaging,32,33 computed tomography,34,35 positron emission tomography,36,37 and fluorescence imaging.38,39 Each technique has its own advantages and disadvantages. When working with luciferase-transfected cells, BLI is a fast, sensitive, and specific method to detect and quantify these cells in vivo. 40 In contrast to other imaging methods, it is possible to study several animals simultaneously. The duration of the measurement ranges from 1 second to 5 minutes and is therefore much faster than whole-body magnetic resonance imaging or computed tomography. Another advantage lies in the short half-life of the firefly luciferase protein of only 3 hours, 41 which prevents accumulation of the substrate in a close-meshed experimental schedule such as the one described here. In contrast, accumulation of the fluorescent agent represents a problem in the fluorescence imaging technique using a glucose analogue conjugated to a fluorophore as described by Kovar and colleagues. 39 Another advantage of BLI over fluorescence imaging is its higher sensitivity due to the lack of background signals.
After establishing our model, we studied the treatment effects of CP and Rx. The results of CP treatment alone revealed a clear dose effect for both cell lines, whereas there was no effect of CP timing. This observation is in agreement with the Skipper model of tumor growth and chemotherapy treatment, that is, an exponential tumor growth and a log-cell kill after each course of CP treatment. 42 If one additionally assumes that cure is impossible, this model explains the futility of time intensifications of CP in our model.
Another interesting finding of our study is the outcome of Jeko1(luci)-injected mice after Rx monotherapy and in combination with CP. In contrast to OCI-Ly3(luci), Rx alone has no effect in Jeko1(luci)-injected mice. This is plausible because the original cell line Jeko1 is resistant to Rx to a high extent. 21 Interestingly, however, for both cell lines, the combination therapy of Rx and CP is superior to CP treatment alone. The observation that Rx has an effect only in combination with CP for the Jeko1(luci) model may be explained by overcoming the Rx resistance of the tumor cells through sensitization via CP or improved chemosensitivity of cells under Rx. Overcoming chemoresistance by Rx is a well-known phenomenon.43,44 In turn, the sensitization of tumor cells by chemotherapy to Rx is not described in the literature to our knowledge.
Finally, we want to emphasize the outstanding performance of this orthotopic xenograft tumor model for NHL in comparison with subcutaneous or nonvalidated disseminated tumor models, which are either nonrepresentative and cannot depict the complex mechanism of the disease in humans or lack validation. The advantage of visible but difficult to measure tumor growth and shrinkage of subcutaneous tumor models is no longer apparent when BLI reports tumor burden without sacrificing animals. In our opinion, this clearly improves studying therapeutic responses or molecular mechanisms of tumor growth and development in animal models.
However, there is also one drawback of our model: Rx is known to act in cooperation with the immune system. Additionally, it is currently discussed whether the immune system is a major factor determining therapy outcome via controlling residual disease. 45 Main effector cells of the immune system against the tumor are cytotoxic T lymphocytes and natural killer cells. These cells have impaired function in the NOD/SCID mouse; therefore, our preclinical mouse model might not adequately address the mechanisms of immune action and corresponding Rx effects on the tumor. Further research is required to investigate this issue in more detail, for example, by adding human immune cells to our model.
A general important advantage of our model is its generalizability to other NHL lineages and other therapeutic options. such as newly developed therapeutic agents. Hence, we expect that our approach can be widely used to investigate therapy options in a preclinical phase, helping to select promising drugs and treatment schedules for clinical trials.
Footnotes
Acknowledgments
We would like to thank G. Alber for useful comments and discussion and M. Ackermann, M. Miessler, and S. Lehnert for technical support.
Financial disclosure of authors: M. Köberle was funded by a grant from the Federal Ministry of Education and Research of the Federal Republic of Germany (“Haematosys,” BMBF/PTJ0315452A). M. Scholz was funded by LIFE (Leipzig Research Center for Civilization Diseases, University of Leipzig). LIFE is funded by the European Union, the European Regional Development Fund, and the Free State of Saxony within the framework of the excellence initiative.
Financial disclosure of reviewers: None reported.