
Abstract
Recently, an apolipoprotein E–deficient (ApoE−/−) mouse model with a mutation (C1039G+/−) in the fibrillin-1 (Fbn1) gene (ApoE−/−Fbn1C1039G+/− mouse model) was developed showing vulnerable atherosclerotic plaques, prone to rupture, in contrast to the ApoE−/− mouse model, where mainly stable plaques are present. One indicator of plaque vulnerability is the level of macrophage infiltration. Therefore, this study aimed to measure and quantify in vivo the macrophage infiltration related to plaque development and progression. For this purpose, 5-weekly consecutive gold nanoparticle–enhanced micro–computed tomography (microCT) scans were acquired. Histology confirmed that the presence of contrast agent coincided with the presence of macrophages. Based on the microCT scans, regions of the artery wall with contrast agent present were calculated and visualized in three dimensions. From this information, the contrast-enhanced area and contrast-enhanced centerline length were calculated for the branches of the carotid bifurcation (common, external, and internal carotid arteries). Statistical analysis showed a more rapid development and a larger extent of plaques in the ApoE−/−Fbn1C1039G+/− compared to the ApoE−/− mice. Regional differences between the branches were also observable and quantifiable. We developed and applied a methodology based on gold particle–enhanced microCT to visualize the presence of macrophages in atherosclerotic plaques in vivo.
CARDIOVASCULAR DISEASE is the leading cause of morbidity and mortality in developed countries, 1 with atherosclerosis often being the underlying cause of myocardial infarction and stroke. Atherosclerosis is a slowly progressing chronic inflammatory disease of the medium-size and large arteries and is characterized by the development of atherosclerotic plaques. One of the major emerging clinical challenges is the need to differentiate between vulnerable plaques, which are likely to cause embolic stroke on rupture and thus need immediate treatment, and stable plaques, which do not cause an immediate threat. Traditionally, the apolipoprotein E–deficient (ApoE−/−) mouse model is the most popular mouse model to study atherosclerotic plaque at a preclinical stage.2–5 When fed a Western-type diet, these mice develop stable atherosclerotic plaques. Recently, ApoE−/−Fbn1C1039G+/− mice have been described as a novel mouse model for vulnerable plaques and plaque rupture.6,7 A heterozygous mutation in the fibrillin-1 (Fbn1) gene leads to fragmentation of the elastic fibers in the artery wall. When fed a Western-type diet, vulnerable plaque formation occurs, including intraplaque neovascularization, intraplaque hemorrhage, and plaque rupture.
Both stable and unstable plaques consist of lipids accumulating in the artery wall and are infiltrated by macrophages and other inflammatory cells. Since the presence of a high number of macrophages is one of the indications of a more severe, unstable plaque phenotype, 8 macrophage quantification is a main target for molecular small animal imaging strategies. 9 For example, ultrasmall superparamagnetic iron oxide particles have been used to detect the macrophages present in plaques with magnetic resonance imaging (MRI),10–13 and so has the vascular cell adhesion molecule 1. This molecule has been targeted with superparamagnetic peptide–functionalized nanoparticles for MRI14,15 and with lipid-shelled microbubbles for ultrasound imaging. 16 Furthermore [18F]fluorodeoxyglucose (FDG) positron emission tomography (PET)–computed tomography (CT) has been used to visualize plaque-related inflammation.17,18
However, the (through-plane) resolution of the used scanners, mainly MRI and PET, is limited for capturing the presence of atherosclerotic plaques in the carotid bifurcation of mice. 19 Therefore, plaque imaging is often restricted to anatomic images obtained by CT in combination with (iodinated) contrast agents, in which narrowing of the lumen indicates the presence of a plaque. 20 Enhancing anatomic CT with molecular imaging could help us better understand the processes taking place in vivo during the formation of atherosclerotic plaques. For this purpose, N1177, a suspension of crystalline iodinated particles dispersed with surfactant, has been explored in rabbits.21,22 High-risk, macrophage-rich atherosclerotic plaques could be detected with CT resolution, but, unfortunately, the half-life of water-soluble iodine contrast agents is too short to be used with a single-bolus injection in mice. 23 Accordingly, there is a need for a high-precision micro–computed tomography (microCT) scan protocol that allows detection of macrophages in murine plaques as a marker of plaque vulnerability.
In the present study, we demonstrated that Aurovist (Nanoprobes, Yaphank, NY), a recently introduced microCT contrast agent, can be used as a “tracing marker” for macrophages. Aurovist consists of 15 nm gold particles with a polyethylene glycol coating, which increases its circulation time by partially switching its elimination pathways from the reticuloendothelial system to the mononuclear phagocyte system. Details on the mechanism of action and the biodistribution of the contrast agent are found elsewhere.23–26 ApoE−/− mice, developing stable plaques, and ApoE−/−Fbn1C1039G+/− mice, developing vulnerable plaques, were injected with Aurovist and scanned with microCT at three consecutive time points. The animals were sacrificed, and dissected carotid arteries were investigated with histology, confirming that Aurovist is phagocytized by macrophages that accumulate within the atherosclerotic plaque. Furthermore, we propose a novel methodology to quantify Aurovist/macrophage accumulation in vivo, along the carotid bifurcation. A significant difference in macrophage accumulation was found between mice with stable and mice with vulnerable plaques.
Materials and Methods
Mice
Female ApoE−/−Fbn1C1039G+/− mice 7 (n = 14) and their ApoE−/− littermates (n = 9; 6 weeks old) were fed a Western-type diet (TD88137, Harlan Teklad, Madison, WI) for up to 20 weeks. The mice were kept under environmentally controlled conditions (12-hour normal light/dark cycles, 20–23°C, and 50% relative humidity) with food and water ad libitum. They were housed in groups of four to eight animals in well-ventilated cages with appropriate cage enrichment. All experiments were conducted according to the European Commission guidelines and were approved by the Animal Ethics Committee of Ghent University.
In Vivo Imaging at Weeks 10, 15, and 20
The animals underwent contrast-enhanced microCT scans at weeks 10, 15, and 20 after the start of the diet. Anesthesia was induced using a mixture of medical oxygen and 5% isoflurane and was reduced to 1 to 1.5% during the scanning. A first microCT scan (termed the precontrast microCT measurement) (Figure 1A) was acquired using a Triumph-II imaging system (TriFoil Imaging, Chatsworth, CA). After this measurement, the animal bed was moved out of the scanner and 100 μL/25 g body weight Aurovist was injected 27 in the tail vein through a previously inserted catheter to avoid animal movement. Immediately after this injection, the animal was translated back to its initial position in the scanner and a postcontrast microCT measurement was taken (Figure 1B). The microCT scan settings were set to a 50 μm focal spot size, 50 μm detector pixel size, 1,024 projections, 3.5 times magnification, 500 μA tube current, 75 kVp tube voltage, and a continuous rotation mode. The acquisition region of interest spanned the entire volume between the root of the aorta and approximately half of the skull.

Overview of the measured and postprocessed images. Images represent the right carotid bifurcation of an ApoE−/−Fbn1C1039G+/− mouse on a Western-type diet for 20 weeks. A, The precontrast measured microCT data set where the contrast agent accumulation in the artery wall is clearly visible around the bifurcation. B, Postcontrast injection image showing the vasculature. C, The angiographic image, constructed by subtracting the registered precontrast image from the postcontrast image. The vasculature is clearly visible in this image. D, The vesselness-filtered angiographic image showing higher contrast for the vasculature. This facilitates the initialization of the segmentation process. E, Segmentation of the right carotid bifurcation depicting the common carotid artery (blue), the external carotid artery (cyan), the first part of the internal carotid artery (green), part of the stapedial artery (red), and the second part of the internal carotid artery (orange).
Histologic Examination
After euthanasia or sudden death, mice were dissected and the aorta (including the brachiocephalic and carotid arteries) was isolated. Arteries were fixed in 4% formaldehyde (pH 7.4) for 24 hours, processed, and embedded in paraffin. Histologic analysis was performed on serial cross sections (5 μm) of the proximal ascending aorta and brachiocephalic and carotid arteries. Macrophages were determined by immunohistochemistry using anti-Mac-3 antibody (Pharmingen, San Diego, CA). Secondary antibody was species-appropriate horseradish peroxidase conjugates (Vector Laboratories, Burlingame, CA). 3-Amino-9-ethyl-carbazole (Vector Laboratories) was used as a chromogen. Images were acquired with Universal Grab 6.1 (IDL) software (Exelis, Boulder, CO) using an Olympus BX40 microscope (Tokyo, Japan). Images were quantified using ImageJ software (National Institutes of Health, Bethesda, MD).
Segmentation and Image Processing
The Iterative Maximum-likelihood Polychromatic Algorithm for CT 28 was used to reconstruct the CT data to reduce the effect of beam hardening due to the dense skull bone. To speed up the reconstructions, all data were first reconstructed at a lower resolution (0.2 mm isotropic voxel size), after which only the volume of interest around the carotid arteries was reconstructed at a higher resolution (0.050 mm isotropic voxel size). 29 This method was applied to both the pre- and postcontrast data sets.
To get rid of misalignments between the pre- and the postcontrast image, an image registration step was applied based on the BRAINSFit toolbox 30 in 3D Slicer 4 (<http://www.slicer.org>). 31 The following parameters were inserted in the rigid registration algorithm: number of samples = 300,000; spline grid size = 14, 10, 12; number of iterations = 1,000; linear interpolations, minimum step length = 0.000001; number of histogram bins = 200; and number of matchpoints = 40. The precontrast injection image was set as the moving image. After automatic registration, the 3D Slicer checkerboard module was used to visually inspect the registration results, and if there was a residual misalignment, the data set was removed from the database. Subsequently, an angiographic image was constructed by subtracting the registered precontrast image from the postcontrast image (Figure 1C). A vesselness-enhanced image (Figure 1D) was constructed based on the angiographic image. To that end, a Frangi vesselness filter was applied in the Vascular Modeling Toolkit (VMTK; <http://www.vmtk.org>) 32 with the following parameters: alpha 0.3, beta 500, and gamma 200. For the algorithm, 10 logarithmically spaced steps between 0.05 and 0.5 mm were taken.
The left and right carotid arteries were segmented with the levelset segmentation algorithm of VMTK. 33 First, an initial levelset was segmented based on the vesselness-enhanced image. The common carotid artery (CCA), external carotid artery (ECA), and internal carotid artery (ICA) were initially segmented by repeated executions of the colliding fronts algorithm, which returns a branch of the vascular network between a source and a target point. The threshold level was taken to be 40 Hounsfield units (HU) but manually adapted between 30 and 50 HU to get rid of noise or nearby veins if needed. The ICA was segmented beyond the emerging of the stapedial artery (SA), and the first part of the SA was also segmented (Figure 1E). The ECA was segmented as far as the bifurcation into the maxillary and superficial temporal arteries. After the initialization, an evolution step based on the angiographic image was carried out. The parameters for this step were propagation weight = 1, curvature weight = 0.4, advection weight = 0.6, edge weight = 0, and number of iterations = 200. The resulting surface was consecutively remeshed, smoothed, and remeshed again in VMTK to obtain an optimal surface representation. For the first remeshing, the area of the triangles was taken to be between 500 and 300 μm2. Afterwards, smoothing was performed with a passband of 0.1 and 30 iterations. For the final remeshing, the triangle area ranged between 150 and 50 μm2. Based on the calculated centerline, the carotid bifurcation was split in its three branches (CCA, ECA, and ICA).
Quantifying Macrophage Presence within the Lumen Area
The next step was to quantify the presence of contrast agent in the arterial wall on the precontrast images (i.e., with contrast agent originating from injections at previous time points). In principle, this is only relevant for data measured at weeks 15 and 20, but precontrast scans at week 10 were also processed to serve as controls (because no contrast should be detected).
To allow a smoother integration, the registered precontrast image was resampled to a resolution of 0.025 mm. Subsequently, the volume inside the segmented carotid arteries was masked on the resampled precontrast image using the vtkImageStencil tool of the Visualization Toolkit (VTK; <http://www.vtk.org>). The carotid bifurcation was cut out of the segmented surface by cutting the three branches based on the length of the ICA (between the carotid bifurcation and the SA bifurcation). The ICA was cut at 95% of its length, the ECA was cut at the point where it reached the length of the ICA, and the CCA was cut at two times the length of the ICA. For every triangle of the surface mesh at the carotid bifurcation, the normal was calculated in pyFormex (<http://www.nongnu.org/pyformex/>) (Figure 2A). These normals were uniformly sampled at 100 points over a total length of 0.3 mm. The sample points were classified to have an increased intensity, indicating the presence of contrast agent, if the image intensity was higher than a cutoff value of 350 HU. Based on the volume mask, we verified that every point was located outside the artery. Finally, for every surface triangle, the relative number of selected high-intensity points on the corresponding normal was expressed divided by the total amount of points outside the artery (Figure 2B). Thus, we obtained a clear visual representation of the presence of contrast agent near the boundary of the lumen.

Overview of the different steps involved in the quantification of the contrast-enhanced regions. A, This panel shows 1 of 10 calculated normals (black) perpendicular to the lumen surface (gray). B, The amount of points along each normal with an intensity higher than 350 HU indicates the regions with contrast agent present. C, The luminal area is split in rings with an average width of 0.05 mm to map the contrast-enhanced regions along the length of the arteries. D, The surface zones with contrast agent present along more than 25% of the normals are indicated in red. After the splitting of the lumen area in rings, a ring was selected to belong to the contrast-enhanced group if more than 10% of the surface showed contrast. The affected regions of the centerlines are indicated in red and the unaffected regions in gray.
Finally, we quantified the results as follows: every surface element in which more than 25% of the points of its surface normal had elevated intensity values was categorized to the increased intensity group, whereas all other elements were categorized in the normal intensity group. Subsequently, for every bifurcation branch (CCA, ECA, and ICA), the contrast-enhanced area and the contrast-enhanced area fraction (CAF[%area]), were calculated.
Quantifying Macrophage Presence along the Centerline
Because the ApoE−/−Fbn1C1039G+/− mice develop a high degree of stenosis in the carotid arteries over time, only considering the luminal surface holds the risk of a bias. Stenosis will reduce the internal area of the artery wall, which leads to an underestimation of the influence of these regions when using an area-averaged value. To circumvent this risk, the contrast-enhanced regions were mapped to the centerline of the lumen because the centerline length is not affected by the presence of stenosis. For this operation, the centerline was calculated, resampled to 0.05 mm, and split into branches in VMTK. For every segment of the centerline, the corresponding part of the luminal wall was selected in pyFormex by cutting the entire luminal surface with two planes, thus splitting the total geometry into rings with an average width of 0.05 mm (Figure 2C). Again, we categorized the data and considered each segment to belong to the contrast group if the outer contrast-enhanced lumen area in the corresponding ring segment was more than 10% of the total lumen ring segment area (Figure 2D). Similar to the method proposed by Brown and colleagues with regard to calcification of plaques, 34 we were thus able to track the presence of contrast agent along the centerline. Finally, we calculated for every branch for what distance along the centerline contrast agent was present (contrast-enhanced length fraction, CLF [%length]).
Statistical Analysis
The same statistical analysis was performed for the CAF[%area] and CLF[%length]. Genotype was taken as a between-subjects factor because the mice were grouped accordingly (ApoE−/− or ApoE−/−Fbn1C1039G+/−). In addition, the measured data set was split by three within-subjects factors, namely, time (week 15 or week 20), side (left or right carotid bifurcation), and location (CCA, ECA, or ICA). The measurements at week 10 were used to validate the process and did not receive a contrast injection at a previous time point; therefore, these measurements were not included in this analysis. The statistical analysis was performed in SPSS Statistics 22 (IBM, Armonk, NY). The preferred test for this type of data set is the general linear model with repeated measures. However, for this test, only the subjects (mice) for whom all measurements are available are taken into account, which reduced the data set to three ApoE−/− and six ApoE−/−Fbn1C1039G+/− mice. Hence, we decided to use a linear mixed model in which the within-subjects variables are included as repeated measurements. This test can handle missing values, so no measured data were excluded. We opted for an autoregressive heterogeneous covariance structure for the residuals after minimizing the information criteria for different covariance structures. A random effect, with scaled identity as covariance type and including the intercept, was added for the mice identities to account for the random mice selection out of the population for this study. Next, a type III type of sum of squares was chosen. Finally, a full factor analysis was performed for the four factors: strain, time, side, and location.
To verify the operator independence of the proposed methodology, the operator-dependent segmentation step was performed (blinded) by a second operator. From this second set of segmentations, further operator-independent processing steps resulted in a new set of CAF and CLF values. The correlation between the results of both operators for CAF and CLF was calculated as we tested for equivalence of the average values of both data sets using a two one-sided paired t-tests approach 35 (Microsoft Excel).
Results
Available Data Sets for Analysis
One ApoE−/− and two ApoE−/−Fbn1C1039G+/− mice died or were euthanized for ethical reasons before they reached week 10 of the diet. Signs of severe pain and distress, which led to the euthanasia, included panting, head tilt, a hunched body posture, and immobility. Therefore, at the first imaging time point, 8 ApoE−/− and 12 ApoE−/−Fbn1C1039G+/− mice were still included in the study. Afterwards, 4 more ApoE−/−Fbn1C1039G+/− died or were euthanized before the end of the experiment. Two measurements failed because of a human error. Next to this, in six cases, the registration of the pre- and postcontrast images failed due to motion artifacts. Finally, only a portion of the right ECA of two ApoE−/− mice at week 20 could be resolved, due to severe stenosis, and only the left carotid bifurcation was thus included at this time point. In summary, the analysis includes 14, 8, and 14 ApoE−/− carotid bifurcations (left and right) at weeks 10, 15, and 20, respectively. For the ApoE−/−Fbn1C1039G+/− mice, 20, 16, and 14 bifurcations were available for analysis at these time points.
Histology
As a first step, we investigated whether the injected Aurovist particles can be used as a tracing marker for macrophage presence. The Mac-3 stain in Figure 3 shows a representative example of macrophage infiltration (in red) in different areas of an atherosclerotic plaque (panels A and B). Aurovist particles (visible on the Mac-3 stain as black dots) are abundantly present in macrophage-rich regions (panels C and D) as well as in the plaque necrotic cores (panels E and F). We hypothesize that in the hours and days after Aurovist injection, macrophages phagocytize the Aurovist particles and migrate to inflamed zones within the plaque. At the necrotic cores, Aurovist particles accumulate, yet no macrophages can be detected on the Mac-3 stain. We hypothesize that Aurovist particles at this location have been released by necrotic macrophages that are no longer visible on the Mac-3 stain (loss of epitope). We conclude that Aurovist can be used in combination with microCT as an in vivo tracer for macrophage presence.

A and B, Mac-3 stain showing a representative example of macrophage infiltration in different areas of an atherosclerotic plaque of an ApoE−/−Fbn1C1039G+/− mouse. Macrophages are stained in red, whereas Aurovist particles are visible as black dots. Aurovist particles are abundantly present in macrophage-rich regions such as the plaque shoulder as well as in the plaque necrotic cores. C and D, Detailed images show how macrophages have engulfed Aurovist particles. E and F, In the necrotic cores, Aurovist particles accumulate, yet no macrophages can be detected on the Mac-3 stain. Scale bars of A and B are 200 μm and scale bars of C–F are 50 μm.
Validation Test for False Positive Results at Week 10
The results at week 10 served to validate the performance of the proposed framework with regard to false positives (contrast-enhanced locations found) as these animals did not receive any previous contrast injection. The maximum value for an individual mouse at week 10 of the CAF was 0.15, 1.17, and 0.22 %area for the CCA, ECA, and ICA, respectively. For the CLF, these values were, respectively, 0.00, 3.36, and 0.00 %length. Averaged over the whole group, the false positives for the CCA and the ICA were smaller than 0.02%area/length. For the ECA, the average false positives were 0.077%area and 0.18%length mainly because of the presence of a tracheal cartilage ring in the image field in one animal. Both measures are thus reasonably robust but fail in the rare case that a trachea cartilaginous ring is present in the region of interest.
Quantification of Contrast Enhancement in the Arterial Branches: CAF and CLF
Table 1 quantifies the CAF [%area] for every separate branch of the bifurcation (CCA, ECA, and ICA). In both ApoE−/− and ApoE−/−Fbn1C1039G+/− mice, the highest contrast agent uptake occurred in the ECA, at both week 15 and week 20. In both mouse models, there was an increase over time, especially in the ApoE−/− model, where a fourfold increase in contrast uptake between weeks 15 and 20 could be observed. The increase in the ApoE−/−Fbn1C1039G+/−model was less pronounced, with a 200% increase for the CCA and ICA and a 50% increase in the CCA. This is, however, mainly due to the already higher extent of contrast agent uptake at week 15 in the ApoE−/−Fbn1C1039G+/− mice. The statistical CAF analysis in different branches revealed that time (week 15–week 20) and location (CCA, ECA, or ICA) are highly significant factors (p < .01). Genotype (ApoE−/− or ApoE−/−Fbn1C1039G+/−) has a higher p value but is still a significant factor (p < .05). No difference was found between the left or right side (p = .745). Finally, the interaction between the factors time and location was also highly significant (p < .01). This supports the trends shown in Table 1. The estimated averages showed that, on average, ApoE−/− mice had 14.2%area less contrast-enhanced area compared to ApoE−/−Fbn1C1039G+/− mice, and this effect was significant (p < .05). At week 15, the affected area was smaller than at week 20, with an average difference of 19.6%area (p < .01). The differences between the locations in both strains were also highly significant (p < .01): the contrast-enhanced area in the CCA was smaller compared to that of the ECA (32.3%area) or the ICA (13.6%area).
CAF [%area] with the Standard Deviation at the Different Branches
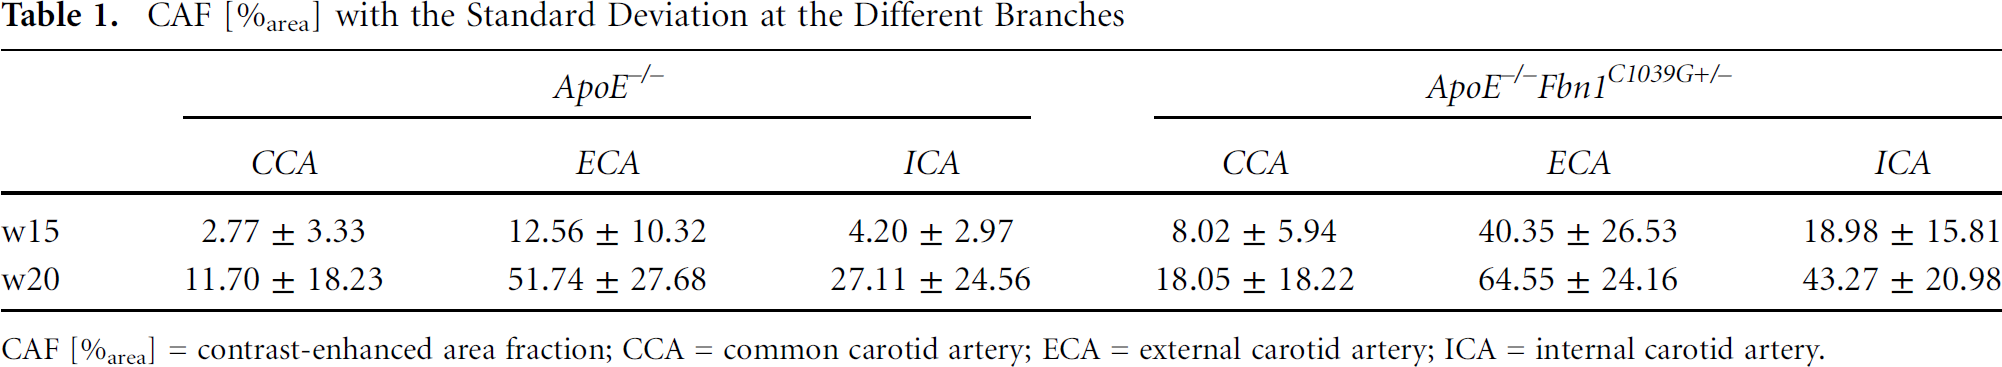
CAF [%area] = contrast-enhanced area fraction; CCA = common carotid artery; ECA = external carotid artery; ICA = internal carotid artery.
The results depicted in Table 2 represent the CLF expressed in %length for the three different branches (CCA, ECA, and ICA). These results are similar to the results shown in Table 1. However, the absolute values are higher because this way of calculating contrast agent accumulation attributes a higher weight to regions where contrast agent is present only partially around the circumference. These results are summarized in Figure 4. A marked increase in Aurovist accumulation can be observed from week 15 (cross-hatched bars) to week 20 (bars without hatching). The statistical analysis of the CLF yields slightly different results compared to the CAF. Time and location are still highly significant (p < .01), but in this case, genotype is also highly significant. Still, there is no statistical indication of a difference between left and right (p = .609). Furthermore, the interaction between time and location remains highly significant. Finally, the interaction between genotype and location, which was almost significant in the CAF, became significant (p < .05) for the CLF. The ApoE−/− mice have on average 20.7%length smaller contrast accumulations (p < .01) compared to ApoE−/−Fbn1C1039G+/− mice. From week 15 to week 20, the model estimated average growth of the contrast deposits is 30.5%length. Moreover, the CLF in the CCA is 51.3%length lower compared to the ECA and 32.0%length lower compared to the ICA (both p < .01). For both the CAF and the CLF, the statistical tests show that there is a significant difference between both groups of mice. We can conclude that, on average, the ApoE−/−Fbn1C1039G+/− mice have more contrast accumulation, that there is a significant growth in accumulation over time, and that it is very location dependent.

The length of the centerline of each branch where contrast agent is present (CLF) [% cl]. CCA = common carotid artery; ECA = external carotid artery; ICA = internal carotid artery.
CLF [%length] with the Standard Deviation at the Different Branches

CCA = common carotid artery; CLF [%length] = contrast-enhanced length fraction; ECA = external carotid artery; ICA = internal carotid artery.
Testing for Operator Independence
The resulting CAF and CLF values were compared for two sets of segmentations, executed by two different operators. The correlation between both CAF data sets is 0.993, and for the CLF, it is 0.986. The mean difference between both CAF data sets was smaller than 1%area (p < .001). For CLF, the mean difference is smaller than 5%length (p < .001).
Qualitative Visualization of the Contrast-Enhanced Regions
The quantitative results described above are further illustrated by graphical representations of the precise contrast-enhanced locations. Figure 5 shows a representative example of an ApoE−/− mouse at weeks 15 and 20. At week 15, there were only small regions where contrast enhancement was visible. The two largest regions were located in the ECA. At week 20, the shape of the contrast-enhanced area had changed, with contrast-enhanced zones at regions of the ECA, ICA, and CCA close to the bifurcation. In Figure 6, similar images are shown for an ApoE−/−Fbn1C1039G+/− mouse at weeks 15 and 20. In this case, the shape of the contrast-enhanced area was similar for both time points, with Aurovist present along the entire ECA and ICA and in the part of the CCA closest to the carotid bifurcation. However, the contrast-enhanced area was significantly increased at week 20, confirming the quantitative results indicated in Table 1.

Contrast-enhanced regions around the carotid bifurcation of an ApoE−/− mouse at weeks 15 and 20 after the start of the diet. At week 15, both the medial side of the carotid bifurcation (A) and the lateral side (B) only show small zones with little contrast enhancement. These zones are preferably located at the external carotid artery (ECA). The contrast-enhanced regions have grown over time and are at week 20 (C and D) merely located in the ECA and internal carotid artery. They are mainly situated at the medial side (C) compared to the lateral side (D).

Contrast-enhanced regions around the carotid bifurcation of an ApoE−/−Fbn1C1039G+/− mouse at weeks 15 and 20. A and B, At week 15, regions with contrast enhancement are visible in the last part of the common carotid artery, in the first part of the internal carotid artery, and along the external carotid artery (ECA). These regions span both the medial (A) and the lateral (B) side of the carotid bifurcation. C and D, At week 20, the area with contrast enhancement has increased. They are still the same zones as at week 15, but they have grown considerably in size. Especially in the ECA, contrast agent is present along the whole length. The contrast agent is present around the whole bifurcation and thus spans both the medial (C) and the lateral (D) side.
Precise Locations of Contrast-Enhanced Regions in Both Groups of Mice
On top of the quantitative and qualitative analysis, the proposed framework also allows for an exact and detailed visualization of the locations of Aurovist accumulation. The first row of Figure 7 (panels A and B) shows the number of cases for which Aurovist was present in the CCA as a function of the distance to the bifurcation. The distance is zero (right side of the x-axis) at the bifurcation and decreases downstream from there. On the left side (panel A), the values for the ApoE−/− mice are shown, and on the right side (panel B), the values for the ApoE−/−Fbn1C1039G+/− mice can be found. For both cases, the status is pictured with circles at week 15 and with crosses at week 20. A first striking feature is that the contrast preferentially builds up near the bifurcation and is more or less confined to this region, especially for the ApoE−/−Fbn1C1039G+/− mice. For the ECA, shown in the second row in Figure 7 (panels C and D), the contrast agent is much less restricted to a specific region. On an average basis, the locations are more or less uniform along the inspected length of the artery. Finally, for the ICA, shown in the third row in Figure 7 (panels E and F), the contrast agent is mostly located near the bifurcation at week 15, with a gradual decrease downstream. At week 20, however, it evolved to a state where the Aurovist was more equally distributed along the whole artery, confirming earlier results.
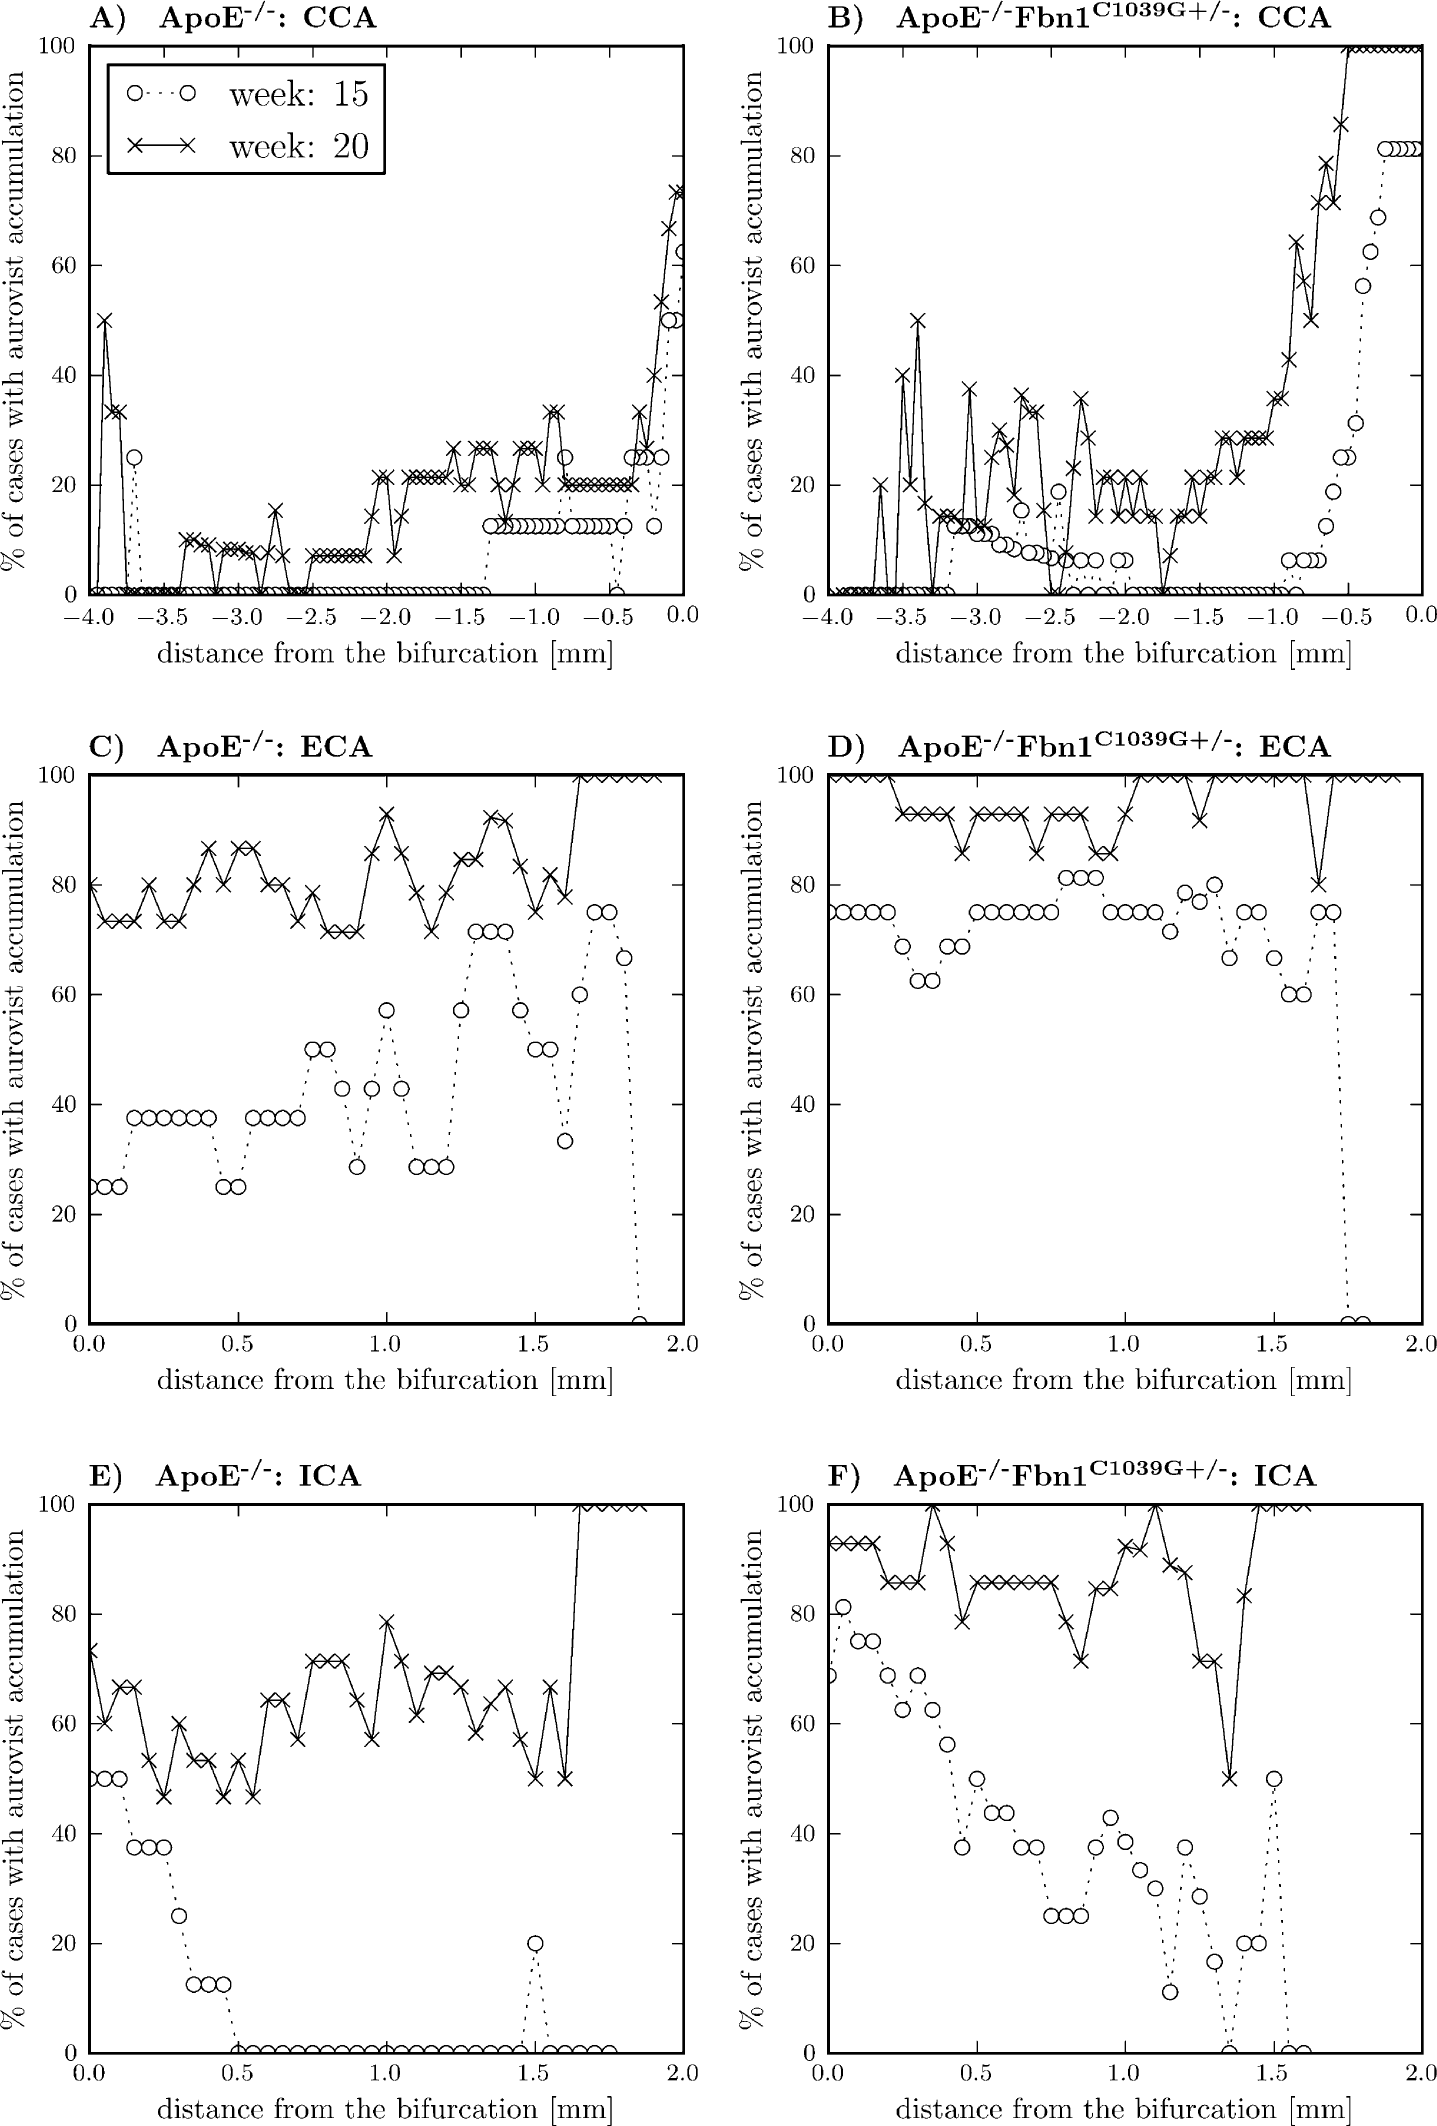
Localization of Aurovist at the different branches. At the horizontal axis, the distance, sampled at 0.05 mm, from the bifurcation is depicted, and on the vertical axis, the percentage of cases with Aurovist at that precise location is shown. The occurrence of Aurovist at every location was determined by projecting the lumen surface contrast agent plot on the centerline. The first row (panels A and B) shows the common carotid artery (CCA), the second row (panels C and D) the external carotid artery (ECA), and the third row (panels E and F) the internal carotid artery (ICA). On the left-hand side (panels A, C, and D), the ApoE−/− mice, and on the right-hand side (panels B, D, and F), the ApoE−/−Fbn1C1039G+/− mice are shown. For every case, the comparison was made between the situation at week 15 (circles) and week 20 (crosses).
Discussion
In this study, we investigated contrast-enhanced, in vivo microCT imaging to visualize macrophage infiltration over time in murine atherosclerotic plaques. The technique was validated with histology and applied in a longitudinal study including both ApoE−/− mice, a model for stable atherosclerotic plaque, and ApoE−/−Fbn1C1039G+/− mice, a model for vulnerable atherosclerotic plaque. We used two different methods to quantify the contrast accumulated in the atherosclerotic plaque: the CAF for the contrast-enhanced area fraction and the CLF for the contrast-enhanced centerline length fraction of the branches along the carotid bifurcation. We visualized and quantified the different contrast-enhanced locations and found significant differences in macrophage infiltration between time points and between mouse models.
Contrast Agent Accumulation and Distribution
We observed significant growth in contrast-enhanced (and thus macrophage-infiltrated) regions over time in both mouse models, and these regions were significantly larger in ApoE−/−Fbn1C1039G+/− mice compared to ApoE−/− mice. Nevertheless, interesting geometric differences could be observed between different branches. In the ApoE−/−Fbn1C1039G+/− mice, the CAF and CLF increased significantly from week 15 to week 20 at both the ICA and the CCA, whereas only a small increase was noticeable at the ECA. This could be explained by the fact that in about 75% of the ApoE−/−Fbn1C1039G+/− mice, the contrast agent was already present along the entire ECA at week 15. Therefore, there was only little space for an expansion of the contrast-enhanced region along the lumen over time as it occurred in the other two branches. Another interesting observation in this respect was that in both mouse models, at both time points, a larger part of the ECA and the ICA was contrast enhanced compared to the CCA. Moreover, the contrast-enhanced regions in the CCA were localized near the bifurcation, whereas the contrast-enhanced regions in the ECA and the ICA were smeared out away from the bifurcation. Likely, the latter can be linked to flow hemodynamics because locations of low and oscillatory flow are known to promote macrophage infiltration.36,37 Since the flow distally to the bifurcation is likely to be more disturbed, flow perturbations will induce more spread out flow patterns in the ECA and ICA. In the CCA on the other hand, the blood flow reaches a stagnation point at the bifurcation and few flow perturbations occur upstream. We conclude that macrophage infiltration occurs with similar geometric patterns but different intensities in both mouse models and that the ECA is exposed to macrophage infiltration at an earlier time point than the other two branches.
The study does not include control animals not developing atherosclerosis. Note, however, that the animals included can, to a certain extent, be used as their own controls. It is known that atherosclerosis develops only in a later stage in the central section of the CCA. This is consistent with our observation that no contrast accumulation is visible in either ApoE−/− or ApoE−/−Fbn1C1039G+/− mice at week 15 (Figure 7, A and B—dotted lines with circles) at the proximal end of the CCA.
Advantages
Imaging Technique
The present methodology enabled the use of a high-resolution microCT scanner for molecular imaging of the location of macrophages in atherosclerotic plaques in the carotid bifurcation of mice. This enables the measurement of plaque development very precisely, which was not possible with standard, purely anatomic microCT imaging. Moreover, it allows longitudinal in vivo studies of the inflammation process in the artery wall in mice. Therefore, this methodology has the potential to be used in preclinical studies on plaque development or plaque-stabilizing therapeutics. To the best of our knowledge, no such technique currently exists in mice.
Postprocessing
The processing and quantification of the data have advantages as well. We described a method to color-code contrast-enhanced areas on the luminal surface, which gives a clear overview of all the targeted areas (see Figure 5 and Figure 6). This allows the demonstration of small location shifts of the longitudinal data and is an excellent technique to follow up individual cases. For example, in Figure 6, the contrast-enhanced regions for the ApoE−/−Fbn1C1039G+/− mouse clearly originate at the outer bends of the bifurcation at week 15, but at week 20, they also span the inner side. Another asset of this method is the user independency. Only for the segmentation of the arterial geometry was interaction of the user necessary by selecting points inside the arterial network. The operator dependency study, however, showed that operator dependency in this step is likely to have only a very small influence on the resulting CAF and the CLF values. For the more critical selection of contrast-enhanced regions, no interaction was needed. In the future, as segmentation and/or imaging techniques evolve, the segmentation would probably evolve more toward automatic algorithms where (almost) no user interaction will be needed.
Limitations
The main limitation of the scanning protocol is that two microCT scans are needed, a pre- and a postcontrast injection scan, at every time point. First, this doubles the amount of scans that have to be successful for one measurement data set. Moreover, rigid image registration is an effective way of removing translations between both scans, but it cannot remove animal repositioning effects between the pre- and the postcontrast injection scan at the same time point. In the current study, this accounted for six failures of 50 measurements. As such, measures to limit animal motion between scans are warranted. The duration of every scan was around 20 minutes, so one option is to reduce the scan time by using another scan protocol or scanner to reduce the amount of registration failures. Another option is to use a more advanced registration method with more degrees of freedom, for example, a deformable method, which can take into account movements of the mouse. 38
The repeated injections of Aurovist do not seem to have an effect on the animal welfare 23 or plaque development. However, due to the need for pre- and postcontrast injection scans, the animals receive twice as much radiation. In this study, the mice were scanned six times, spread out over 10 weeks, with an estimated total radiation dose of 6 Gy. Therefore, we cannot rule out radiation dose–induced morbidity and mortality. It is therefore important to optimize protocols in terms of radiation dose and number of intermediate time points and to required image quality.
A larger sample size would result in a smoother curve for the localization of the contrast agent in the different branches (see Figure 7). The applied framework lacks inherent information about the depth of the contrast accumulations as long as they are closer than the threshold value of 0.3 mm to the lumen surface. Therefore, it is a useful tool to determine the size and location of the areas with contrast agent but is less suited to study outward or inward remodeling-related processes occurring in atherosclerotic plaque development.
In the present study, there was a time difference of 5 weeks between consecutive measurements. The Aurovist stayed inside the lumen for more than 24 hours but afterwards gradually decreased. During this time, the Aurovist was taken up by macrophages and migrated to the atherosclerotic plaque regions. However, it is possible that these macrophages migrated and mixed with macrophages that had migrated at a later time point.
Finally, we chose to express the contrast-enhanced regions in terms of influenced luminal area and influenced artery length. As a side effect of this choice, the inner curve of the bifurcation can be taken into account twice. If the curve is sharp enough, the surface normals of both the ECA and the ICA will penetrate this region. However, this effect plays a role only for a small fraction of the surface and does not affect the meaning of the influenced area because this is the transition between both branches.
Conclusion
We propose Aurovist-enhanced microCT as a promising new tool to visualize macrophage infiltration in vivo in preclinical small animal research. By using histology, we showed that Aurovist coincides with macrophages using histology and developed a methodology to quantify Aurovist presence within atherosclerotic plaques based on in vivo microCT images. We applied this methodology in a longitudinal follow-up study in two different mouse models for atherosclerotic plaque. We observed a significant growth of contrast-enhanced (and thus macrophage-infiltrated) regions over time in both mouse models, and these regions were significantly larger in ApoE−/−Fbn1C1039G+/− mice (a model for vulnerable plaque) compared to ApoE−/− mice (a model for stable plaque). Regional differences in macrophage distribution over different branches suggested that local hemodynamics affect macrophage infiltration. The developed methodology will be used in the future to perform more in-depth research on the presence of macrophages in cardiovascular disease in mice.
Footnotes
Acknowledgments
We thank Scharon Bruneel, Francesco Iannaccone, and Bieke Van der Veken for their assistance.
Financial disclosure of authors: David De Wilde and Carole Van der Donckt are recipients of research grants from the Flemish government agency for Innovation by Science and Technology (IWT). Christian Vanhove is supported by the GROUD-ID consortium of Ghent University. This research has benefited from a statistical consultation with Ghent University FIRE (Fostering Innovative Research based on Evidence).
Financial disclosure of reviewers: None reported.