
Abstract
Noninvasive imaging is a critical technology for diagnosis, classification, and subsequent treatment planning for patients with glioblastoma. It has been shown that the EphA2 receptor tyrosine kinase (RTK) is overexpressed in a number of tumors, including glioblastoma. Expression levels of Eph RTKs have been linked to tumor progression, metastatic spread, and poor patient prognosis. As EphA2 is expressed at low levels in normal neural tissues, this protein represents an attractive imaging target for delineation of tumor infiltration, providing an improved platform for image-guided therapy. In this study, EphA2-4B3, a monoclonal antibody specific to human EphA2, was labeled with 64Cu through conjugation to the chelator 1,4,7-triazacyclononane-1,4,7-triacetic acid (NOTA). The resulting complex was used as a positron emission tomography (PET) tracer for the acquisition of high-resolution longitudinal PET/magnetic resonance images. EphA2-4B3-NOTA-64Cu images were qualitatively and quantitatively compared to the current clinical standards of [18F]FDOPA and gadolinium (Gd) contrast–enhanced MRI. We show that EphA2-4B3-NOTA-64Cu effectively delineates tumor boundaries in three different mouse models of glioblastoma. Tumor to brain contrast is significantly higher in EphA2-4B3-NOTA-64Cu images than in [18F]FDOPA images and Gd contrast–enhanced MRI. Furthermore, we show that nonspecific uptake in the liver and spleen can be effectively blocked by a dose of nonspecific (isotype control) IgG.
NEUROIMAGING has evolved from being a purely anatomic tool to a discipline that can offer anatomic, functional, hemodynamic (physiologic), metabolic, and molecular information.1–5 From the perspective of patients with brain tumors, the use of neuroimaging techniques is an essential stage in the diagnosis and classification of the tumor and to assess patient response following treatment. 6 Currently, a combination of magnetic resonance imaging (MRI), computed tomography (CT), and positron emission tomography (PET) techniques is used in the diagnosis and treatment of glioblastoma. Despite the growing effectiveness of these techniques, a number of key obstacles remain. For 11C- and some 18F-labeled amino acid–based oncology tracers, a prerequisite for clinical diagnostics is ready access to a cyclotron and radiopharmacy facilities. Longer half-life radiometals such as 64Cu and 89Zr, along with the development of bifunctional chelators for simple conjugation to biomolecules, may provide a mechanism for more widespread oncology PET imaging. However, for this scenario to be a realistic alternative, the efficacy of new potential imaging agents must be equal to or greater than currently used 11C- or 18F-based tracers, such as [11C]methionine 7 or [18F]FDOPA.7–9 Over the past 20 years, the resurgence in nuclear imaging techniques has been bolstered by significant advances in the production and radiolabeling of highly specific biomolecules such as monoclonal antibodies (mAbs). Reproducible protocols for the large-scale production of mAbs 10 have enabled researchers to effectively target an enormous number of receptors in a highly specific way. The impact of this development on PET imaging has been significant with increasing application of radiolabeled mAbs as diagnostic and therapeutic targets in oncology.11–15
The Eph receptor tyrosine kinases (RTKs) and their Eph-interacting ligands (ephrins) are the largest subfamily of tyrosine kinases, consisting of 16 Eph receptors and 9 ephrin ligands. 16 From the discovery of the first Eph RTK, 17 evidence has been accumulating to implicate the Eph family in tumor development and progression—a body of work that continues to grow. The complex bidirectional signaling mechanisms between Eph RTKs and ephrin ligands have been shown to influence cell morphology, adhesion, migration, invasion, proliferation, and survival.16,18,19 As such, many studies have linked Eph and ephrin expression levels with tumor progression, metastatic spread, and patient survival. In the specific case of EphA2, an increasing number of studies have shown a correlation between EphA2 overexpression and poor patient prognosis.20–27 EphA2 overexpression has been observed in a number of glioblastoma-derived cell lines,28–30 and levels of EphA2 are significantly higher in glioblastoma tissue than in normal brain tissue. A recent study by Day and colleagues showed that EphA2 expression is significantly elevated (p = .021) in high-grade glioma specimens (n = 54 patients) compared to normal brain specimens (n = 11 patients). 31 The overexpression of Eph receptor tyrosine kinases, including EphA2 in glioblastoma, has been indicated to be a critical measure of invasiveness, and as such, Eph RTKs have attracted attention as targets for the development of imaging and therapeutic agents.30,32–34 The development of molecular imaging agents specific to EphA2 is a logical precursor to the development of therapeutics specific to EphA2. In this way, potential patient-specific expression of the receptor can be assessed before delivery of the targeted therapeutic.
Despite increasing attention as therapeutic targets and as biomarkers for both diagnosis and prognosis in a number of cancers, in vivo imaging of tumors using Eph receptors as targets has only been reported in a small number of studies, with no study to date having compared Eph-based imaging to current “state of the art” clinical imaging methods, such as [18F]FDOPA PET and contrast-enhanced MRI. Vearing and colleagues showed that an 111In-labeled mAb specific to EphA3 accumulated in xenograft tissue in a subcutaneous HEK293 model to a level of 27 %ID/g 4 days postinjection. 35 Imaging by gamma camera showed that the xenograft was clearly visible up to 96 hours postinjection. Cai and colleagues evaluated a 64Cu-labeled mAb specific to EphA2 in eight subcutaneous tumor models, including a U87 model of glioblastoma. 36 The authors found that tumor uptake as measured by microPET imaging correlated well with EphA2 expression as measured by Western blot analysis. Xiong and colleagues identified the potential of EphB4 as an imaging target in prostate and colon cancer models. 37 The authors showed uptake of approximately 1 %ID/g in the tumor after 24 hours following injection of a 64Cu-labeled peptide specific to the EphB4 receptor. Zhang and colleagues investigated the use of a polymeric micellar nanoparticle dual for single-photon emission computed tomography (SPECT)/optical imaging platforms targeted to EphB4 by conjugation to a peptide. 38 The authors showed high retention of the imaging agent in the tumor and provided strong correlation between in vivo SPECT/CT and fluorescence imaging and ex vivo autoradiography and fluorescence imaging. More recently, Mamat and colleagues reported the development of a small molecule 18F-labeled tracer specific to EphB4. 39 The authors reported high metabolic stability of the tracer, but autoradiography showed low uptake into EphB4-overexpressing tumors. Although the initial efficacy of the labeled mAb can be investigated in subcutaneous models of glioblastoma, this experimental design removes the influence of the blood-brain barrier. As yet, the EphA2 RTK has not been fully exploited as a target for PET tracers and has not been investigated as an imaging target in an intracranial model of glioblastoma.
The novel contribution of this work is the presentation of biodistribution and pharmacokinetic data of a unique mAb specific to the human form of EphA2 (4B3) in a U87 orthotopic mouse model and two unique patient-derived orthotopic mouse models, RN1 and WK1. In addition, we describe for the first time qualitative and quantitative comparisons of tumor to brain contrast versus two clinical standards: contrast-enhanced MRI and [18F]FDOPA PET. Furthermore, we evaluate the use of a blocking dose of cold, nonspecific mAb as a method of increasing blood half-life and increasing specific tumor uptake.
Materials and Methods
Reagents
Chemical reagents were sourced from Sigma-Aldrich (St. Louis, MO) and were used as received. 1,4,7-Triazacyclononane-1,4,7-triacetic acid was purchased from Macrocylics (Dallas, TX), and Amicon centrifugal filters were purchased from Sigma-Aldrich. 64CuCl2 was produced by the Department of Medical Technology & Physics and RAPID PET Laboratories, Sir Charles Gairdner Hospital (Perth, Western Australia). [18F]FDOPA was produced by Queensland PET, Royal Brisbane and Women's Hospital (Brisbane, Queensland).
Antibodies
The EphA2-4B3 mAb is a human-specific IgG2a antibody raised in wild-type mice against a human EphA2-Fc immunogen. It was produced by standard hybridoma methodology in the laboratory of A. Boyd at QIMR Berghofer Medical Research Institute. Large-scale antibody production and purification were carried out at the Protein Expression Facility, Australian Institute for Bioengineering and Nanotechnology, The University of Queensland (Brisbane, Australia).
Tumor Models
Three glioblastoma tumor models were used in this investigation:
U87 cells 40 were maintained in RPMI160 medium (Gibco) supplemented with 10% fetal bovine serum (Gibco), 2 mM l-glutamine, 25 mM HEPES, 25 mM sodium bicarbonate, 100 U/mL penicillin, and 100 μg/mL streptomycin.
Two early-passage glioblastoma cell lines, RN1 and WK1, were used to develop further xenograft models. The RN1 cell line was derived from a 56-year-old man with a left temporal glioblastoma multiforme (glioblastoma, World Health Organization grade IV) prior to him receiving chemotherapy or radiotherapy. The primary tumor was classified as the classic subtype of glioblastoma. 41 The patient survived 243 days from the date of his diagnosis. The WK1 cell line was derived from a 77-year-old man with a right parieto-occipital glioblastoma, again prior to him receiving chemotherapy or radiotherapy. The primary tumor belongs to the mesenchymal subtype of glioblastoma. 41 The patient survived 121 days from the date of diagnosis.
Both cell lines were grown as an adherent culture in Matrigel-coated tissue culture flasks in RHB-A stem cell culture medium (StemCell Inc) containing 100 U/mL penicillin and 100 μg/mL streptomycin and supplemented with 20 ng/mL epidermal growth factor and 10 ng/mL fibroblast growth factor-basic (StemCell Inc, Newark, CA). 42 Tumor tissue was collected as part of a study approved by the human ethics committees of the QIMR Berghofer Medical Research Institute and the Royal Brisbane and Women's Hospital, with patient consent. The tumor was examined by a neuropathologist to verify tumor type and grade.
All cells were cultured in 5% CO2/95% humidified air atmosphere at 37°C and used when they reached 70 to 80% confluence. Cells (100,000 in 2 μL of phosphate-buffered saline [PBS]) were injected into the right striatum of 6-week-old female NOD/SCID mice using a stereotaxic frame under isoflurane anesthesia. Cells were injected at a depth of 3 mm, 1.6 mm rostral and 0.8 mm lateral to the bregma. Expression of EphA2 was measured by flow cytometry in each cell line (see Figure S1, online version only).
NOTA Conjugation
NOTA-NCS (100 μg) was dissolved in sodium carbonate buffer (pH 9) and added to EphA2-4B3 (1 mL at 1 mg/mL) in sodium carbonate buffer (pH 9). The resulting mixture was gently agitated at room temperature for 6 hours, purified through Amicon 100 kDa molecular-weight cutoff centrifugal filters, and buffer exchanged into PBS (pH 7.4). The number of NOTA cages per mAb was calculated by the isotopic dilution method and was found to be approximately 0.5 43 (see Table S1 online version only).
Radiolabeling
64CuCl2 was diluted 50:50 in ammonium acetate buffer (pH 5.5) when received. EphA2-4B3-NOTA (150 μg) in ammonium acetate buffer (pH 5.5) was added to a solution of 64CuOAc (100 MBq) in ammonium acetate buffer (pH 5.5) and stirred at room temperature for 1 hour. A 10 μL aliquot of the reaction was removed, added to a large excess of ethylenediaminetetraacetic acid (EDTA; 1,000:1 molar excess), stirred at room temperature for 30 minutes, and spotted onto thin-layer chromatography (TLC) paper. Following TLC in a 50:50 EtOH:ammonium acetate eluent system, > 95% 64Cu binding was found by radioisotopic imaging of the TLC plate using a Bruker MSFX Pro (Bruker, Billerica, MA), and the final product was obtained with a specific activity of 581 MBq/mg. The TLC plate was subsequently cut into two sections (Retention factor [Rf] > 0.3 and Rf < 0.3), and the total gamma emissions were counted using a PerkinElmer 2480 Automatic Gamma Counter (PerkinElmer, Waltman, MA) to confirm > 95% labeling efficiency (see Figure S2 and Table S2, online version only). The resulting EphA2-4B3-NOTA-64Cu was used without further purification. The stability of EphA2-4B3-NOTA-64Cu was evaluated by incubation in PBS and fetal bovine serum (FBS) at 37° for 24 hours followed by analysis by instant TLC (see Figure S3 and Table S3, online version only).
PET/MRI Acquisition
All animal experiments were approved by The University of Queensland Animal Ethics Committee and QIMR-B Animal Ethics Committee. Mice were injected with EphA2-4B3-NOTA-64Cu (5–7 MBq) intravenously via the lateral tail vein under isoflurane anesthesia. Mice were maintained under 1 to 2% isoflurane in an air-oxygen mixture at a flow rate of 2 L/min for the duration of the imaging session and monitored by a breathing pillow. At 0, 6, and 22 hours following injection, mice were positioned on the scanner bed (Bruker 7T Clinscan interfaced with a Siemens Spectrometer running Numaris/4 VB17 with a PET ring centered at the isocenter of the magnet consisting of three rings of 16 crystal blocks), 44 and two T1-weighted images were acquired using a three-dimensional (3D) gradient echo sequence (repetition time = 12 ms; echo time = 1.07 ms; field of view = 105 × 39 × 28 mm; acquisition matrix = 416 × 156 × 112; slice partial Fourier = 6/8; number of averages = 6; total acquisition time = 14 minutes). A 30-minute PET static emission scan was acquired simultaneously with the MRI acquisition. PET images were reconstructed by a two-dimensional ordered subsets expectation maximum (OSEM2D) algorithm with no attenuation or scatter correction. A third T1-weighted 3D GE image, using a pulse angle of 21°, was acquired following intravenous injection of Magnevist (Bayer HealthCare, Whippany, NJ) (50 μL) via the lateral tail vein at 22 hours postinjection. Images were brought into the same stereotactic space, registered by rigid transformations only, and analyzed using Inveon Research Workplace (IRW) software version 4.1 (Siemens).
Image Analysis
For each PET image, 3D region of interest (ROIs) were drawn over the tumor and other organs of interest guided by the MRI using the IRW 4.1 software. Activity per voxel was converted to Bq/mL using a conversion factor obtained by scanning a cylindrical phantom filled with a known activity of 64Cu to account for PET scanner efficiency. Activity concentration in the ROI was calculated as the mean Bq/mL multiplied by the mass of the ROI assuming a tissue density of 1 g/cc and was decay corrected to the time of injection. Radioactivity in ROIs is presented as %ID/g (mean ± SD, n = 3). The injected dose was calculated from the first image as the mean activity in a ROI of the entire mouse divided by the area of that ROI. The ROI was drawn using a thresholding algorithm (IRW 4.1) to include all voxels with an activity greater than background and removing islands formed within the outline of the mouse. Tumor to brain contrast was measured as the ratio of activity in two ROI, one drawn around the tumor mass delineated by the hyperintense region in the gadolinium (Gd) contrast–enhanced MRI and a second ROI of equal volume placed in a contralateral, nontumor region of brain.
Biodistribution Studies
Mice were injected with EphA2-4B3-NOTA-64Cu (2-3 MBq) intravenously via the lateral tail vein and housed individually for the duration of the experiment. Mice were anesthetized with isoflurane at 24 hours postinjection and sacrificed by exsanguination. Blood was sampled immediately following sacrifice, and organs were harvested, cleaned of excess blood, and weighed. Radioactivity in tissue was counted using a PerkinElmer 2480 Automatic Gamma Counter and presented as %ID/g (mean ± SD, n = 3). The injected dose was calculated from the radioactivity counted in a 10 μL sample of the injected dose.
Results and Discussion
Specific Binding of EphA2-4B3 and EphA2-4B3-NOTA to EphA2
To ensure that the binding affinity of EphA2-4B3 is not altered significantly by NOTA conjugation, binding affinity of EphA2-4B3 and EphA2-4B3-NOTA was measured using a Biacore T200 (GE Healthcare, Buckinghamshire, UK) with a CM5 chip type. Both antibodies were captured to the same level using a mouse IgG capture kit (GE Healthcare, Buckinghamshire, UK) immobilized using amine coupling to 12000RU. Binding affinity was measured using a single-cycle-kinetics protocol with an HBS-EP+ running buffer (GE Healthcare, Buckinghamshire, UK) at a flow rate of 40 μL/min. It was found that there was no significant difference in binding affinity on conjugation of NOTA (see Figure S4 and Table S4, online version only).
PET/MRI, Biodistribution, and Comparative Tumor to Brain Contrast of EphA2-4B3-NOTA-64Cu in a U87 Xenograft Model of Glioblastoma
To investigate the efficacy of an EphA2 mAb as an imaging agent for glioblastoma, we synthesized a conjugate of the mAb (EphA2-4B3) with a multidentate ligand system to bind 64Cu. The ligand system used was 1,4,7-triazacyclononane-1,4,7-triacetic acid (NOTA), which was conjugated to the mAb via reaction of primary amines on the mAb with an isothiocyanate group covalently bound to the NOTA moiety. It has previously been shown that mAb-NOTA-64Cu conjugates show good stability in vivo.45–47 The purified EphA2-4B3-NOTA conjugate was complexed with 64Cu to form the PET tracer EphA2-4B3-NOTA-64Cu.
To investigate the efficacy of EphA2-4B3-NOTA-64Cu, a longitudinal PET/MRI study was conducted using a U87 xenograft model of glioblastoma (Figure 1). Following intravenous injection, mice were imaged immediately with further imaging sessions 6 and 22 hours postinjection. Full-body biodistribution and pharmacokinetics of the tracer were evaluated by ROI analysis and tumor to brain contrast was measured at 6 hours postinjection, in the 18F-FDOPA image and in the Gd contrast–enhanced MRI. At early time points, a large proportion of the tracer is in the blood pool, as can be evidenced by an ROI drawn around the heart in the image. The loss of tracer in the heart follows a single exponential trend indicating minimal retention in cardiac tissue through either specific or nonspecific binding. Uptake in the lungs and kidneys follows the same single exponential trend indicating that (1) tracer presence in these organs is likely due to continued circulation in the bloodstream and (2) clearance of the tracer is not likely to be via renal pathways. Tracer activity in the liver does not follow the same trend as in the heart, and it can be seen that there is significant retention of the tracer in the liver. Similarly, tracer concentration in the spleen increases from 0 to 22 hours. We suggest that retention of the tracer in both the liver and the spleen is due to nonspecific binding by Fc receptors and clearance through the reticuloendothelial system. Tracer concentration at the tumor site increases from 0 to 6 hours (4.03 ± 0.6–8.9 ± 1 %ID/g, n = 3) and decreases from 6 to 22 hours (8.9 ± 1–6.3 ± 0.9 %ID/g, n = 3). It can be seen that delineation of the tumor boundaries is clear compared to an 18F-FDOPA PET/MRI, a Gd contrast–enhanced MRI, and a high-resolution T2-weighted MRI of the same mouse.

PET-MRI and biodistribution of EphA2-4B3-NOTA-64Cu in a U87 xenograft model of glioblastoma. A, Representative maximum intensity projection image of a female NOD/SCID mouse with a xenograft of 105 U87 cells injected into the right striatum 22 hours following injection of the PET tracer EphA2-4B3-NOTA-64Cu. B, Representative images of the brain of a female NOD/SCID mouse with a xenograft of 105 U87 cells injected into the right striatum at 0, 6, and 22 hours postinjection (p.i.) of the PET tracer. C, Region of interest (ROI) analysis of images at 0, 6, and 22 hours p.i. Values are represented as mean ± standard deviation (n = 3). D, Tumor to brain contrast as measured by ROI analysis of a tumor ROI and contralateral brain ROI. Values are represented as mean ± standard deviation (n = 3). E, [18F]FDOPA image of the same mouse 24 hours prior to EphA2-4B3-NOTA-64Cu imaging. F, Gadolinium contrast–enhanced MRI of the same mouse 22 hours p.i. G, High-resolution T2-weighted MRI of the same mouse 24 hours prior to EphA2-4B3-NOTA-64Cu imaging.
For the purpose of an imaging agent, the concentration of tracer at the site of interest should be high enough to be clearly distinguished from the background. In contrast to a therapeutic agent, accumulation in organs that are far from the site of interest will not affect the performance of the imaging agent as this will not affect imaging contrast. In this case, although accumulation of tracer in the liver and spleen is high, it does not affect tumor to brain contrast. It can be seen (see Figure 1D) that tumor to brain contrast is significantly higher than that in the 18F-FDOPA image (p < .01, two-tailed t-test) and is higher than that in the Gd contrast–enhanced MRI.
PET/MRI Imaging, Biodistribution, and Tumor to Brain Contrast of EphA2-4B3-NOTA-64Cu in RN1 and WK1 Xenograft Models of Glioblastoma
The U87 model of glioblastoma is a useful model for preclinical studies as it produces a reproducible, fast-growing, and predictable tumor mass. However, there are problems with how representative this model is compared to the highly infiltrative tumors observed in most patients with glioblastoma. 40 To further investigate the efficacy of EphA2-4B3-NOTA-64Cu as an imaging agent for glioblastoma, a longitudinal PET/MRI study was conducted using RN1 (Figure 2) and WK1 (Figure 3) xenograft models of glioblastoma. Both of these cell lines more closely resemble the disease in humans than the U87 model.

EphA2-4B3 targets an RN1 primary line xenograft model of glioblastoma. A, Representative maximum intensity projection image of a female NOD/SCID mouse with a xenograft of 105 RN1 cells injected into the right striatum 22 hours following injection of the PET tracer EphA2-4B3-NOTA-64Cu. B, Representative images of the brain of a female NOD/SCID mouse with a xenograft of 105 RN1 cells injected into the right striatum at 0, 6, and 22 hours postinjection (p.i.) of the PET tracer. C, Region of interest (ROI) analysis of images at 0, 6, and 22 hours p.i. Values are represented as mean ± standard deviation (n = 3). D, Tumor to brain contrast as measured by ROI analysis of a tumor ROI and contralateral brain ROI. Values are represented as mean ± standard deviation (n = 3). E, [18F]FDOPA image of the same mouse 24 hours prior to EphA2-4B3-NOTA-64Cu imaging. F, Gadolinium contrast–enhanced MRI of the same mouse 22 hours p.i. G, High-resolution T2-weighted MRI of the same mouse 24 hours prior to EphA2-4B3-NOTA-64Cu imaging.

EphA2-4B3 targets a WK1 primary line xenograft model of glioblastoma. A, Representative maximum intensity projection image of a female NOD/SCID mouse with a xenograft of 105 WK1 cells injected into the right striatum 22 hours following injection of the PET tracer EphA2-4B3-NOTA-64Cu. B, Representative images of the brain of a female NOD/SCID mouse with a xenograft of 105 WK1cells injected into the right striatum at 0, 6, and 22 hours postinjection (p.i.) of the PET tracer. C, Region of interest (ROI) analysis of images at 0, 6, and 22 hours p.i. Values are represented as mean ± standard deviation (n = 3). D, Tumor to brain contrast as measured by ROI analysis of a tumor ROI and contralateral brain ROI. Values are represented as mean ± standard deviation (n = 3). E, [18F]FDOPA image of the same mouse 24 hours prior to EphA2-4B3-NOTA-64Cu imaging. F, Gadolinium contrast–enhanced MRI of the same mouse 22 hours p.i. G, High-resolution T2-weighted MRI of the same mouse 24 hours prior to EphA2-4B3-NOTA-64Cu imaging. H, Comparative slices showing tumor contrast by hematoxylin-eosin (H&E)-stained histology, gadolinium contrast–enhanced MRI, and EphA2-4B3-NOTA-64Cu and [18F]FDOPA imaging. The same window level has been applied to the EphA2-4B3-NOTA-64Cu image and the [18F]FDOPA image to illustrate tumor to brain contrast.
Similar to the U87 model, at early time points, the tracer is predominantly in the blood pool for the RN1 and WK1 models. Again, the loss of tracer from the blood pool follows a single exponential and tracer concentration in the lungs and kidneys follows the same trend. Again, as observed with the U87 model, tracer accumulation in the liver and spleen is observed, and we suggest that the same mechanism of nonspecific binding through Fc receptors and clearance through the reticuloendothelial system is responsible. Concentration of the tracer at the tumor site peaks after 6 hours (RN1 = 3.8 ± 1.1 %ID/g, n = 3; WK1 = 10.2 ± 2.1 %ID/g, n = 3) and decreases after 22 hours (RN1 = 2.9 ± 0.7 %ID/g, n = 3; WK1 = 8.2 ± 1.9 %ID/g, n = 3). It can be seen that unlike the U87 model, the tumor is not as homogeneous in shape; however, delineation of the tumor boundaries is clear compared to an [18F]FDOPA PET/MR image, a Gd contrast–enhanced MRI, and a high-resolution T2-weighted MRI of the same mouse. In both cases, tumor to brain contrast is significantly higher than that in the [18F]FDOPA image (RN1 p < .01, WK1 p < .001, two-tailed t-test) and that in the Gd contrast–enhanced MRI (RN1 p < .05, WK1 p < .01, two-tailed t-test).
Of particular interest is comparison between [18F]FDOPA, Gd MRI, and EphA2-4B3-NOTA-64Cu imaging in the WK1 model of glioblastoma. It can be seen (see Figure 3H) that enhancement in the Gd MRI is unclear and results in a potentially blurred delineation of tumor boundaries. Similarly, the low tumor to brain contrast in the [18F]FDOPA image could lead to a misinterpretation of tumor boundaries. In contrast, the boundaries delineated by EphA2-4B3-NOTA-64Cu are more pronounced and correlate well with hematoxylin-eosin–stained histology.
PET/MRI Imaging and Biodistribution of EphA2-4B3-NOTA-64Cu in a U87 Xenograft Model When Nonspecific Binding is Blocked
For a brain tumor imaging agent, accumulation in organs that are not anatomically close to the site of interest is of minimal concern with respect to image contrast. However, to further investigate the potential of an EphA2-specific mAb as a targeted therapeutic, we conducted investigations into the specificity of binding in the liver and spleen. We propose that accumulation of the EphA2-4B3-NOTA-64Cu tracer in the liver and spleen is due to nonspecific binding by Fc receptors. NOD/SCID mice do not naturally express IgG. As such, there is no natural IgG in the bloodstream to reduce the number of vacant Fc receptors in the liver and spleen of these mice. We postulate that the high uptake of the PET tracer EphA2-4B3-NOTA-64Cu in the liver and spleen will be greatly reduced if injected into immunocompetent mice such as a C57Bl/6. To further investigate this, a longitudinal PET/MRI study and an ex vivo biodistribution study were conducted to compare the two models. It can be seen from Figure 4 that there is a stark contrast between the two mice. The maximum intensity projection image at 22 hours (see Figure 4A) shows that the majority of the activity is in the liver and spleen of the NOD/SCID mouse, whereas the majority of activity is in the heart of the C57Bl/6 mouse. This is corroborated by the ex vivo biodistribution data 24 hours postinjection (see Figure 4B), where it can be seen that in C57Bl/6 mice, there is more activity in the blood than in any other organ and significantly more than in NOD/SCID mice (C57Bl/6 = 3.1 ± 1.3 %ID/g, n = 3; NOD/SCID = 0.08 ± 0.008 %ID/g, n = 3; p = .03) and significantly less activity in the spleen (C57Bl/6 = 2.3 ± 1 % ID/g, n = 3; NOD/SCID = 14.4 ± 1.1 %ID/g, n = 3; p = .0003). Furthermore, dynamic analysis of the image data (see Figure 4C) shows the stark difference in the removal of tracer from the blood pool in the two models.

A, Representative maximum intensity projection images of a 12-week-old female C57Bl/6 mouse and a 12-week-old female NOD/SCID mouse 22 hours following intravenous injection of the PET tracer EphA2-4B3-NOTA-64Cu. It is clear that the tracer remains in the bloodstream in the C57Bl/6 mouse far longer than in the NOD/SCID mouse. B, Comparative biodistribution of EphA2-4B3-NOTA-64Cu in C57Bl/6 and NOD/SCID mice 22 hours following intravenous injection. C, Time-activity curves of regions of interest drawn over the heart of C57Bl/6 and NOD/SCID mouse images. The first 30 minutes following intravenous injection of EphA2-4B3-NOTA-64Cu are displayed.
Given the difference between the C57Bl/6 and NOD/SCID model, a longitudinal PET/MRI study was conducted using a U87 xenograft model of glioblastoma in NOD/SCID mice in which the mice received a 1 mg dose of nonspecific IgG intravenously 30 minutes prior to injection of the tracer. This was intended to block Fc receptors and simulate the situation in the C57Bl/6 mouse (Figure 5) without saturating EphA2 receptors in the tumor. The technique of predosing with a bolus of cold tracer has been shown to increase uptake into the tumor when using antibody-based tracers.48,49 However, when using this technique, there is an inherent danger that the targeted receptor sites in the tumor could be blocked if the cold predose is too high. To circumvent this, we used a cold predose of a nonspecific IgG that should bind to Fc receptors, thus reducing the number of receptors available to bind the tracer but leave the targeted EphA2 receptors free.

Blocking nonspecific binding increases tumor accumulation. A, Representative maximum intensity projection image of a female NOD/SCID mouse with a xenograft of 105 U87 cells injected into the right striatum 22 hours following injection of the PET tracer EphA2-4B3-NOTA-64Cu where 1 mg nonspecific IgG had been administered intravenously 2 hours prior to injection of the tracer. B, Representative images of the brain of a female NOD/SCID mouse with a xenograft of 105 U87 cells injected into the right striatum at 0, 6, and 22 hours postinjection (p.i.) of the PET tracer EphA2-4B3-NOTA-64Cu where 1 mg nonspecific IgG had been administered intravenously 2 hours prior to injection of the tracer. C, Region of interest (ROI) analysis of images at 0, 6, and 22 hours p.i. (n = 3). D, [18F]FDOPA image of the same mouse 24 hours prior to EphA2-4B3-NOTA-64Cu imaging. E, Gadolinium contrast–enhanced MRI of the same mouse 22 hours p.i. F, High-resolution T2-weighted MRI of the same mouse 24 hours prior to EphA2-4B3-NOTA-64Cu imaging.
As can be seen in Figure 5C, at early time points, the tracer is again predominantly in the blood pool. The loss of tracer from the blood follows an exponential trend (as evidenced by the loss of activity in the heart). The loss of tracer from the lungs and kidneys again follows the same trend as the heart. In addition, and in contradiction to the U87 model without a blocking dose, the loss of tracer from the liver shows the same trend, and accumulation in the spleen is significantly reduced. It can be seen that by 22 hours, tracer concentration in both the liver (U87 block = 18.6 ± 2.1 %ID/g, n = 3; U87 = 22.4 ± 1.2 %ID/g, n = 3; p = .06, paired, two-tailed t-test) and spleen (U87 block = 14.5 ± 2.9 %ID/g, n = 3; U87 = 24.2 ± 1.2 %ID/g, n = 3; p = .02, paired, two-tailed t-test) is significantly lower than that in the U87 model without a blocking dose. In addition, tracer concentration in the tumor is significantly increased by 22 hours (U87 block = 26.7 ± 6.5 %ID/g, n = 3; U87 = 6.3 ± 0.9 %ID/g, n = 3; p = .04, paired, two-tailed t-test) and is greater than that in any other organ (see Figure 5 and Figure 6). We propose that this is due to increased circulation times as nonspecific binding, and subsequent removal of the tracer from the blood pool, has been blocked. It can be seen that when a blocking dose of nonspecific IgG is administered, delineation of the tumor by EphA2-4B3-NOTA-64Cu is very pronounced.
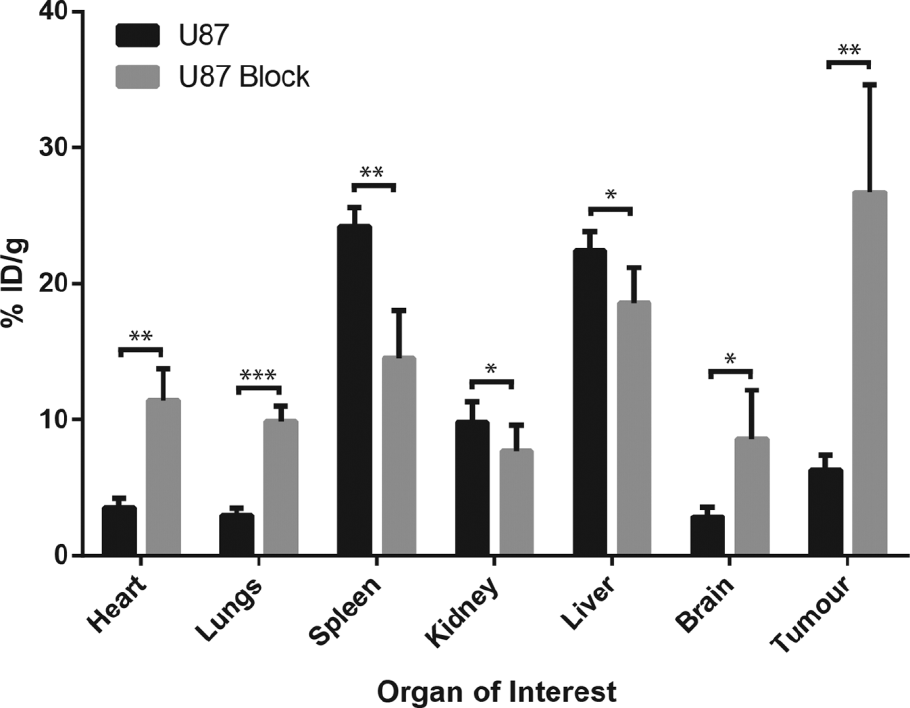
Blocking nonspecific binding increases tumor accumulation. Comparison of tracer uptake between U87 mice and U87 mice given a blocking predose of a cold nonspecific IgG. n = 3 for each group; statistical comparisons performed with a paired, two-tailed t-test (*p < .1; **p < .05; ***p < .01).
Conclusions
There is growing interest in improving image-guided therapy for patients with glioblastoma. PET imaging with highly specific mAbs conjugated to radiometals with a long half-life offers significant clinical potential. Such tracers not only specifically target cancer cells but can also be transported to clinical sites without access to cyclotron and radiopharmacy facilities. This is a significant benefit in a country with a widely spread population such as Australia. In this study, we describe for the first time the efficacy of EphA2-4B3-NOTA-64Cu as a PET tracer for delineating the boundaries of a tumor in glioblastoma compared to the current clinical standards of [18F]FDOPA PET and Gd contrast–enhanced MRI in an intracranial model of glioblastoma. PET/MRI of EphA2-4B3-NOTA-64Cu in U87, RN1, and WK1 models of glioblastoma showed high tumor uptake and higher tumor to brain contrast than both [18F]FDOPA PET and Gd contrast–enhanced MRI. Tumor delineation in all models was also excellent compared to the current clinical standards of [18F]FDOPA PET imaging, Gd contrast–enhanced MRI, and T2-weighted MRI. We showed that high uptake of the tracer in the liver and spleen is significantly reduced in a mouse model that expresses natural IgG and that high liver and spleen uptake can be effectively reduced by administration of a blocking dose of nonspecific IgG. In addition, we showed that tumor uptake can be increased by administration of a blocking dose of nonspecific IgG. To our knowledge, this is the first report of enhanced tumor uptake by the addition of a nonspecific mAb designed to block Fc receptors. Following this work, we suggest that future clinical development of the use of EphA2-4B3-NOTA-64Cu as an imaging agent for glioblastoma is warranted.
Footnotes
Acknowledgments
We would like to thank Nathan Boase and Paul Jamieson for assistance with animal preparation and cell culture and Matthew Smeade for assistance with surface plasmon resonance (SPR) measurements. We thank the team at Radiopharmaceutical Production and Development Centre (RAPID) PET Laboratories, Sir Charles Gairdner Hospital, Perth, WA, Australia, for the production of 64Cu. We thank the team at Queensland PET, Royal Brisbane and Women's Hospital, Brisbane, QLD, Australia, for the production of [18F]FDOPA.
Financial disclosure of authors: This work was supported by the Australian National Health and Medical Research Council (APP1021759); a Rio Tinto Ride to Conquer Cancer grant (RTCC130002) to B.W.S., B.W.D., and A.W.B.; the Australian Research Council Centre of Excellence in Convergent Bio-Nano Science and Technology (CE140100036); and the Australian National Imaging Facility. A.K.W. is the recipient of an Australian Research Council Australian Professorial Fellowship (project number DP110104299). K.J.T. is an Australian Research Council Future Fellow (FT110100284).
Financial disclosure of reviewers: None reported.