
Abstract
Small animal models are crucial to link molecular discoveries and implementation of clinically relevant therapeutics in oncology. Using these models requires noninvasive imaging techniques to monitor disease progression and therapy response. Micro–computed tomography (CT) is less studied for the in vivo monitoring of murine intracranial tumors and traditionally suffers from poor soft tissue contrast, whereas bioluminescence imaging (BLI) is known for its sensitivity but is not frequently employed for quantifying tumor volume. A widely used orthotopic glioblastoma multiforme (GBM) tumor model was applied in nude mice, and tumor growth was evaluated by BLI and contrast-enhanced microCT imaging. A strong correlation was observed between CT volume and BLI-integrated intensity (Pearson coefficient (r) = .85, p = .0002). Repeated contouring of contrast-enhanced microCT-delineated tumor volumes achieved an intraobserver average pairwise overlap ratio of 0.84 and an average tumor volume coefficient of variance of 0.11. MicroCT-delineated tumor size was found to correlate with tumor size obtained via histologic analysis (Pearson coefficient (r) = .88, p = .005). We conclude that BLI intensity can be used to derive tumor volume but that the use of both contrast-enhanced microCT and BLI provides complementary tumor growth information, which is particularly useful for modern small animal irradiation devices that make use of microCT and BLI for treatment planning, targeting, and monitoring.
GLIOBLASTOMA MULTIFORME (GBM) represents one of the most malignant and difficult to treat cancers, and patients have a median survival of less than 12 months. 1 Aggressive treatments using surgery followed by radiotherapy and chemotherapy slow the progression of GBM but extend survival by a year at best and put a heavy burden on a patient's quality of life. Therefore, there is a great need for better treatment approaches to further improve the clinical outcome. The development of new treatment strategies would benefit from orthotopic mouse tumor models that mimic the unique conditions of GBM growth within the brain.2–4 However, these models require robust and sensitive imaging methods to monitor treatment response.
Small animal imaging has emerged in oncology research, and several imaging modalities are now routinely used, including magnetic resonance imaging (MRI), positron emission tomography (PET), and optical imaging (bioluminescence imaging [BLI] and fluorescence imaging), among others. 5 Although, individually, each modality used alone can provide important information, there are physical limitations to each. Therefore, multimodal imaging has become increasingly important to combine the strengths of different techniques; for example, recent preclinical studies have demonstrated the benefits of dual imaging techniques from combined MRI/BLI, 6 PET/computed tomography (CT), 7 and single-photon emission computed tomography (SPECT)/CT. 8 In our study, the complementary use of BLI and contrast-enhanced microCT was investigated in an orthotopic brain tumor model.
BLI is a sensitive noninvasive macroscopic imaging technique that is well suited to the measurement of treatment response because it provides quantitative spatial and temporal information on tumor growth within living mice and can be used for intracranial brain tumor models.9,10 BLI refers to light produced by an enzymatic reaction of the Photinus pyralis luciferase enzyme with its substrate (luciferin) in the presence of oxygen and adenosine triphosphate (ATP). BLI is a highly sensitive technique due to the absence of a signal in cells not expressing luciferase.11,12 However, BLI results in a two-dimensional (2D) diffuse surface image, making tumor volume reconstruction challenging.11,13 Therefore, combining BLI with other imaging modalities that provide complementary information such as tumor volume can enhance the amount of quantitative data obtained needed to produce accurate treatment planning models to measure therapeutic efficacy.
To augment 2D BLI data, other noninvasive three-dimensional (3D) imaging techniques can be used, such as CT, MRI, and 3D ultrasonography. MicroMRI is probably the commonly used imaging tool because it provides detailed anatomic and physiologic information on brain tumor growth in preclinical models.14–16 Several studies have suggested a strong correlation of combined BLI and MRI measurements in small animal models of brain tumors.17–19 However, new small animal image-guided microirradiation devices are becoming commercially available that rely on CT information rather than MRI. 20 The use of CT imaging is convenient in these applications because it more closely resembles the current practice of clinical radiotherapy and the x-ray tube used for irradiation can also be used for the low-energy imaging component.
To our knowledge, there is no currently available literature on the use of BLI as a surrogate for tumor volume measurement when compared to contrast-enhanced microCT imaging in an orthotopic mouse brain tumor model. In this study, we aimed to assess the ability of contrast-enhanced microCT to accurately delineate tumors and to evaluate the correlation between 2D BLI intensity and tumor volume in an orthotopic mouse brain tumor model.
Material and Methods
Intracranial Tumor Injections
Preparation of Cells for Injection
U-87MG-Luc2 is a widely used glioma cell line transduced with a lentiviral vector expressing firefly luciferase (Perkin Elmer, Waltham, MA). Complete medium (Minimum Essential Medium containing 10% fetal calf serum, 1% L-glutamine, 1% nonessential amino acids, and 1% sodium pyruvate) was aspirated from cultured flasks containing U-87-MG-luc2 cells grown to approximately 70% confluence. Cells were washed with phosphate-buffered saline (PBS) and then trypsinized with 0.5% trypsin for 3 minutes. Complete medium was added to neutralize the enzymatic activity of trypsin. Then resuspended cells were centrifuged at 150g for 5 minutes and resuspended in PBS. An aliquot of cells was aspirated and counted with a cell counter. The cells were diluted in PBS to a concentration of approximately 20,000 cells/μL and kept on ice.
Animal Surgery
Immunocompromised CD1 nu/nu mice (n = 33, 25 g) were used in this study. Animal work was performed in accordance with national guidelines. All mice were anesthetized with a gas mixture of air and 4% isoflurane prior to intracranial implantation. During the surgery, mice were kept under 1.5 to 2% isoflurane. Buprenorphine (Temgesic, 0.1 mg/kg) was administered subcutaneously as an acute analgesic. Briefly, after a midline scalp incision, by visual inspection, the bregma was identified. The guide screw entry was then marked at a point 3 mm posterior to the bregma and 2 mm right lateral. Mice were secured in a stereotactic frame, and a craniotomy was created 3 mm deep from the cortical surface. Five-microliter cells resuspended in PBS (100,000 cells) were aspirated into a Hamilton syringe attached to the frame, which was then injected into the brain. The needle was slowly removed 5 minutes after the injection to prevent any reflux of the cells. The skull was covered with skin, and skin glue was used to close the wound. We also ensured that the edges of the wound did not cross. Carprofen (Rimadyl) was administered as a postoperation analgesic at a concentration of 2 to 4 mg/kg in the drinking water.
In Vivo BLI
BLI was performed using the Optix MX2 system (ART Inc., Saint-Laurent, QC).* Mice were anesthetized with a gas mixture of air and 4% isoflurane (reduced to 2% during imaging) and were injected intraperitoneally with 150 mg/kg of D-luciferin (PerkinElmer, Waltham, MA) in PBS 12 minutes prior to imaging. Mice were placed in the BLI scanner with the crown of the skull located in the focal plane of the camera. Image acquisition was performed in a raster scan model with a scan resolution of 1 mm over the whole head with a fixed integration time of 1 second. BLI was performed three times/week. Images were analyzed using Optix OptiView version 2.01 (ART Inc.). For all mice, the total photon flux (photons/s) was measured from a fixed region of interest (ROI) of 110 mm2.
CT Imaging
MicroCT imaging was performed using the small animal micro-IR (X-RAD 225Cx, Precision X-ray Inc., North Branford, CT), which has been described extensively in earlier work.21,22 A high-resolution 80 kVp, 2.5 mA imaging protocol with an acquisition rate of 5 frames/s and a gantry rotation of 1 revolution/min was employed for all imaging. Image projections were acquired and reconstructed using the Feldkamp filtered backprojection (Pilot v 1.1.18, Precision X-ray Inc.), resulting in a final reconstructed isotropic pixel spacing of 102 μm. Mice were anesthetized with a gas mixture of air and 4% isoflurane (reduced to 2% during imaging).
To enhance soft tissue contrast in the mouse brain, an exogenous iodinated agent (Omnipaque 350, GE Healthcare, Little Chalfont, UK) was injected via the tail vein immediately prior to microCT imaging, and 150 μL of the contrast agent was injected undiluted. The contrast agent is viscous at room temperature, so it was warmed in a hot water bath and injected slowly over 1 minute. Insurance of a proper injection was confirmed by visualizing a dark coloring (high CT density) in the kidney and bladder. Tail vein injection was performed using a custom intravenous line made of a 30-gauge needle connected to 10 cm of PE-10 tubing (Smiths Medical ASD, Weston, MA). Contrast-enhanced CT imaging was planned once per week, but on average, only two to four images per animal were achieved due to failed tail vein injections or animal welfare considerations.
Image analysis of the microCT scans was performed using OsiriX (Pixmeo, Geneva, Switzerland). 3D contours were drawn freehand along the perimeter of the tumor, visualized by adjusting the window and level contrast. If no tumor could be distinguished, no contours were drawn. For every contrast-enhanced microCT image, contouring was repeated two additional times serially (i.e., one mouse after another) such that any memory of the previous contour could not be retained or bias the results to determine the intraobserver variability. For each mouse, the total volume contained within the three tumor contours was measured, averaged, and reported in cubic millimeters along with the coefficient of variance (COV), which is the standard deviation divided by the mean. In addition, a 3D mask was obtained from the 3D contours and evaluated in Matlab (R2012b, The MathWorks, Natick, MA) for the overlap ratio (OR) of the three contoured regions. The average pairwise OR (1 vs 2, 1 vs 3, and 2 vs 3) was calculated from the percent overlap region divided by the union region of the two contours, such that the OR is restricted to 0 for no location agreement and 1 for perfect location agreement. For each of the three contours, the center of mass of the 3D mask in the coronal plane of the tumor was determined, averaged, and recorded for later comparison with histologic sections.
Histologic Analysis
Mice were sacrificed by cervical dislocation, and the brains were excised. Cryostat sections (7 μm) were made by embedding the brains in Tissue-Tek OCT compound and frozen at −25°C. The sections were fixed in 4% formaldehyde and stained with hematoxylin and eosin (H&E).
To assess the ability of contrast-enhanced microCT to determine tumor volume, the central tumor cross-sectional area calculated via the previously mentioned delineated 3D masks was compared to the central tumor cross-sectional area determined by histologic delineations of coronal sections. Central tumor regions were identified on serially sectioned H&E slices and digitally scanned at 600 dpi (PIXMA MP240, Canon, Japan). ImageJ (1.44p, National Institutes of Health, Bethesda, MD) was used to draw contours around the tumor to determine the tumor area on each slide. For each mouse, the 2D tumor areas of at least four serially sectioned slices were averaged and the standard deviation was recorded.
Results and Discussion
Orthotopic mouse models are crucial to assess the efficacy of new anticancer treatments. Tumor growth and volume are important metrics in this determination. In this study, we investigated the use of contrast-enhanced microCT combined with BLI in intracranial glioblastoma. All mice (n = 33) survived the stereotactic surgical procedure, and brain tumors could be visualized macroscopically in 32 of 33 mice (Figure 1A); that is, only one mouse did not develop a tumor, likely due to unsuccessful tumor implantation. Histopathologic analysis (H&E staining) of xenografts derived from U87-MG-Luc2 cells revealed a relatively well-circumscribed pattern of tumor growth (Figure 1B) that is typically observed in this model. 20

A, A photographic image of the excised intact mouse brain showing the delineation of a U87-luc glioma tumor (blue dots). B, A histologic hematoxylin-eosin (×4 original magnification) section of the same tumor.
Tumor growth was monitored noninvasively and longitudinally principally by BLI and periodically by contrast-enhanced CT. Although the onset of disease (measured in days) differed between mice, a consistent increase in BLI signal over time was observed in all tumor-bearing mice (Figure 2A). An example of the increasing BLI intensity in time for a single representative mouse is shown in Figure 3. An exponential fit of the average of the BLI intensity data for mice from 14 days postinjection revealed that there was an average BLI signal doubling time of 7 days (Figure 2B). However, as can be seen from the data, there was considerable variability in absolute BLI intensity among mice since the onset of the disease differed; this variability had been previously observed by Maes and colleagues, who concluded that the experimental variability of the surgical procedure could result in a leakage of tumor cells through the ventricular system. 23
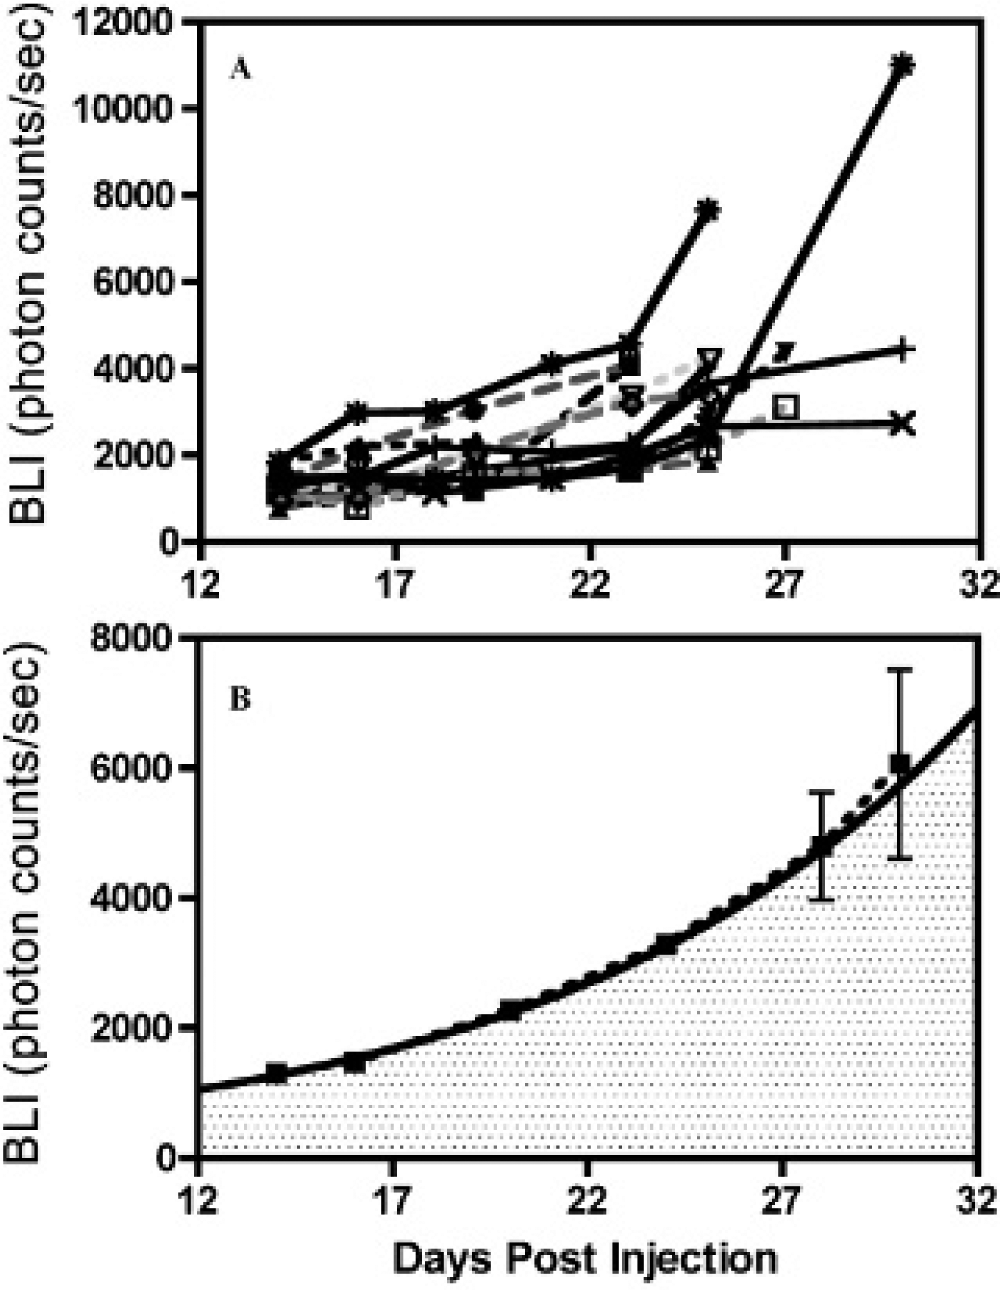
A, The total bioluminescence imaging (BLI) intensity for individual mice (n = 13) with respect to days postinjection. B, The average of the individual BLI intensities and an exponential fit beginning at 14 days postinjection with a constant m = 340 ± 50, and k = 0.092 ± 0.007 in y = m*exp(k*x), where y is the BLI intensity and x is in days postinjection.

Two-dimensional bioluminescence images of the same mouse at different days tumor implantation with the same acquisition time and binning expressed as photons/s/mm2.
Using microCT imaging, mid- to late-stage tumors could be visualized and contoured in all cases where contrast agent was administered successfully. Figure 4A shows a transverse plane of a microCT slice that illustrates the uptake of contrast in a tumor-bearing mouse and reveals the three manually delineated contours overlaid with one another in red, green, and blue. In the absence of contrast agent, tumors were not visible and no delineation could be made. The corresponding BLI and a representative histologic slice are presented next to the contrast-enhanced microCT image (Figure 4, B and C). Calculated CT tumor volumes significantly correlated with BLI intensity values (n = 33, r = .85, p = .0002) (Figure 5A). A linear fit between BLI intensity and CT tumor volume reveals that with BLI intensity below 1,000 (photons/s), the tumor cannot be visualized in contrast-enhanced CT. Figure 5B shows ORs and the COV for the mice tumor volumes, calculated by contrast-enhanced microCT. A natural log and exponential function were fit to the OR and COV data, respectively, which best illustrates that at increasing tumor volumes, better agreement in size and location can be achieved. The average COV and OR for the group were 0.11 and 0.84, respectively. An OR of 0.84 is considered good in radiotherapy and is similar to a 0.85 OR, which was recently reported between manually delineated MRI of brain tumors compared to model-based generated contours in patients. 24

The same mouse imaged with computed tomography (CT), bioluminescence imaging (BLI), and its histology all in the same orientation. A is a reconstructed contrast-enhanced microCT image slice showing the repeated contouring of the tumor in green, blue, and red; B is the bioluminescent image of the same mouse, whereas C is the hematoxylin-eosin (H&E) histologic section showing the manually contoured tumor.

A, Correlation between bioluminescence (BLI) intensity and computed tomography (CT) tumor volume and the linear fit to data. B, Confidence in the contrast-enhanced tumor volumes expressed via the coefficient of variance (COV) and an overlap ratio (OR), indicating the uncertainty in the volume measurement and uncertainty in the location of the tumor, respectively.
The central tumor cross-sectional area derived from the delineated contrast-enhanced microCT was quantitatively compared to the same tumor area derived by histopathologic delineation on H&E-stained tumor sections and significantly correlated with a Pearson coefficient (r) = .88, p = .005, meaning that tumor delineations in contrast-enhanced microCT are consistent with histologic findings (Figure 6). A linear regression of the histologically and contrast-enhanced microCT-derived tumor size reveals a slope of 0.8, meaning that histopathologic sections were on average 20% smaller than tumor regions obtained from the CT data, which could be related to extraction of water during fixation or freezing of tissue. 25

Correlation between the central tumor cross-sectional area determined via contrast-enhanced microCT and the same area delineated via histologic sectioning across a range of tumor sizes. H&E = hematoxlyin-eosin.
Evaluation of quantitative BLI using a luciferase-expressing cell line can be challenged by many factors, including the depth of signal, diet, acquisition time, instrumentation, loss or growth of hair, level of promoter activity controlling luciferase, hemorrhage, and necrosis. 26 Although the majority of these factors can be reliably controlled, some factors, such as tumor depth or necrosis, cannot; that is to say, although the surgical procedure is standardized, tumors may grow differentially beneath the surface, which may decrease the correlation between tumor volume and BLI intensity. In a separate orthotopic brain tumor model, Maes and colleagues found necrosis in tumor volumes exceeding 100 mm3, but this had little influence on the linear relationship between in vivo BLI and tumor volume. 23 In our orthotopic tumor model, we did not observe any necrotic regions in the histologic sections. Due to the location of these brain tumors, if these animals are left untreated, they will die from intracranial pressure before developing massive necrosis, in contrast to subcutaneous models, where tumors may continue to develop into larger volumes, leading to an increase in necrotic area. 23
In our model, tumor establishment was detected by BLI at earlier time points compared to the contrast-enhanced CT imaging based on at least two consecutive increases in BLI intensity measured at 3-day intervals, indicating its higher sensitivity. This is in accordance with other studies where BLI was reported to be a highly sensitive method by which to identify the establishment of the tumor early after implantation or in spontaneous tumor models 9 and to monitor tumor growth in response to therapy.10–12 A strong correlation between tumor volume as measured by microCT and quantitative BLI signal was observed, indicating that BLI can be used as a surrogate for CT volume.
Although MRI is considered the standard imaging modality for preclinical intracranial tumors, recent reports have demonstrated that the accuracy of intracranial brain tumor volumes derived from CT imaging is comparable to that of MRI in both ex vivo 27 and in vivo 28 settings. The latter study showed a strong correlation between the CT-and MRI-derived tumor volumes (r = .86). 28 Unlike MRI, CT suffers from poor soft tissue contrast and requires the use of exogenous contrast agents, especially in tissues such as brain. However, microCT imaging is a relatively inexpensive imaging technique, is fast, and can achieve high spatial resolutions smaller than 100 μm3.29,30
Here we show that contrast-enhanced microCT is an achievable and sensitive technique to accurately delineate manually intracranial brain tumors across a range of tumor volumes. Moreover, microCT can also be used in patient-derived xenograft studies, which do not express luciferase. The current study strengthens the limited available data regarding the use of microCT for the in vivo monitoring of murine intracranial brain tumor research. The two imaging modalities used in this study can complement one another by using BLI to monitor tumor growth at frequent and early-stage intervals and contrast-enhanced CT to target, measure, and be used in dedicated small animal treatment planning software that makes the use of CT data to initiate dose calculations similar to those used in clinical practice. 31 Both modalities may be used to achieve intensity-modulated and image-guided adaptive radiotherapy in preclinical models, which will further increase the utility from preclinical models, facilitating efficient translation to the clinical trials.
Footnotes
Acknowledgments
We would like to thank Nick van Goethem and Denise Hermes (University of Maastricht) for their assistance with intracranial surgery.
Financial disclosure of authors: This work was supported by an European Research Council under the European Community Seventh Framework Program (FP7/2007-2013)/ERC Grant 208259 (to M.V.). Financial support for the purchase and operation of the micro-IR was provided by a Marie Curie grant (PIRG03-GA-2008-230911), a ZonMW grant (40-00506-98-9019), and the GROW Research Institute. P.V.G. is supported by a PGSD3 scholarship from the Natural Sciences and Engineering Research Council of Canada (NSERC), and S.Y. was supported by a Technology Transfer Grant from the European Society for Radiotherapy and Oncology (ESTRO).
Financial disclosure of reviewers: None reported.
*
The Optix system uses a photomultiplier tube (PMT) to detect optical photos of 450 to 900 nm in wavelength; this differs from other BLI devices that report higher detection counts, including the Xenogen IVIS Lumina System (Xenogen Corp., Alameda, CA), which is based on charge-coupled device (CCD) technology.