
Abstract
To investigate the relationships between tumor heterogeneity, assessed by texture analysis of [18F]fluorodeoxyglucose–positron emission tomography (FDG-PET) images, metabolic parameters, and pathologic staging in patients with non-small cell lung carcinoma (NSCLC). A retrospective analysis of 38 patients with histologically confirmed NSCLC who underwent staging FDG-PET/computed tomography was performed. Tumor images were segmented using a standardized uptake value (SUV) cutoff of 2.5. Five textural features, related to the heterogeneity of gray-level distribution, were computed (energy, entropy, contrast, homogeneity, and correlation). Additionally, metabolic parameters such as SUVmax, SUVmean, metabolic tumor volume (MTV), and total lesion glycolysis (TLG), as well as pathologic staging, histologic subtype, and tumor diameter, were obtained. Finally, a correlation analysis was carried out. Of 38 tumors, 63.2% were epidermoid and 36.8% were adenocarcinomas. The mean ± standard deviation values of MTV and TLG were 30.47 ± 25.17 mL and 197.81 ± 251.11 g, respectively. There was a positive relationship of all metabolic parameters (SUVmax, SUVmean, MTV, and TLG) with entropy, correlation, and homogeneity and a negative relationship with energy and contrast. The T component of the pathologic TNM staging (pT) was similarly correlated with these textural parameters. Textural features associated with tumor heterogeneity were shown to be related to global metabolic parameters and pathologic staging.
LUNG CANCER is a leading cause of cancer-related death worldwide in both men and women. Most often lung cancer occurs as non–small cell lung carcinoma (NSCLC). 1 After the initial diagnosis, accurate staging of NSCLC using computed tomography (CT) or positron emission tomography (PET)/CT with [ 18 F]fluorodeoxyglucose (FDG) is crucial for determining the appropriate therapy. Despite upgrades in imaging technologies and treatment over the past two decades, the improvement in survival remains modest, with a 5-year global survival rate as low as 16%, 2 whereas untreated lung cancer patients live 7.15 months after diagnosis. 3
Because FDG is a glucose analogue, tumoral metabolism can be assessed by PET/CT. Usually, diagnosticians use a semiquantitative parameter, the maximum standardized uptake value (SUVmax), to characterize the tumoral lesion. 4 In addition, although not routinely used, global or volume-based semiquantitative metabolic parameters of the primary tumor, such as mean standardized uptake value (SUVmean), metabolic tumor volume (MTV), and total lesion glycolysis (TLG) (given as MTV × SUVmean), can be easily obtained from postprocessed images. These parameters provide a more accurate assessment of the tumor burden, with potentially higher predictive and prognostic value than SUVmax for lung tumors.5–7
Unlike SUVmax, which measures FDG concentration in a single voxel of a metabolically active tumor, global semiquantitative parameters take into account all voxels inside the tumoral volume, thus probing a more general view of the tumor. Their drawback is the lack of a standardized method for volume definition, although several segmentation algorithms show good performance.8,9
On the other hand, the biological heterogeneity of the tumors is an important factor implicated in poor treatment response, a higher chance of developing metastasis, and shorter progression-free and overall survival.10–12 An explanation is that tumor heterogeneity originates with several factors at molecular, cellular, and physiologic levels. Some of these factors are cell proliferation and angiogenesis rates, hypoxia, receptor distribution, and metabolism, which have a nonhomogeneous spatial distribution in tumor volume.13,14 In recent years, there has been considerable effort in the medical imaging community to obtain correlations between image features and tumor heterogeneity.15–18 An approximation to this issue is the texture analysis because image texture gives us information about the spatial arrangement of voxel intensities (i.e., the spatial distribution of radiotracer) in an image or a selected region.
The metrics or features obtained by texture analysis can be of first, second, or higher orders. First-order features are statistics calculated from the image pixel intensity distribution, such as variance and mean, and do not consider pixel neighbor relationships. Second-and higher-order features measure the relationships between groups of two or more pixels in the image and reflect the underlying spatial variation of voxel intensities, providing a measure of the image heterogeneity. They can be computed from gray-level co-occurrence matrices. These matrices determine how often (i.e., the probability) a pixel of intensity, i, finds itself within a certain relationship to another pixel of intensity, j. Formally, given a two-dimensional (2D) image f(x, y) with a set of N discrete intensity levels, the co-occurrence matrix Pd (i, j) is defined such that its (i, j)th entry is equal to the number of times that f(x1, x2) = i and f(x2, y2) = j, where (x2, y2) = (x1, y1) + (dcosθ, dSinθ), and which are a distance d apart. This yields a square matrix of dimension equal to the number of intensity levels in the image, for each distance d and orientation θ. Second-order features based on co-occurrence matrices include entropy, energy, contrast, homogeneity, and correlation.19,20 The parameters energy and entropy are defined by the equations that follow:

For instance, entropy and energy features assess the spatial heterogeneity in the radiotracer uptake. Entropy measures the randomness of the pixel distribution in the image; it will take a higher value for a more random distribution. Energy measures the homogeneity in an image, where higher values mean greater uniformity of the gray-level values in the co-occurrence matrix. 15 In short, the higher the entropy and the lower the energy, the higher the heterogeneity of the gray-level distribution of the tumor image. On the other hand, contrast relates to the dynamic range of intensity levels in an image and the level of local intensity variation, homogeneity represents the uniformity of the co-occurrence matrix, and correlation is a measurement of gray-tone linear dependencies. 17 Similarly, this procedure can be extended to three-dimensional (3D) images.
In NSCLC, researchers have described relationships between textural parameters assessed in CT or PET images and metabolic parameters such as SUVmax and SUVmean with survival and treatment response.21,22 However, the relationship between textural features assessed in PET images with volume-based (MTV and TLG) analysis and tumor stage has not yet been established. Even though, in other tumors, such as esophageal carcinoma, this relationship has been shown. 23 Therefore, the objective of this study was to analyze the relationship between tumor heterogeneity assessed by 3D texture analysis of the metabolic parameters of PET images and pathologic staging in patients with NSCLC.
Methods
Patients
Thirty-eight patients (34 men and 4 women) undergoing combined whole-body FDG-PET/CT between January 2007 and December 2011 were included in the study. Patients fasted for at least 4 hours before the PET/CT examination and had blood glucose levels less than 160 mg/dL prior to an intravenous administration of approximately 370 MBq of FDG.
All patients had a resectable tumor up to stage IIIA. After surgery, tumor size (cm) according to the largest diameter of the specimen and pathologic staging (pT, pN, and integrated TNM stage) were assigned according to the seventh edition of the American Joint Committee on Cancer (AJCC) TNM classification. 24 Data analysis was carried out after approval by the Institutional Review Board.
PET/CT Image Acquisition
Patients underwent FDG-PET/CT scans using an integrated PET/CT scanner (Discovery STE 16, GE Healthcare) at the Nuclear Medicine Department of the University General Hospital of Ciudad Real. Prior to PET acquisition, helical CT was performed from the head to the proximal thigh to provide attenuation correction, with acquisition parameters for the CT of 120 kV and modulated 80 mA. No oral or intravenous contrast agents were used.
Emission scans from the head to the proximal thigh were acquired at 60 to 90 minutes after FDG administration. Images were acquired in 3D mode, 3 minutes per table position. PET images were reconstructed using CT for attenuation correction with an ordered subset expectation maximization iterative reconstruction algorithm supplied by the scanner manufacturer. The PET and CT slice thickness was 3.8 mm.
Lesion Segmentation
The PET images in DICOM format were transferred to 3D SLICER software (Harvard University, Cambridge, MA). 25 In the visualization tools of this software, a nuclear medicine specialist detects the primary tumoral lesion, and on the basis of this localization, the regions equal to or greater than SUV 2.5 were selected to automatically delineate the volume of interest (VOI). All parameters were subsequently extracted from this delineated volume (Figure 1).
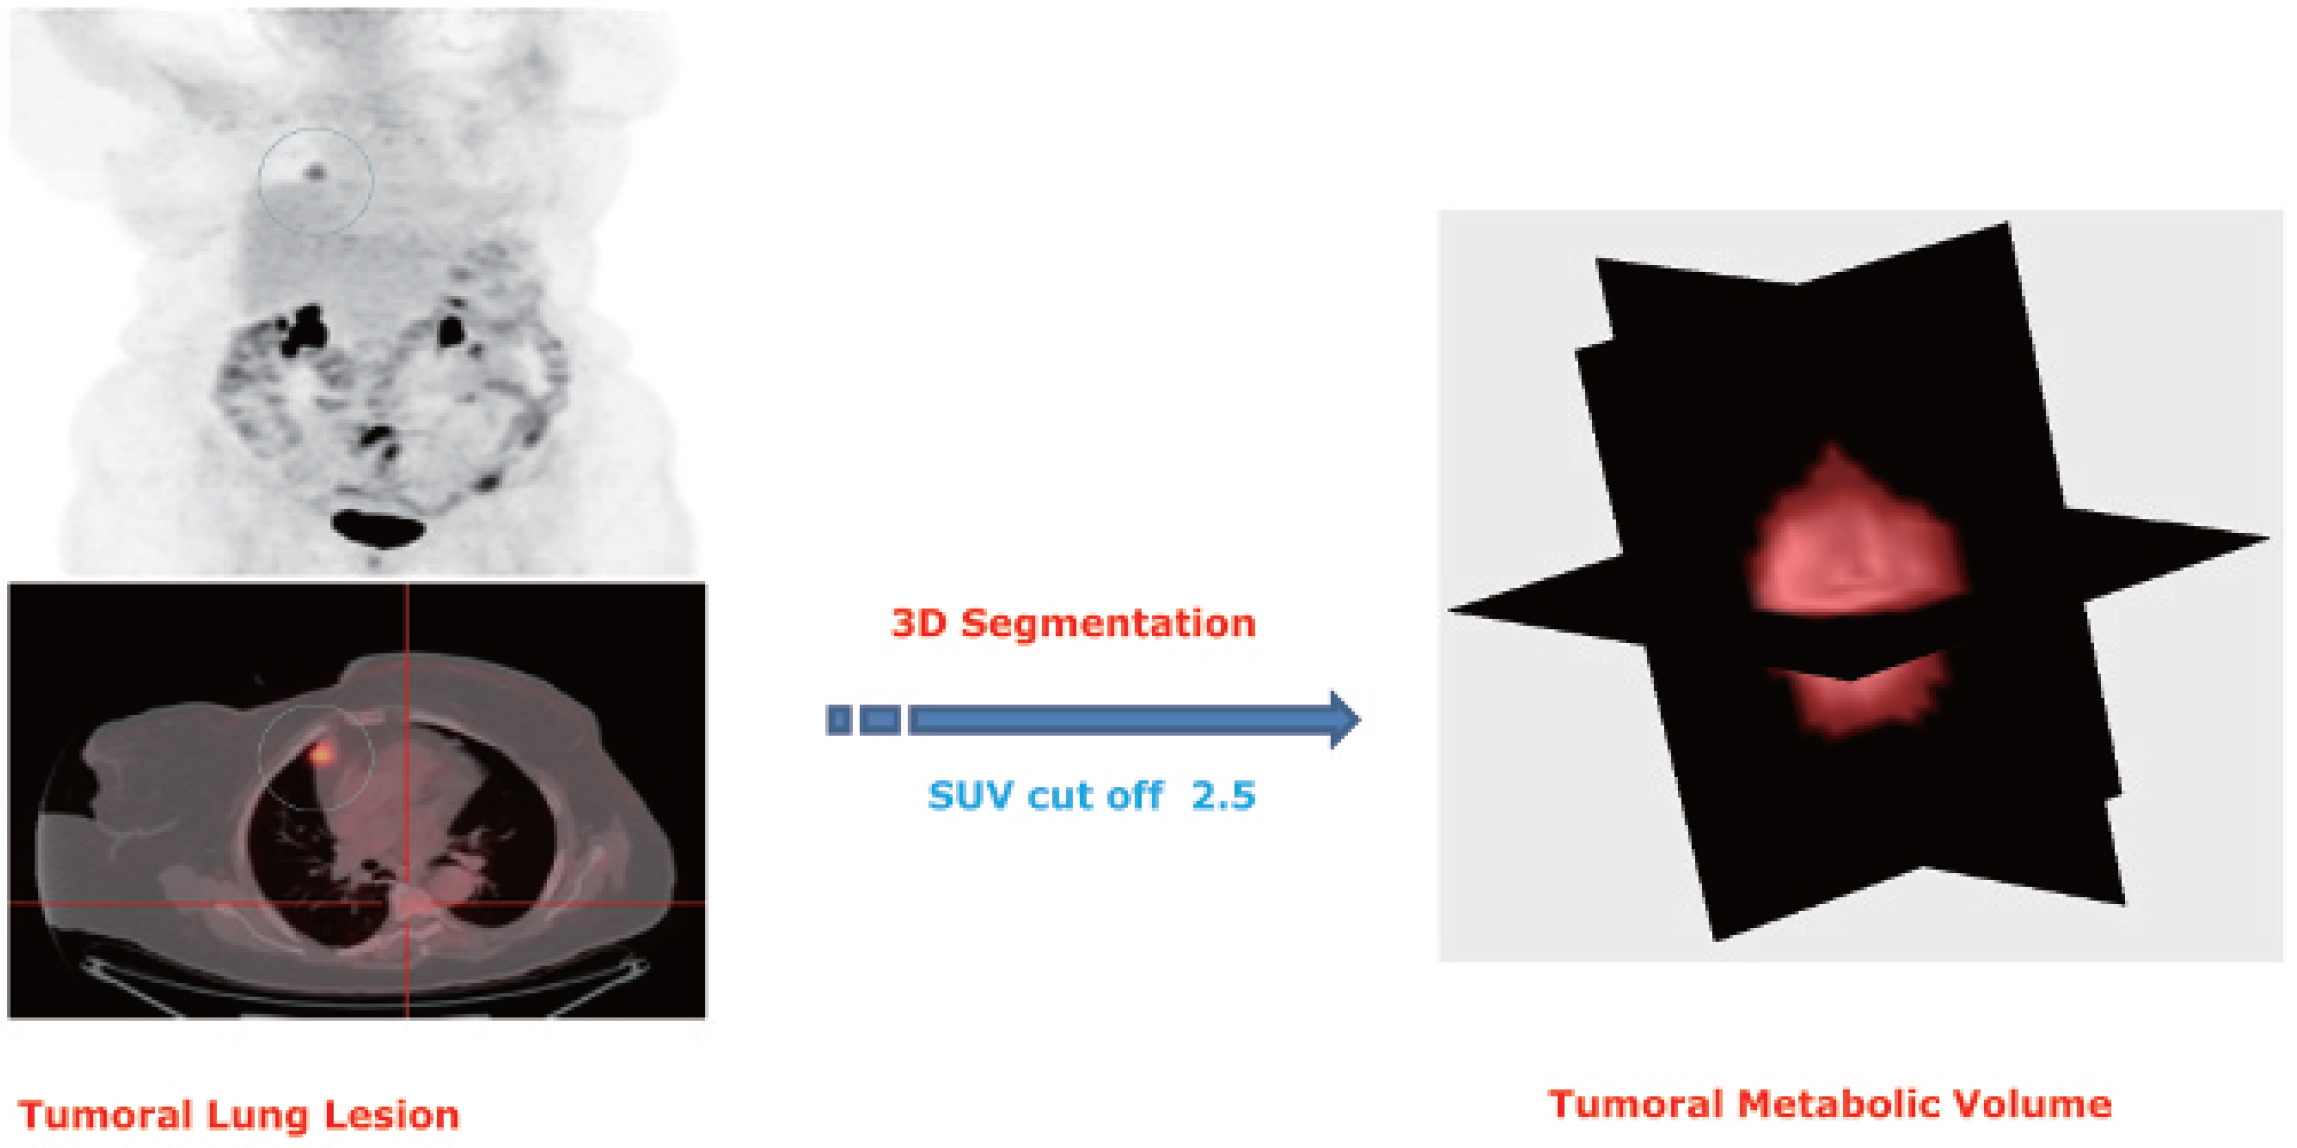
PET/CT segmentation of the lesions. From the PET/CT study, the metabolic tumor volume was segmented by using a standardized uptake value (SUV) cutoff of 2.5. From these volumes, all second-order textural features and metabolic parameters were extracted.
Metabolic Parameters
By using the same software, semiquantitative metabolic parameters of the primary tumor, such as maximum SUVmax (g/mL), SUVmean (g/mL), and MTV (i.e., the tumoral volume in milliliters obtained by using a SUVmax cutoff of 2.5), were obtained. TLG (g), given as MTV × SUVmean, was also calculated. FDG uptake was quantified using the expression given below:

Texture Analysis
VOI was transferred from 3D SLICER to DICOM format, and then second-order 3D textural features were extracted from the segmented VOI using MaZda software (Lodz University of Technology, Lodz, Poland). 26
The MaZda software was configured to evaluate the texture at distance of one voxel (d = 1) at 13 different angles θ; because there is a textural feature value per angle, the final textural feature value was an average over all directions. Using this method, we obtained five textural features: energy, entropy, contrast, correlation, and homogeneity.
Statistical Analysis
We performed statistical analysis using SPSS for Windows version 19.0 (IBM, Armonk, NY). A Pearson correlation test assessed the relationship between the continuous variables (textural features of the PET images and metabolic parameters). We also performed linear regression. To analyze the correlation between textural parameters and categorical variables (TNM classification, histologic type, and AJCC stage), we used the nonparametric Spearman correlation test. All comparisons were two-sided, with statistical significance assessed at p < .05.
Results
Thirty-eight patients with NSCLC up to IIIA stage were assessed (34 men and 4 women, with a mean age of 64.4 ± 8.3 years).
Pathologic Characteristics and Metabolic Parameters
Of the primary tumors, 24 (63.2%) were epidermoid and 14 (36.8%) were adenocarcinomas. The number of patients with tumor stage IA, IB, IIA, IIB, or IIIA were 4, 16, 8, 4, and 6, respectively. Their demographics and pathologic stage are summarized in Table 1.
Patient Characteristics and Disease Stage
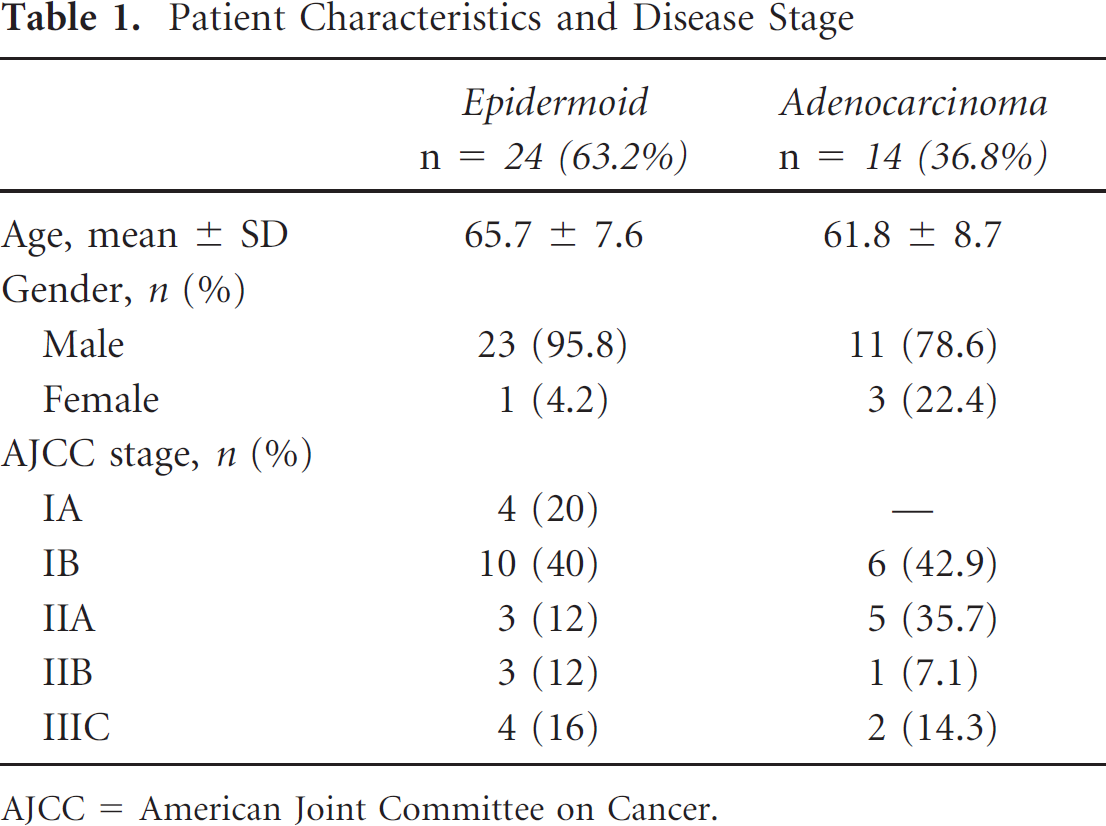
AJCC = American Joint Committee on Cancer.
Mean ± standard deviation values of tumoral size, SUVmax, SUVmean, MTV, and TLG were 3.63 ± 1.51 cm, 13.85 ± 7.25 g/mL, 5.81 ± 1.98 g/mL, 30.47 ± 25.17 mL, and 197.81 ± 251.11 g, respectively. The distribution of pathologic and metabolic variables, together with the five textural features for each patient, is shown in Table 2. No statistically significant differences were found between the mean values of the tumor size, AJCC stage, and metabolic parameters between adenocarcinomas and epidermoid tumors. However, adenocarcinomas had a mean value of energy and homogeneity lower and higher(p = .027 and p = .047, respectively) than epidermoid tumors.
Summary of Patients' Demographics, Global Metabolic Parameters, and Textural Features of Primary Tumors

Ad = adenocarcinoma; AJCC = American Joint Committee on Cancer; MTV = metabolic tumor volume (cm3); SCC = squamous cell carcinoma; SUV = standardized uptake value; TLG = total lesion glycolysis (g).
The SUVmax and SUVmean were correlated with the MTV and TLG (r = .424, p = .008; r = .640, p < .0001 and r = .423, p = .008; r = .643, p < .0001, respectively). The MTV and TLG were correlated (r = .934, p < .0001), as well as the SUVmax and SUVmean (r = .931, p < .0001).
Correlation between Texture and Metabolic Parameters
There was a positive relationship of all metabolic parameters (SUVmax, SUVmean, MTV, and TLG) with entropy, correlation, and homogeneity and a negative relationship with energy and contrast. Detailed values are given in Table 3. Linear regression fit of the usual metabolic parameters (SUVmax and SUVmean) to the global metabolic (TMV and TLG) parameters, entropy, and energy is shown in Figure 2 and Figure 3, respectively.

Linear regression for energy, entropy, and contrast with tumoral size. Linear regression showed a negative correlation between metabolic tumor volume, tumor size, and energy and contrast (r = −.413, p = .009 and r = −.461, p = .004, respectively). A positive correlation between tumor size and entropy (r = .570, p < .0001) was observed.

Linear regression for energy and entropy with SUVmax and SUVmean. Linear regression showed a positive correlation between SUVmax and SUVmean with entropy (A and B); r = .486, p = .002 and r = .492, p = .002, respectively. C and D show a negative correlation of the same two metabolic parameters with energy; r = −.465, p = .003 and r = −.479, p = .002, respectively.
Correlations between Global Metabolic Parameters and Textural Features of the Primary Tumors

MTV = metabolic tumor volume (cm3); SUVmax = mean standardized uptake value; SUVmean = mean standardized uptake value; TLG = total lesion glycolysis (g).
Numbers indicate Pearson coefficient; p values are inside parentheses.
Correlation between Textural Parameters and Tumor Stage
Tumoral size was correlated with energy, contrast, correlation, entropy, MTV, and TLG (r = −.418, p = .009; r = −.461, p = .004; r = .432, p = .007; r = .573, p < .0001; r = .596, p < .0001; r = .500, p = .001, respectively). The linear regressions for energy, entropy, and contrast are shown in Figure 4.

Linear regression for energy and entropy with metabolic tumor volume (MTV) and total lesion glycolysis (TLG). Linear regression showed a positive correlation between MTV and TLG with entropy (A and B); r = .904, p < .0001 and r = .842, p < .0001, respectively. C and D show a negative correlation between both global metabolic parameters with energy; r = −.627, p < .0001 and r = −.578, p < .0001, respectively.
A statistical correlation between the pT and energy, contrast, entropy, and MTV (r = −.376, p = .02; r = .319, p = .05; r = .360, p = .026; r = .376, p < .02) was found, but not between remaining AJCC components and textural or metabolic parameters.
However, by removing from the sample those patients with a low tumoral size but a high pT stage, according to the tumor location, we obtained a correlation between AJCC stage and textural (energy, homogeneity, and entropy) and metabolic (MTV and TLG) parameters. On the other hand, pN becomes related to all five textural features and to MTV and TLG (Table 4 and Figure 5).
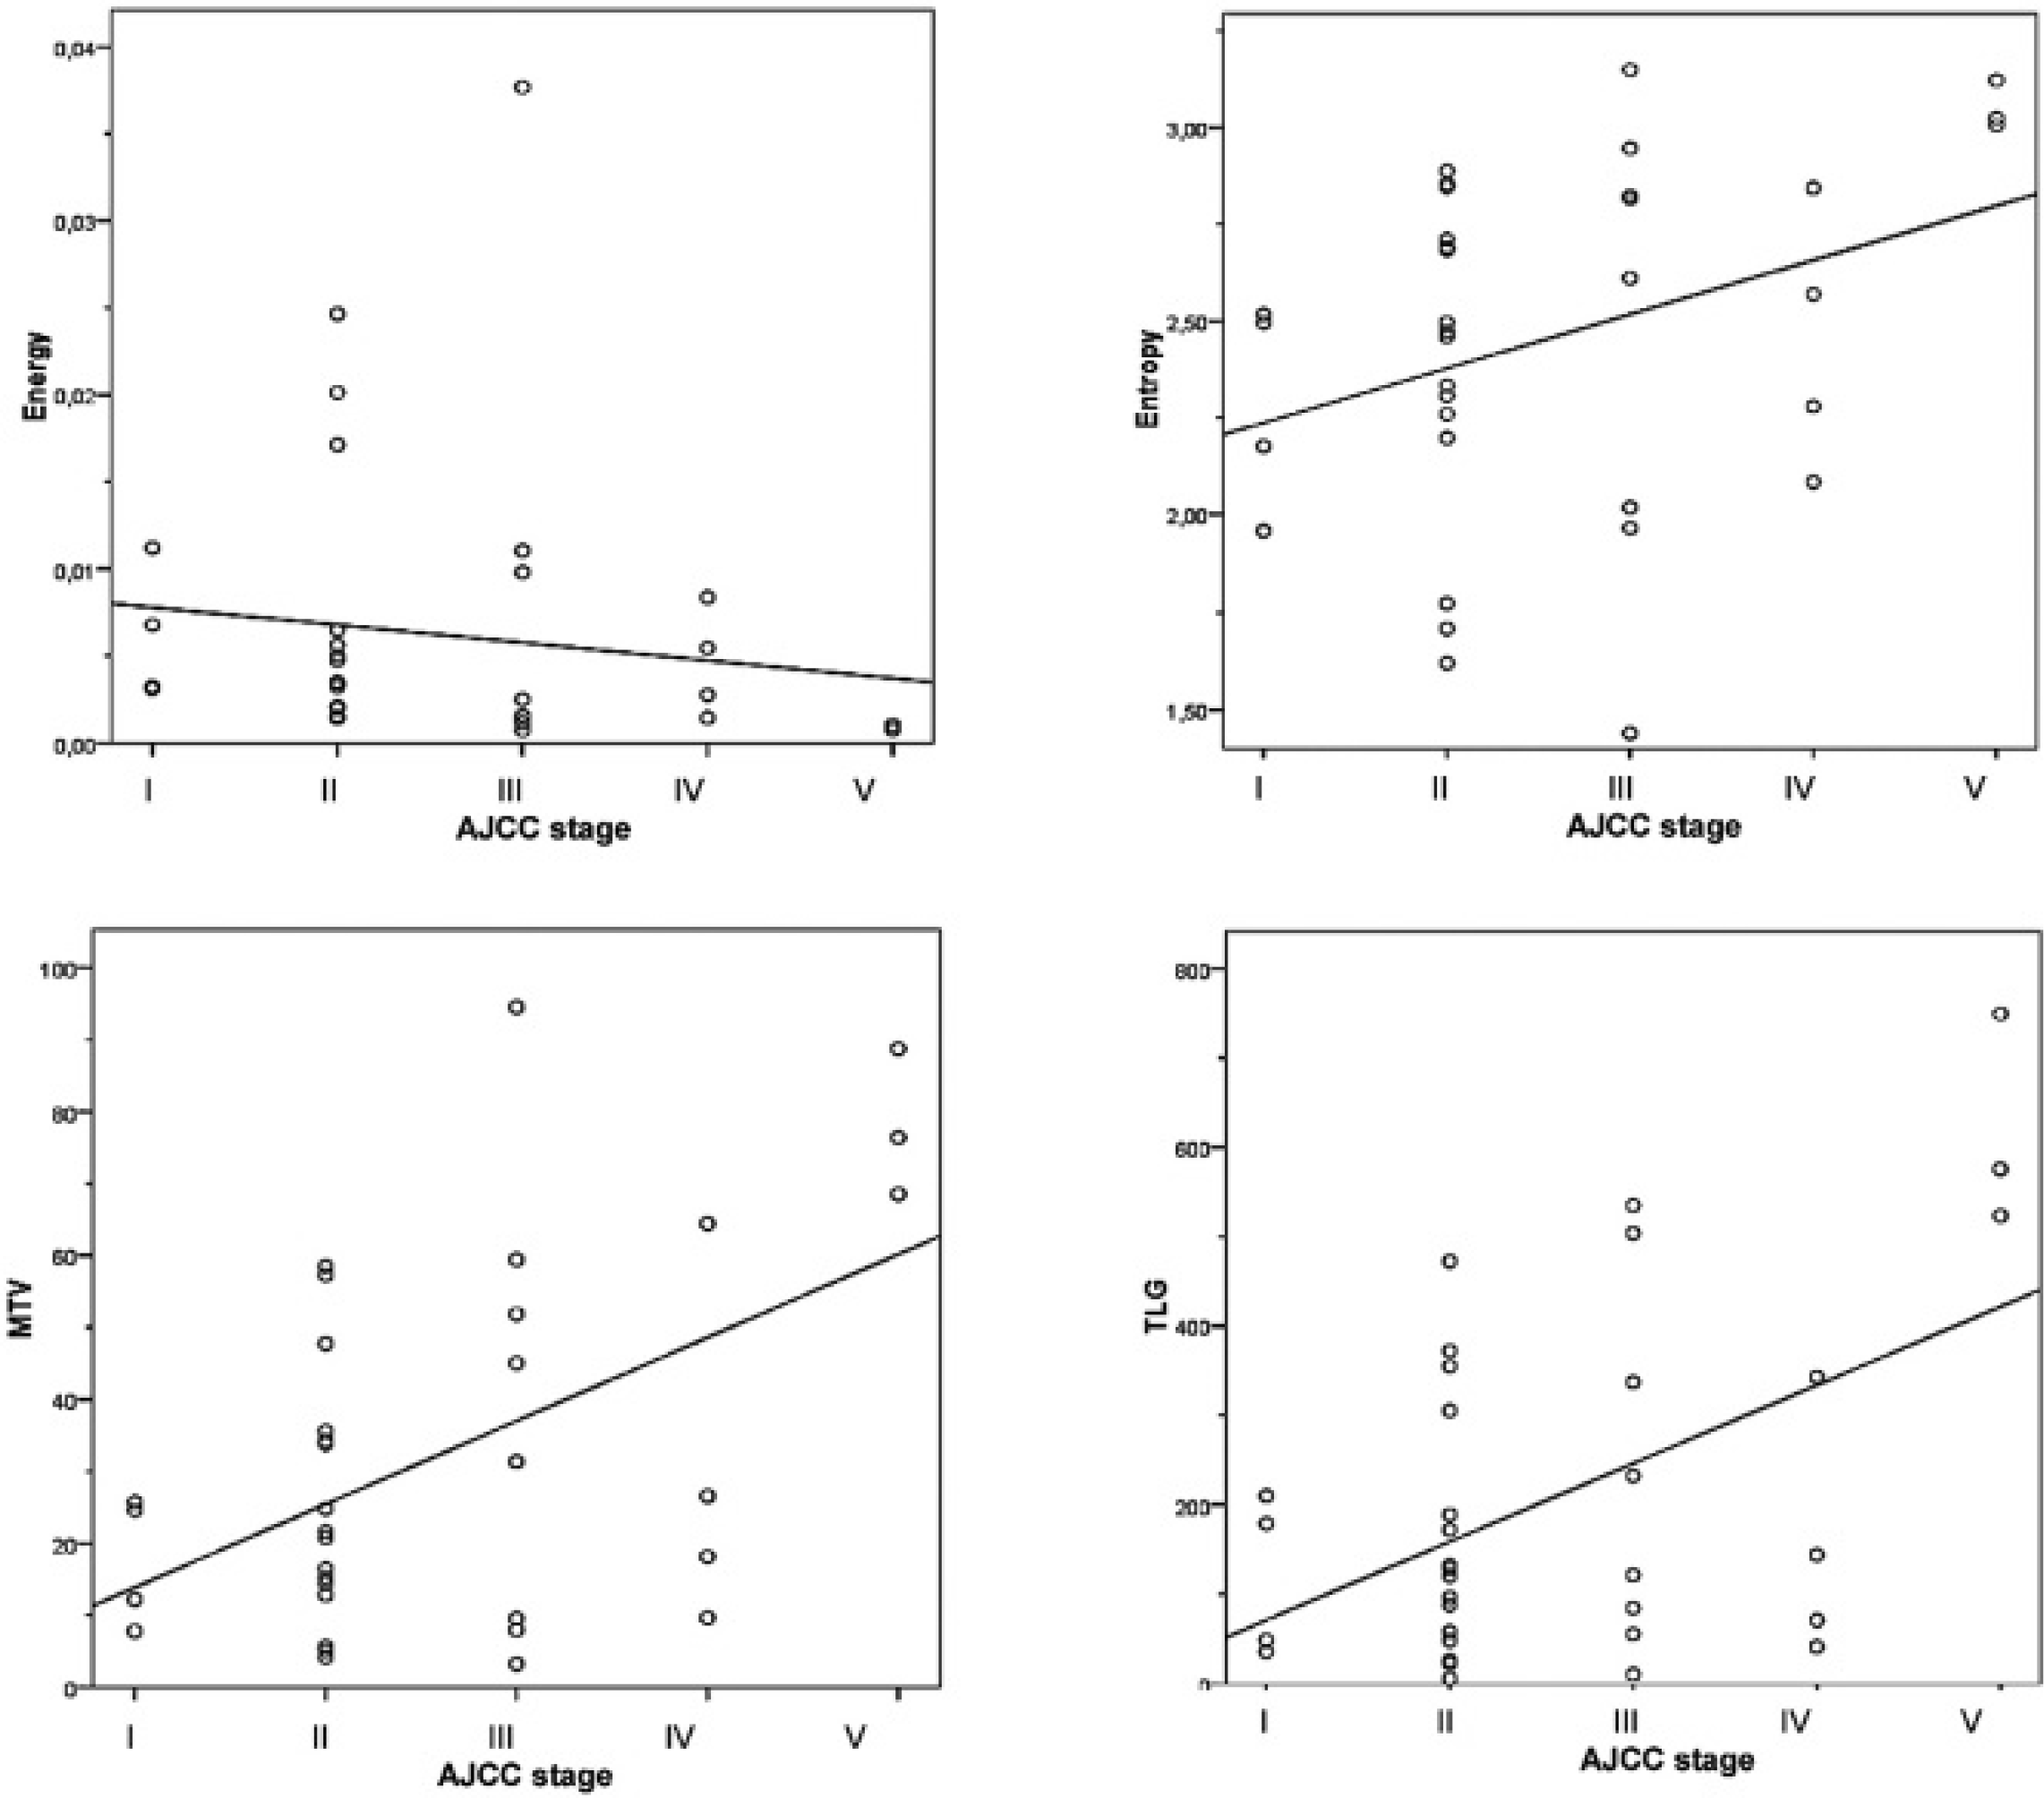
Spearman correlations between AJCC stage and energy, entropy, metabolic tumor volume (MTV), and total lesion glycolysis (TLG). Spearman correlations: (A) AJCC stage and energy (r = −.363, p = .038); (B) AJCC stage and entropy (r = .351, p = .038); (C) AJCC stage and MTV (r = .387, p = .022); and (D) AJCC stage and TLG (r = .329, p = .050).
Correlation between Textural Parameters and Clinical Characteristics
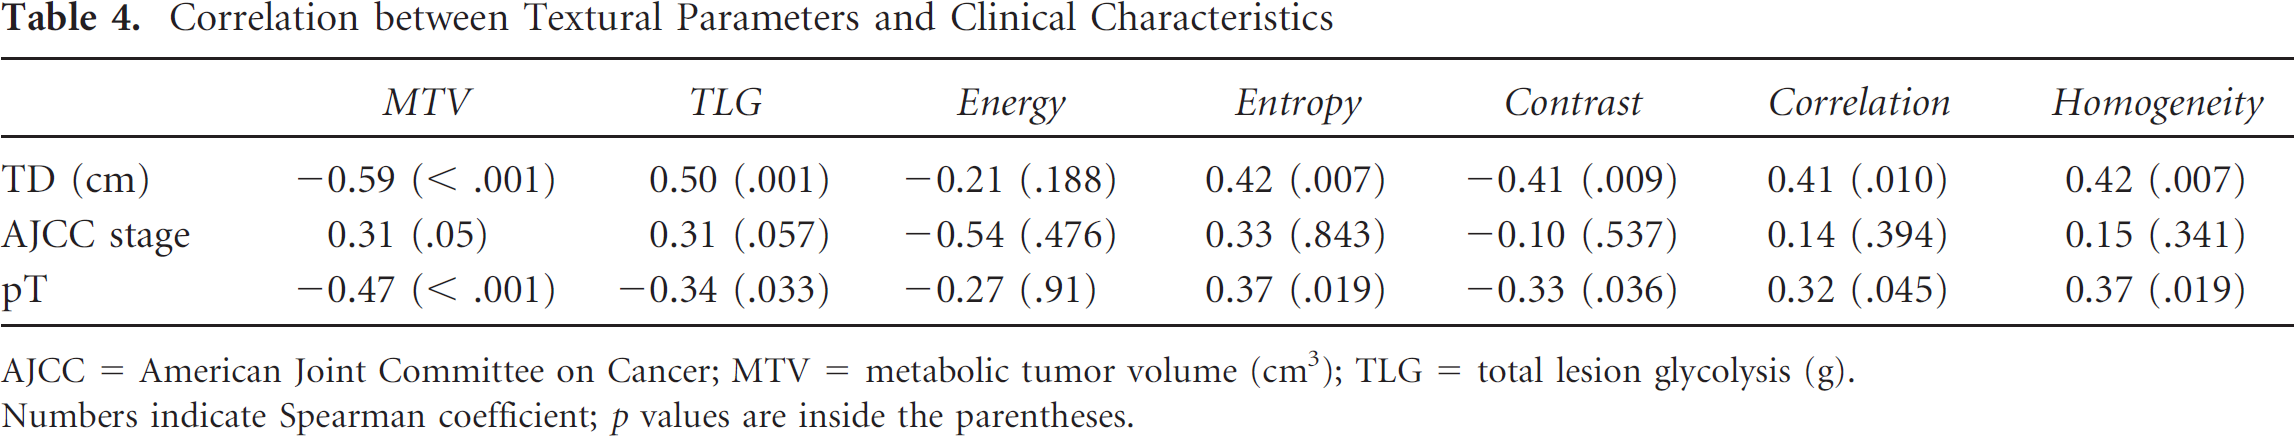
AJCC = American Joint Committee on Cancer; MTV = metabolic tumor volume (cm3); TLG = total lesion glycolysis (g). Numbers indicate Spearman coefficient; p values are inside the parentheses.
Discussion
FDG-PET/CT has been broadly used for the diagnosis and staging of malignancies and recently to determine early response to treatment. In daily routine, only semiquantitative measures of lesion activity, such as SUVs, are usually employed, even though volume-based metabolic parameters could be more representative of tumor characteristics and have more predictive value5–7 because they take into account all the voxels in the tumor image. However, spatial information about voxel intensity relationships, that is, about tumor heterogeneity of radiotracer uptake, is missing in volume-based parameters, which could limit their ability to describe the tumor characteristics and especially to predict therapy response or prognosis. Therefore, in this work, we explored the associations between metabolic parameters and textural features, which consider the spatial relationship of the image voxels.
Parameters obtained by texture analysis of images, reflecting the underlying spatial variation and heterogeneity of voxel intensities in the image of the tumor, provide a measure of the tumor heterogeneity. 27 For example, spatial distribution of FDG uptake has been related to intratumoral distribution of hypoxia,28,29 and textural parameters derived from CT images of NSCLC have been correlated to tumor hypoxia and angiogenesis. 30 Although several metrics can be derived from texture analysis, only a limited number of them have shown robustness in a clinical setting because technical and physiologic factors such as PET limited resolution, partial volume effect, reconstruction algorithms, movement artifacts, and noise could affect the tumor heterogeneity quantification by means of textural features.31–33 We must be sure that the textural feature measures underlying tumor properties, such as tumor heterogeneity, and not inaccuracies, such as blurring and artifacts, so a standard procedure of measurement must be adopted.
Most texture analyses have been performed on 2D CT images, although 3D analysis of the whole tumor seems to be more representative of tumor heterogeneity. 34 Instead of 2D analysis, we performed a 3D textural feature extraction of the PET component from PET/CT images, which allowed us to dispose of a higher number of voxels to perform a statistical textural computation. This methodology is particularly important in texture analysis of PET images, where there are less voxels representing the lesion to perform a statistical analysis, because the voxel size is larger compared with CT. The better resolution and more favorable image characteristics make CT more suitable for texture analysis; for this reason, most of the studies of tumor texture analysis have used CT. However, PET images have a functional meaning, showing biological aspects of the tumors not expressed in CT images; thus, they should be more widely used for texture analysis.
Few studies have used PET images to evaluate the heterogeneity in radiotracer distribution, even when its distribution offers firsthand information about biological processes inside the tissues. The relationships between some textural features based on CT and tumor stage in NSCLC have been previously reported. 35 However, similar analyses have not been performed by deriving textural features from the PET image of lung tumors. To date, in NSCLC, texture analyses based on PET images have only been compared to SUV, not considering volume-based metabolic parameters. To our knowledge, no association of PET textural features with volume-based metabolic parameters and AJCC stage has been previously reported. Table 5 provides a summary of the main studies and their results.36–39
Summary of Studies Investigating Textural Analysis of [18F]FDG-PET in NSCLC

CT = computed tomography; CV = coefficient of variation; [18F]FDG = fluorodeoxyglucose; MTV = metabolic tumor volume; NSCLC = non-small cell carcinoma; PET = positron emission tomography; SUVmax = maximum standardized uptake value; TLG = total lesion glycolysis.
In our study, we computed the textural features energy, entropy, contrast, correlation, and homogeneity from the 3D tumoral volume extracted from PET/CT images of the patients. These textural features showed correlations with all metabolic parameters, especially with the global metabolic parameters (MTV and TLG). Tumors with higher SUVmax, SUVmean, MTV, and TLG were more heterogeneous in the textural analysis. The correlation between entropy and energy with MTV and TLG was not linear, showing how small changes on the volume-based metabolic parameter can largely affect entropy and energy, that is, the heterogeneity measure. Thus, an accurate determination of the tumoral volume must be performed.
We found that adenocarcinomas had a lower mean value of energy and higher homogeneity than epidermoid tumors. This could indicate that adenocarcinomas are more metabolically heterogeneous than epidermoid tumors. Furthermore, although differences in SUVmax between adenocarcinomas and epidermoid tumors have been reported, 40 we could not confirm such a finding in our data. There are several methods to assess the textural features of an image; however, there are not models that directly link these textural features of the image to the biological proprieties of the imaged tumor. It would be necessary, to formulate such models in order to be able to use texture analysis to identify tumor types and to differentiate benign from malignant tumors.
All of the tumoral metabolic parameters were correlated with each other. The higher correlation was between SUVmax and SUVmean and MTV and TLG (see Table 3).
Thus, tumors with a higher SUVmax had a higher SUVmean, and as was expected, a larger MTV indicated a larger TLG.
Tumoral size correlated with volume-based metabolic parameters (MTV and TLG). This should be expected because volume depends directly on the tumor size. On the other hand, the tumoral size did not correlate with the SUVs, even though this relationship has been previously published when assessing, unlike in our study, patients with no operable stages. 41 In addition, we found that larger tumors were more heterogeneous (lower energy and higher entropy) and had lower contrast and higher correlation. In the case of contrast, even though larger tumors appear more homogeneous in a visual assessment (i.e., they exhibit lower contrast) they are more heterogeneous in the FDG spatial distribution. This could be because low-contrast images have low spatial frequencies but not necessarily low heterogeneity. However, because contrast is a textural feature with large variability depending on the acquisition modes and reconstruction parameters, 42 these results must be reviewed in future work.
In our original series of 38 patients, we found a correlation only between the pT and tumor size, energy, contrast, entropy, and MTV. However, when we rejected three patients with small tumors and high AJCC staging (because the tumors affected the pleura or were located less than 2 cm from the carina), we also found a correlation with the AJCC staging. In the reduced series of 35 patients, the AJCC staging correlated with the tumor size, energy, homogeneity, entropy, MTV, and TLG; the most significant correlation was with the energy and MTV. We thought that this finding was because the lung cancer AJCC stage includes, in the same group, tumors with different sizes because it uses other prognostic features besides the tumor size. On the other hand, entropy and energy had no linear relationship with volume-based metabolic parameters, which finally depend on tumoral size. Another important factor is that our population mostly consisted of males, but we do not know if this unbalanced population could have affected our results.
Additional studies must be performed with larger numbers of patients to settle this issue. We also found no correlation between the SUVmax and SUVmean with the AJCC stage and pT or pN stage or a statistically significant difference in the mean values, although these relationships have been reported in NSCLC 43 and other tumors. 23 One of the most important advantages of texture analysis is that its measurement is performed in the postprocessing PET/CT image. Therefore, it could be easily included in the daily clinical routine. Parameters derived from texture analysis may have reproducibility similar to or better than that of simple SUV measurements 32 and be less susceptible to the noise or the reconstruction algorithms used. 42 Prior to performing 3D texture analysis of PET/CT images, it is necessary to perform segmentation; however, there is no truly validated segmentation algorithm able to deal with tracer uptake heterogeneity. Threshold-based approximation has several drawbacks, especially in heterogeneous tumors; when the tumor uptake is more heterogeneous, the underestimation of the PET volumes by threshold-based techniques is larger. 36 We decided to use a cutoff value of 2.5 given the simplicity of the threshold method and the fact that previous authors have shown that the tumor length seen on an FDG-PET/CT image with a cutoff value of 2.5 was close to the gross tumor length. 44 Therefore, more sophisticated approximations can be taken into account in future work.
An important drawback in the measures of any image-based parameter in lung tumors is respiratory movement. Given that respiratory gating permits better characterization of the malignant lung lesion compared to the standard acquisition,45,46 the assessment of textural changes linked to the respiratory cycle seems to be the more correct option.
The assessment of FDG uptake heterogeneity by PET and its spatial and temporal variations could help us understand tumor biology. Therefore, SUV and other measurements of FDG tumor uptake can potentially be supplemented by additional imaging parameters derived from either the PET or the CT images. 47 One additional step could be the use of both CT and PET images to perform a joint assessment of the tumor heterogeneity.
It is expected that textural metrics derived from staging PET/CT images can give us better information about patient survival than semiquantitative metabolic parameters,21,22,31 and also help us decide which initial therapy to adopt. By performing interim PET/CT (i.e., PET/CT in the middle of the treatment) and assessing the textural changes of the tumor after the treatment, the response can be assessed and the treatment can be adjusted. For instance, if we found a lung tumor with high entropy and low energy in a staging PET/CT, it could need more aggressive therapy from the beginning than others with low entropy and high energy, but this requires additional work to be validated.
Conclusion
Tumor heterogeneity in NSCLC assessed by texture analysis of the PET component of PET/CT images is correlated with global metabolic parameters, and both are associated with macroscopic tumor diameter and, under special considerations (no inclusion of a small tumor with high AJCC stage), with the AJCC stage. Some textural features have no linear relationship with volume-based metabolic parameters, making them more sensible to tumor volume definition and defaulting to establish relationships with AJCC staging. These textural parameters have the potential to be used in clinical practice but require additional work to further validate their importance.
Footnotes
Acknowledgments
Financial disclosure of the authors: We would like to thank the Complutense University of Madrid for supporting the publication of this work.
Financial disclosure of reviewers: None reported.