
Abstract
The dopaminergic system is especially vulnerable to the effects of human immunodeficiency virus (HIV) infection, rendering dopaminergic deficits early surrogate markers of HIV-associated neuropathology. We quantified dopamine D2/3 receptors in young HIV-1 transgenic (Tg) (n = 6) and age-matched control rats (n = 7) and adult Tg (n = 5) and age-matched control rats (n = 5) using [18F]fallypride positron emission tomography (PET). Regional uptake was quantified as binding potential (BPND) using the two-tissue reference model with the cerebellum as the reference. Time-activity curves were generated for the ventral striatum, dorsal striatum, thalamus, and cerebellum. Whereas BPND values were significantly lower in the ventral striatum (p < .001) and dorsal striatum (p = .001) in the adult Tg rats compared to controls rats, they were significantly lower only in the dorsal striatum (p < .05) in the young rats. Tg rats had smaller striatal volumes on magnetic resonance imaging. We also found lower expression levels of tyrosine hydroxylase on immunohistochemistry in the Tg animals. Our findings suggest that progressive striatal D2/3 receptor deficits occur in Tg rats as they age and can be detected using small-animal PET imaging. The effectiveness of various approaches in preventing or halting this dopaminergic loss in the Tg rat can thus be measured preclinically using [18F]fallypride PET as a molecular imaging biomarker of HIV-associated neuropathology.
ONE OF THE well-acknowledged goals of molecular imaging is the development of reliable, reproducible, and sensitive noninvasive imaging biomarkers of disease that can assist in the evaluation of novel therapies at the preclinical and translational levels. Many disciplines in medicine are in dire need of such biomarkers, and the field of neuro–human immunodeficiency virus (HIV) is no exception. This is especially true considering the escalating problem of HIV-associated neurocognitive disorders (HANDs), with about 52% of HIV-positive (HIV+) individuals currently thought to be affected, despite optimal antiretroviral therapy and peripheral control of the infection. 1 Developing neuroprotective therapies for those patients is of the utmost importance, and toward that goal, reliable reproducible biomarkers of brain damage need to be developed and validated.
Neuro-HIV research is, however, hampered by two major issues: the lack of a validated small-animal model (mice and rats are nonpermissive for HIV infection 2 ) and the lack of objective measurable biomarkers of disease. Short of using expensive and sentient simian immunodeficiency virus (SIV)-infected monkeys, the HIV-1 transgenic (Tg) rat is considered a good model of HIV. This rat model expresses seven of the nine HIV-1 viral proteins, including gp120, nef, and Tat, but most importantly is known to develop clinically relevant neuropathologies 3 and cognitive deficits.4–7 Interestingly, dopaminergic system dysfunction in this animal model has been demonstrated repeatedly.4,8,9 This is not unusual considering the known vulnerability of the dopaminergic system to the effect of the virus, with the latter selectively targeting the basal ganglia 10 and resulting in well-recognized parkinsonian-like symptomatology in infected patients.11–14
In this report, we evaluated the dopaminergic system in the Tg rat using in vivo positron emission tomography (PET) and [ 18 F]fallypride, a fluorinated dopamine D2/3 receptor high-affinity antagonist (dissociation constant [KD] = 33 pmol/L). We hypothesized that alterations in striatal D2/3 receptors will be detected by [ 18 F]fallypride PET imaging in the Tg rats compared to controls and that [ 18 F]fallypride PET can be used as a biomarker for neuropathology in the Tg rat. We also performed high-field magnetic resonance imaging (MRI) in the Tg and control rats to correlate structural volumetric changes with changes in striatal D2/3 receptor density. Finally, we correlated the structural and PET findings with immunofluorescent staining of brain striatal slices from Tg and control animals at different ages.
Material and Methods
[18F]Fallypride PET Scanning
Animals
The young animal group consisted of six male Tg rats (3.0 ± 0.4 months; 265 ± 29 g) and seven male age-matched Fischer F344 control rats (3.0 ± 0.2 months; 283 ± 26 g). The older animal group consisted of five adult male HIV-1 Tg rats (15.2 ± 0.4 months; 380 ± 28 g) and five adult male control rats (15.6 ± 0.4 months; 486 ± 46 g). All the animals were obtained from Harlan Inc. (Indianapolis, IN). All rats were housed in a temperate-controlled environment with a 12-hour light/dark cycle. The animals were allowed free access to food and water. All procedures were conducted during the light cycle. Rats were carefully handled for 3 days prior to various experiments to minimize handling-related stress. Animal care and all experimental procedures were approved by the Animal Care and Use Committee of the National Institutes of Health.
Radioligand Preparation
The radiosynthesis of [18F]fallypride was performed according to the protocol of Mukherjee and colleagues. 15 The chemical purity was consistently found to be > 99%, with specific radioactivities ranging between 1.4 and 3.3 Ci/μmol (52–121 GBq/μmol) and activity concentrations ranging between 1.79 and 3.79 mCi/mL (66–140 MBq/mL).
PET Scanning
Two rodents were scanned per day, and the order of scanning was strictly counterbalanced: one Tg rat and one control rat, in alternative order. Animals were anesthetized with 2 to 2.5% isoflurane air/oxygen mixture. The intrasubject variability of the depth of anesthesia was monitored by measuring respiratory frequency periodically during the scan. PET experiments were performed on a Bio PET/CT tomograph (Bioscan Inc., Washington, DC) with an axial field of view (FOV) of 4.8 cm and a diameter of 6.7 cm. The time coincidence window was set to 10 ns, with an energy window of 250 to 700 keV. The lateral tail vein was cannulated for injection of radiotracer, and the cannula was then connected to a heparin lock and secured in place with medical tape. The animal was positioned prone with the head placed symmetrically in the center FOV on the thermostatically heated bed supplied by the manufacturer (Bioscan Inc.). [18F]Fallypride injection of 1.06 ± 0.18 mCi (39.2 ± 6.7 MBq; 1.97 ± 1.05 nmol/kg body weight) was then administered as a slow bolus injection (over 30 seconds) into the indwelling intravenous catheter followed by a 300 μL saline flush (maximum volume of injection = 600 μL). PET emission data were acquired for 90 minutes in list mode. The resultant emission sinograms for each frame were then corrected for scatter, 18F decay, randoms, and deadtime. The data sets were reconstructed into a dynamic sequence of 14 individual frames (6 × 60 seconds, 1 × 300 seconds, 7 × 600 seconds) using Fourier rebinning and a two-dimensional ordered subject expectation maximization (OSEM-2D; 16 subsets and 4 iterations) algorithm with a bin size of 0.39 mm, a matrix size of 175 × 175 × 61, and resolution recovery of 2.1 mm full width at half maximum.
Magnetic Resonance Imaging
Imaging was performed on a 7 T Bruker BioSpin system (Bruker, Billerica, MA) using a rapid acquisition with refocused echo (RARE) sequence with animals under 1.5% isoflurane anesthesia. The animals were placed in an imaging cradle that allowed for stereotactic alignment of the head. Each animal was monitored by respiration and body temperature over the course of the experiments. A cross-coil setup was used, which included a 20 mm surface coil placed on the head of the animal while transmission was performed using a 72 mm transmit coil. A series of sagittal T2-weighted MRIs were initially obtained in the center of the brain to allow for consistent positioning of the coronal T2-weighted images with respect to the genu of the corpus callosum. Parameters included echo time (TE) of 49.18 ms, repetition time (TR) of 1,000 ms, 0.14 × 0.14 mm/pixel spatial resolution, 256 × 256 matrix size, 8 averages, RARE factor of 8, FOV of 35 × 35 mm, and sagittal (five) 0.5 mm thick slices. Coronal T2-weighted MRIs were acquired to allow for coregistration with PET images and volume analysis. Parameters included TE of 12.3 ms, TR of 3379 ms, 0.14 × 0.14 mm/pixel spatial resolution, 256 × 256 matrix size, 8 averages, a RARE factor of 8, FOV of 35 × 35 mm, and coronal 1 mm slice thickness. The National Institutes of Health open source software, Medical Image Processing, Analysis and Visualization (MIPAV), was used for the manual masking, volume of interest (VOI) placement, and volume calculations of the whole brain (WBV) and the striatum (SV). SV measurements were based on three slices from the coronal T2 experiment, positioned at approximately bregma −0.6 through 1.44 determined by comparing the coregistered T2 images to the Paxinos and Watson rat brain atlas. 16
Dynamic Modeling of VOI on PET and MRI
The reconstructed PET images were spatially normalized into a standard space using an MRI atlas provided by Schweinhardt and colleagues, 17 which is in stereotaxic space using a rigid body transformation matrix. VOI were drawn over the relevant regions (ventral striatum [VS], dorsal striatum [DS], thalamus [Th], and cerebellum) using the coregistered MRI for guidance 17 and an anatomic atlas of the rodent brain. 16 The rat striatum was clearly visible bilaterally and delineated as previously described. 18 Separate VOI were drawn in the left and right hemispheres, and the values were then averaged. To minimize partial volume effects, VOI were placed centrally within the structures. Time-activity curves (TACs) were generated for the VOI. Image analyses were performed using the PMOD 3.4 kinetic modeling tool (PMOD Technologies Ltd., Zurich, Switzerland). The cerebellum served as a reference tissue for receptor quantification due to its low D2 receptor density. 19 To derive estimates for binding potential (BPND) of [18F]fallypride, TACs were fit to Watabe and colleagues' reference tissue model with two compartments, 20 an extension of the simplified reference model. 21 This new reference tissue model assumes that the reference region can be expressed as two-tissue compartments instead of the more conventional single-tissue compartment. Thus, the BPND can be estimated as follows, assuming that the nonspecific binding is uniform across the tissues 22 :

R1 corresponds to the differences in uptake between specific and reference regions (R1 = K1/K1′). Parameters K1 (mL/min/min), k2, and k2′ are rate constants (min−1) for transfers across the blood-brain barrier. Parameters k3 (min−1) and k4′ (min−1) are rate constants for transfers between nondisplaceable and specifically bound compartments. When the parameters k2′, k3′, and k4′, are fixed to constants determined with receptor-rich tissue, only R1 and k2 need to be fitted for estimating the BPND.
In one control rat, test-retest variability of [18F]fallypride between scan days 1 and 2 (less than 2 weeks apart) was evaluated.
Immunofluorescence
Rat brain sections at the level of the striatum were evaluated and compared in nine young (3-month-old) animals (five Tg rats and four controls), seven adult (7- to 9-month-old) animals (five Tg rats and three controls), and three older (15-month-old) animals (two Tg rats and one control).
To prepare brain tissues for staining, rats were first anesthetized with isoflurane (3% with 700 cc/min O2). This was followed by transcardial perfusion using 100 mL of normal saline (pH 7.4) and 350 mL of freshly prepared and filtered (0.45 micron filter) 4% paraformaldehyde (pH 7.4). Brains were removed and postfixed overnight in 4% paraformaldehyde at 4°C followed by three 1-hour washes in normal saline at 4°C. Brains were next cryoprotected in 10% sucrose and stored at 4°C until they sank in the solution; they were subsequently placed in 20% and then 30% sucrose until they sank again in each solution. The brains were then embedded in optimal cutting temperature compound (O.C.T., Tissue-Tek, Ted Pella Inc, Redding, CA), and 10 micron thick coronal serial sections were obtained. The striatal sections (bregma 0.48 mm to 0.12 mm) were then selected for immunofluorescent staining.
Multiepitope immunolabeling protocols were applied to the prepared fresh frozen striatal brain slices to identify the cellular phenotypes using different combinations of primary antibodies that included guinea pig IgG anti-NeuN (cat# ABN90P, EMD Millipore, Billerica, MA) to identify most neurons, chicken IgY anti–tyrosine hydroxylase (TH) (cat# ab76442, Abcam, Cambridge, MA) to identify dopaminergic neurons, and mouse IgG2b anti-glial fibrillary acidic protein (GFAP) (cat# 556330, BD Biosciences, San jose, CA) to identify astrocytes. Each of the above primary immunoreactions was visualized using appropriate fluorophoreconjugated (Alexa Fluor dyes) secondary antibodies obtained from either Jackson ImmunoResearch (West Grove, PA) or Life Technologies/Invitrogen (Carlsbad, CA). The cell nuclei were counterstained using 1 μg/mL of 4′,6-diamidino-2-phenylindole (DAPI) to facilitate cell counting. All fluorescence signals were imaged using an Axio Imager. Z2 upright scanning wide-field fluorescence microscope (Zeiss, Carl Zeiss Microscopy, Thornwood, NY) equipped with an Orca Flash 4.0 high-resolution sCMOS camera (Hamamatsu, Bridgewater, NJ), 200 W X-cite 200DC broadband light source (Lumen Dynamics, Mississauga, ON) and standard DAPI, and respective Alexa Fluor filter sets (Semrock Inc, Rochester, NY). After imaging, the multichannel image data sets were processed for image stitching and illumination correction and then were imported into Adobe Photoshop CS6 to produce pseudocolored multichannel composites.
Statistical Analyses
The results are represented as mean ± standard deviation. The differences in the BPND estimates were compared for the two groups using two-sample Student t-tests and were considered significant at p value < .05. Test-retest variability of [18F]fallypride uptake in brain regions between days 1 and 2 was calculated as [BPday1 – BPday2]/[BPday1 + BPday2]/2 × 100.
Results
[18F]Fallypride PET Scanning
Animal Group Comparisons
Body weight was recorded prior to each imaging session. The 3-month-old Tg (265 ± 30 g) and control (283 ± 30 g) groups did not significantly differ in their body weight (p = .25), but the 16-month-old Tg rats (380 ± 30 g) weighed significantly less than the age-matched controls (486 ± 50 g; p < .001).
[18F]Fallypride Injection Characteristics
In the young cohort, the Tg rats did not differ from controls with regard to injected dose (1.03 ± 0.25 vs 0.83 ± 0.26 mCi; p = .20) (38 vs 31 MBq), [18F]fallypride-specific activity (1.35 ± 0.55 vs 0.94 ± 0.31 Ci/mmol; p = .10) (50 vs 35 GBq/μmol), or injected mass per body weight (3.18 ± 1.06 vs 3.02 ± 0.64 nmol/kg; p = .75).
Similarly, in the adult cohorts, no statistically significant differences were observed in injected dose (Tg: 1.3 ± 0.29 mCi [38 MBq]; control: 1.10 ± 0.40 mCi [41 MBq]; p = .76), [18F]fallypride-specific activity (Tg: 1.94 ± 0.69 Ci/μmol [72 GBq/μmol]; control: 1.69 ± 0.40 Ci/μmol [63 GBq/μmol]; p = .51), or injected mass even when normalized for body weight (Tg: 1.45 ± 0.16 nmol/kg; control: 1.33 ± 0.22 nmol/kg; p = .36).
In the animal that underwent test and retest scans, there were no differences between scan 1 (test) and scan 2 (retest) in injected dose, specific radioactivity, or injected mass even when normalized for the animal's weight.
[18F]Fallypride Images
Injection of approximately 1 mCi of [18F]fallypride using the Bio PET/CT tomograph resulted in high-resolution images of the rat striatum and high signal to noise ratios. Lower activity concentrations were seen in the thalamus, an extrastriatal region. Regional distribution of [18F]fallypride in a representative adult Tg rat (Figure 1A) and an adult control rat (Figure 1B) is shown in Figure 1.
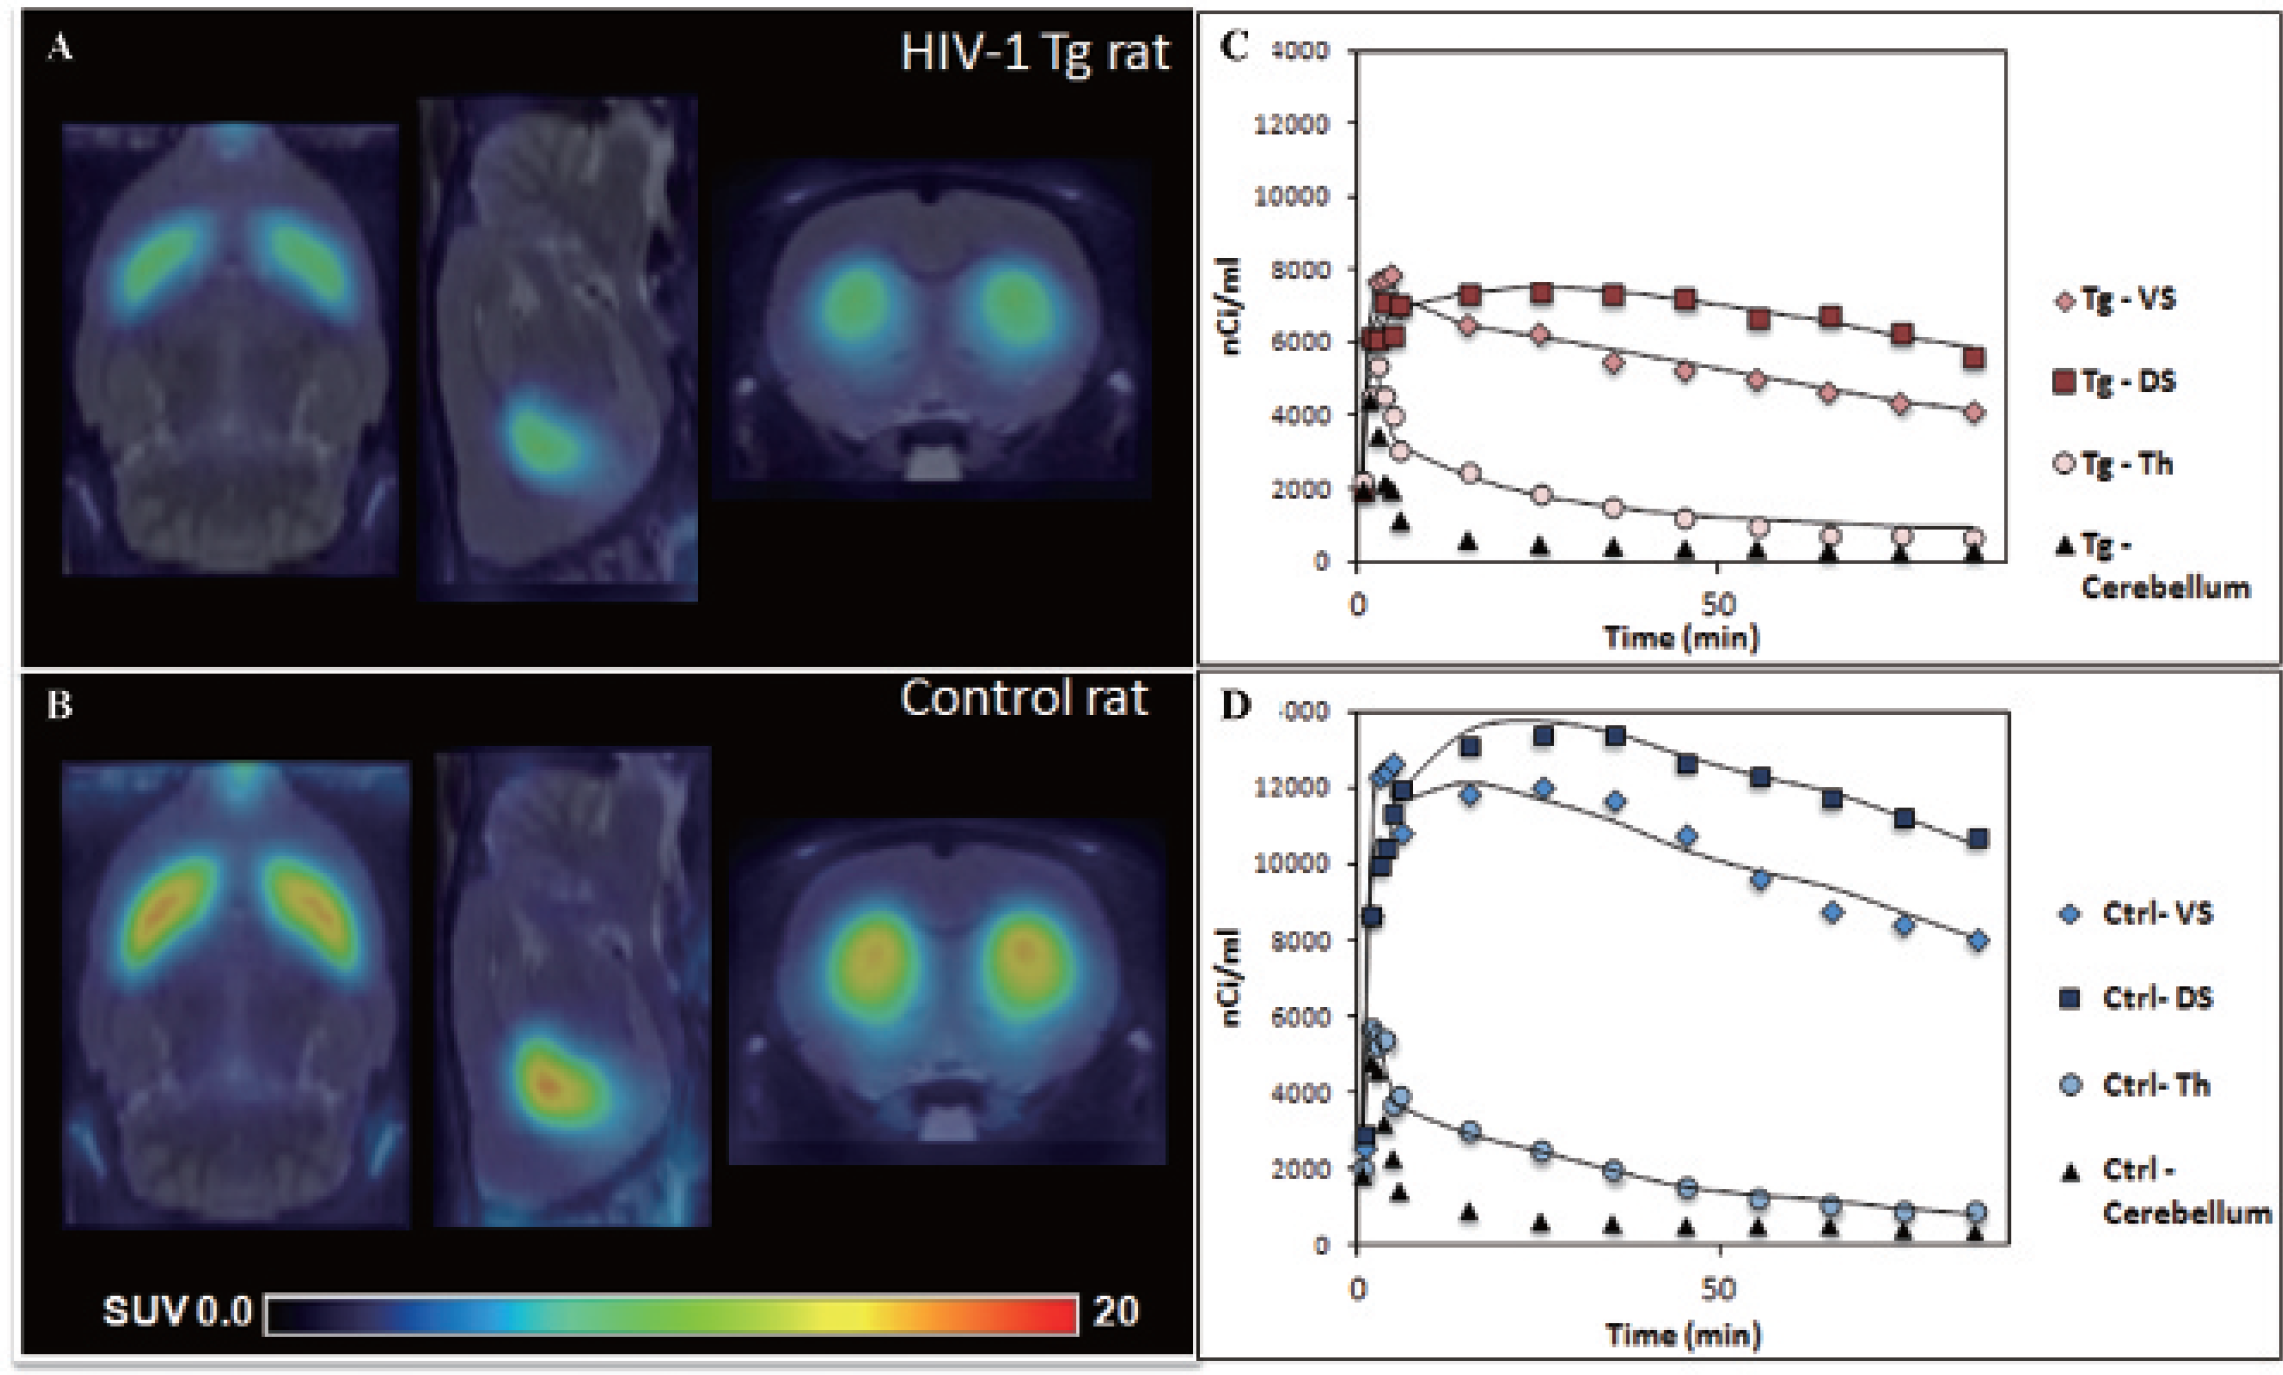
Reduced uptake of [18F]fallypride is qualitatively detectable in the transgenic (Tg) rat compared to the control rat. Shown are axial, sagittal, and coronal magnetic resonance coregistered, normalized [18F]fallypride PET images at the level of the striatum from (A) a representative adult HIV-1 Tg rat and (B) a representative age-matched control. Both images represent summed data from PET acquired between 50 and 90 minutes after injection and are displayed on a common scale (0–20 standardized uptake value [SUV]; radioactivity normalized by injected dose). Time-activity curves of [18F]fallypride injections obtained from the dorsal striatum (DS) and ventral striatum (VS) (left and right averaged), thalamus (Th), and cerebellum are shown in (C) an adult HIV-1 Tg and (D) an adult control rat. The solid lines represent the quality of data fit obtained using the two-tissue reference model with the cerebellum as reference.
Time-Activity Curves
Figure 1 also depicts the typical [18F]fallypride TACs for an adult Tg rat (Figure 1C) and an age-matched adult control rat (Figure 1D), calibrated to unit nCi/mL. Data are shown for the DS, VS, Th, and cerebellum over the total scan duration of 90 minutes. An example of the quality of the data fit obtained using Watabe and colleagues' reference tissue model with two compartments 20 is shown as solid lines (Figure 1, C and D). As expected, the highest uptake of [18F]fallypride was seen in the striatal regions, with moderate uptake in the thalamus and low uptake in the cerebellum. These results are consistent with the known distribution of D2/3 receptors in humans. 23
D2/3 Receptor Availability
Region of interest comparisons showed a statistically significant reduction in BPND in the DS for young (14%; p < .05) and adult (33%; p < .001) Tg rats relative to age-matched control rats (Figure 2). BPND estimates in the VS for the adult Tg group showed a significant reduction compared to age-matched controls (36%; p < .001). In the young group, although the Tg rats tended to have lower BPND values in the VS (14%) relative to controls, this was not statistically significant (p = .11). No statistically significant BPND differences were observed in the thalamus in the young or the old group (see Figure 2).

Scatter plot of individual BPND estimates with the selective D2/3 antagonist [18F]fallypride and PET in young (n = 6) and adult (n = 5) HIV-1 transgenic (Tg) rats and young (n = 7) and adult (n = 5) control rats. The mean BPND for each region and group is indicated by a small horizontal line. The estimates of BPND in the young HIV-1 Tg rats were significantly reduced in the dorsal striatum (14%; *p < .05), with a trend reduction in the ventral striatum (14%; p = .11). In the older HIV-1 Tg rats, decreases were significant in the dorsal (33%; ***p < .001) and ventral (36%; ***p < .001) striatal ROI compared to controls. No significant BPND reduction was observed in the thalamus of the Tg rats compared to controls in the young or the adult groups.
Percent test–retest differences of [18F]fallypride BPND were highly reproducible. Less than 7.6% variability was observed in the striatal VOI.
MRI Results
On reviewing the MRIs, we noted that many Tg animals showed increased ventricular size over time, whereas the control animals did not. The representative SV values measured on MRI were smaller in the young Tg rats (73 ± 3.4 μL) compared to the young controls (74.56 ± 2.85 μL); however, this was not statistically significant (p = .44). In the older animal group, on the other hand, SVs in the Tg animals were significantly smaller (8%) than in the control animals (71.23 ± 1.77 vs 76.69 ± 3.56 μL, p < .05) (Figure 3A). For the WBV, decreased values were seen in the Tg rats compared to age-matched controls (young and adults). Those reductions, however, were not statistically significant (Figure 3B).

Volumetric magnetic resonance measurements of representative sections of the striatum (A) and the whole brain (B) in young and adult HIV-1 transgenic (Tg) rats compared to controls. Striatal volumes were reduced (8%; p < .05) in the adult but not in the young Tg rats when compared to their respective age-matched controls. A pattern of accelerated striatal volume loss in the adult Tg rats, out of proportion to the degree of whole brain volume loss, is not seen in control rats.
Immunofluorescence
Immunofluorescent staining for TH showed decreased stain- With their nonacute onset and relatively subtle initialing in the striatum of Tg animals compared to age-matched clinical presentations, the mild forms of HAND lead to controls in all three groups. Examples from the three age groups are shown in Figure 4. Those changes were least noticeable in the young animal group (3 months old; see Figure 4A). In general, the staining appeared to be diffusely decreased in the Tg rats in comparison with age-matched controls in one of three young, one of three adult, and one of two older Tg animals, whereas it appeared to be more focally decreased in the rest of the Tg animals compared to their age-matched controls. The focal decreased staining pattern is depicted in Figure 4C, whereas the diffuse decreased staining pattern is better appreciated in Figure 4B. Other findings included astrocytic dysfunction seen as abnormally decreased GFAP staining, as well as decreased striatal NeuN staining, a marker of neuronal integrity (data not shown).

Immunohistochemistry (immunofluorescence): striatal sections (3X) stained for tyrosine hydroxylase (TH) (red), obtained from 3-month-old transgenic (Tg) (A), 7-month-old Tg (B), and 17-month-old Tg (C) rats and corresponding age-matched control rats (D, E, and F). Decreased TH staining is seen in the Tg animals but is least noticeable in the youngest rats. The pattern of involvement appears diffuse in B, whereas in C, it appears more focal, with the greatest decreased staining seen medially (X3 original magnification; scale bar = 500 μm). G and H show higher magnification images from the 7-month-old Tg and control animals shown in B and E. Decreased TH staining is again appreciated in the Tg compared to the control animal (X25 original magnification; scale bar = 100 μm).
Discussion
With their nonacute onset and relatively subtle initial clinical presentations, the mild forms of HAND lead to gradual but ultimately significant functional deterioration that often complicates the management of HIV+ patients and affects their quality of life. 1 Those conditions persist nowadays despite successful suppression of the virus in the periphery. One neurotransmitter system that seems to be especially vulnerable to the effects of the virus is the dopaminergic system. 10 Involvement of the dopaminergic system in neuroHIV explains the previously described parkinsonian-like symptomatology in the setting of HIV infection,11–14 as well as findings of lower dopamine transporter levels in the putamina of HIV+ subjects when compared to healthy controls (HIV: −12.2%, p = .02), as detected by PET. 24
In our study, we wanted to validate an appropriate animal model of neuro-HIV and dopaminergic dysfunction along with a noninvasive in vivo imaging biomarker so that the combination can then be used for preclinical evaluation of neuroprotective therapies and their potential to halt or prevent brain damage. As a small-animal model, we used the HIV-1 Tg rat, a noninfectious model of HIV infection, in which the expression of the transgene, consisting of an HIV-1 provirus with functional deletion of gag and pol, is regulated by the viral long terminal repeat. 3 There is no potential for replication, but there is chronic exposure to viral proteins. We chose the Tg rat as it has been consistently found to exhibit pathologies and immune irregularities characteristic of HIV-1 infection of humans, including neurologic signs and behavioral abnormalities.3–5,8,9,25
Using PET imaging with [18F]fallypride, a high-affinity dopamine D2/3 receptor antagonist, we found significantly decreased D2/3 receptors in the adult Tg rat brains compared to age-matched controls, both in the DS and VS (see Figure 2). In younger animals, the decrease was only significant in the DS (see Figure 2), which suggests a continuous trend of neurologic or dopaminergic damage that worsens with age. We corroborated our findings with structural MRI of the same animals used for PET imaging, where we detected decreased striatal volumes in the Tg rats compared to controls. Interestingly, the decreased SV was statistically significant in the older but not the younger Tg rats (see Figure 3A), whereas the WBV values were not significantly different at either age (see Figure 3B). We concluded that the striatum in the Tg brain must be undergoing an accelerated rate of atrophy with aging that is out of proportion to the total brain volume loss, a phenomenon that is not seen in control animals, where the rate of SV loss seemed to be proportional to that of the total brain volume loss (see Figure 3B). The findings are also consistent with our observation of increased ventricular volume in the older but not in the younger Tg rats, probably due to atrophy of the adjacent striatum.
Furthermore, immunofluorescent staining of Tg and control brains showed decreased (either diffuse or focal) TH staining in the striatum of Tg rats compared to age-matched controls at all ages (Figure 4). Those findings were, however, less prominent in the 3-month-old animals. The combination of decreased TH (early step in dopamine synthesis) and decreased postsynaptic receptor density (D2/3) supports the notion of dopaminergic neuronal dysfunction or loss in this animal.
The exact neuropathology leading to HAND is not yet fully understood. Unlike microglia, neurons do not express CD4, and although there are a few reports of the presence of HIV proviral DNA in neurons,26,27 there is still no direct evidence of productively infected neurons with HIV.28,29 Rather, the neurologic damage is thought to be related to persistent low-level neuroinflammation,30,31 neurotoxic effects of viral proteins,32,33 and the indirect disruption of the supportive and neurotrophic role of astrocytes 34 and oligodendrocytes. 35
In our animal model, we believe the damage to be mainly related to chronic exposure of various brain cells to viral proteins, such as gp120, Tat, and nef, which we have shown to be produced locally in the Tg rat brain and present at high concentrations in the cerebrospinal fluid (unpublished data, 2014). HIV-1 viral proteins are known to cause neuronal damage,36–39 with at least one of them, Tat, causing reduced evoked dopamine release and dysfunction in the dopamine terminal field. 40
Irrespective of the exact mechanism of neurotoxicity, we have shown that [18F]fallypride can detect dopaminergic system dysfunction in the Tg rats and potentially can be used as a biomarker of disease severity or neurodegeneration in this noninfectious animal model of HIV. This ligand, [18F]fallypride, a fluorinated D2/3 high-affinity antagonist (KD = 33 pmol/L), is perhaps one of the best characterized D2/3 radioligands and has been used extensively in clinical studies of psychiatric disease.41–43 It localizes selectively to the D2/3 receptors, in both the striatal and extrastriatal brain regions of rodents,18,44–46 humans,47,48 and nonhuman primates. 49 It is available at many large PET centers and has multiple advantages over similar ligands, such as the ability to image receptors in low concentrations (< 1 nmol/L) and to image extrastriatal D2/D3 receptors with sufficient target to background signal to detect subtle changes in the specific binding in those regions.
Our study is slightly limited by a lack of longitudinal data in the same animals and a lack of imaging in middleaged animals (9–11 months). Both limitations are being addressed in the second phase of the study. Our volume data are also limited by the difficulty of delineating the exact anterior and posterior borders of the striatum on the coronal MRIs. We believe, however, that we have captured the majority of the caudate and putamen, in the same location, in every animal. Another issue is the use of anesthesia, which is generally required for small-animal imaging. Tantawy and colleagues reported 13.7% lower striatal [18F]fallypride BPND estimates with 1.5% isofluraneanesthetized rats versus conscious uptake of the radiotracer. 50 In our work, the animal preparation for imaging and the anesthetic agent administered (isoflurane 2–2.5%) were identical between all imaged animals. In fact, our experimental conditions on two different days in the test-retest resulted in a < 7.6% change in BPND in the striatal regions. Otherwise, we are not aware of blood metabolite changes of [18F]fallypride due to isoflurane.
In conclusion, our ultimate goal was to identify a quantifiable dopaminergic dysfunction biomarker that can be used to test the potential of HIV neuroprotective therapies in a suitable small-animal model. We found that the HIV-1 Tg rat is a good model for dopaminergic dysfunction in HIV. Various approaches or therapies for preventing this dopaminergic loss, which can be measured using [18F]fallypride PET, could eventually prove useful in preventing or halting neurocognitive dysfunction in HIV+ patients.
Footnotes
Acknowledgments
Financial disclosure of authors: This work was supported by the Center of Infectious Disease Imaging (CIDI), Radiology and Imaging Sciences (RIS), Clinical Center, National Institutes of Health (Intramural Program).
Financial disclosure of reviewers: None reported.