
Abstract
We investigated the use of Ga-68-DOTA-Tyr3-octreotate (Ga-68-DOTA-TATE) positron emission tomography (PET) and standardized uptake values (SUVs) to predict the effectiveness of treatment with the somatostatin analogue octreotide acetate (Sandostatin LAR) in patients with neuroendocrine tumors (NETs). Thirty patients with well-differentiated NETs of the ileum (grades G1 and G2) were studied with Ga-68-DOTA-TATE. The average SUV of a 50% isocontour volume of interest covering the lesion with maximum uptake (SUVmean) and the maximum SUV (SUVmax) were determined. Patients were followed up, and the time to progression was recorded. Twenty-one patients showed progressive disease at the end of the study; nine patients had stable disease. The median progression-free survival (PFS) was 51.0 weeks (95% confidence interval [CI] 26.4-75.6). A cutoff for the SUVmax of 29.4 and for the SUVmean of 20.3 could separate between patients with a long PFS (69.0 weeks; 95% CI 9.8-128.2) and a short PFS (26.0 weeks; 95% CI 8.7-43.3) response to octreotide acetate therapy. Patients with high radiotracer uptake had significantly higher PFS with a 2.9-fold higher chance for stable disease after 45 weeks; however, the prognostic performance of SUVmax on an individual basis was poor, with a sensitivity of 75% and a specificity of 64%. SUVmax and SUVmean of NET tumor lesions in Ga-68-DOTA-TATE PET are important prognostic indices for predicting the response to therapy with octreotide acetate.
SOMATOSTATIN RECEPTOR (SSTR) EXPRESSION is a common feature of a variety of neuroendocrine tumors (NETs), enabling both nuclear medicine tumor imaging with radiopeptides1,2 and treatment with receptor agonists such as somatostatin analogues or with radiolabeled peptides.
Traditionally, somatostatin receptor scintigraphy (SRS) was performed using In-111-octreotide. In comparison with planar scintigraphy and single-photon emission computed tomography (SPECT), positron emission tomography (PET) offers not only a higher spatial resolution but also the ability to quantify radiotracer uptake in tumor lesions using standardized uptake values (SUVs). A variety of radiopeptides for PET imaging of the SSTR have been developed, such as Ga-68- DOTA-Tyr3-octreotide (Ga-68-DOTA-TOC), Ga-68-DOTA- Tyr3-octreotate (Ga-68-DOTA-TATE), Ga-68-DOTA-1-NaI3- octreotide (Ga-68-DOTA-NOC), and Ga-68-DOTA-lanreotide (Ga-68-DOTA-LAN) with slightly different affinities for the different SSTR subtypes 1 to 5, all labeled with the positron-emitting generator nuclide gallium 68. The application of these tracers was shown to clearly outperform conventional SPECT and morphologic imaging with computed tomography (CT).3–10 Not surprisingly, the use of SRS PET is rapidly advancing in clinical routine imaging. 11
Overall survival in patients with NET has been shown to be dependent on a variety of factors, such as localization of the primary tumor, cell differentiation, proliferation indices, expression of SSTRs, and tumor staging on diagnosis.12–18
Recently, the ability of PET to deliver prognostic information could be demonstrated in 47 patients with NET using Ga-68-DOTA-NOC PET. 19 The authors correlated the SUV of tumor lesions to predict progression-free survival (PFS).
SSTR PET can have a strong impact on the clinical management of NET. High SSTR2 radiotracer binding indicates upregulation of SSTR2 receptors, enabling the use of receptor agonists. Therapy using conventional somatostatin analogues, such as octreotide acetate (Sandostatin LAR, Novartis Oncology, Basel, Switzerland), is still considered to be first-line treatment in functioning NET and nonfunctioning well-differentiated NET of the ileum, 20 giving symptomatic improvement in approximately 50% of the patients and biochemical response in approximately 60%, as well as a significant tumor stabilization. 21 Radiopeptides for imaging have a chemical structure similar to that of octreotide acetate but are stabilized to obtain a higher plasma half-life and contain a chelator (“DOTA”) to bind metal radionuclides. By imaging SSTR2 expression, SRS PET delivers valuable information for therapy planning that cannot be derived from metabolic PET scans with F-18-fluorodopa (F-18- DOPA) 22 or F-18-fluorodesoxyglucose (F-18-FDG). 23
Despite the obvious hypothesis of a correlation of SRS radiotracer binding with therapy response to octreotide acetate therapy, to our knowledge, there is no compelling evidence to support this theory. The aim of our study, therefore, was to systematically evaluate the use of standardized Ga-68-DOTA-TATE PET to predict therapy response to treatment with somatostatin analogues by comparing standardized tracer uptake values with PFS.
Materials and Methods
Patients
Thirty patients (17 men, 13 women) with histologically proven, well-differentiated (G1 or G2) metastatic NET of the ileum, subject to octreotide acetate 30 treatment according to the guidelines, 20 were examined with Ga-68- DOTA-TATE and PET. Patients were enrolled in 2008 to 2012. The mean age of the patients was 60.9 ± 10.4 years (range 31-82 years). The clinical data of all patients are given in Table 1. No systemic cytoreductive therapy was performed prior to the examinations and during the observation period. During follow-up, disease progression was observed in 21 patients; 9 patients did not progress during the observation period. Furthermore, patients were classified as having either stable or progressive disease at a fixed time point 46 weeks after therapy initiation. Written, informed consent was obtained from all patients prior to the examinations. The study was performed according to the regulations of the local authorities. The scans were acquired as part of routine protocols in the endocrinology department; thus, the ethics committee waived approval.
Clinical Data of the Patients

LN = lymph node(s).
PET Scans
Ga-68-DOTA-TATE was synthesized as previously described. 24 PET scans were acquired in three-dimensional mode (3 minutes per bed position) using a GE Discovery PET/CT scanner (GE Healthcare, Waukesha, WI) or a Siemens Biograph TruePoint PET/CT scanner (Siemens Medical Solutions, Erlangen, Germany). The emission sequence was initiated at 60 minutes following intravenous injection of 200 MBq Ga-68-DOTA-TATE. Data were reconstructed using the CT scan for attenuation correction. The median time interval between the PET/CT scan and the start of octreotide acetate treatment was 22 days. In four patients, octreotide acetate treatment was initiated prior to the PET/CT scan.
PET Image Evaluation
The PET/CT images were evaluated in consensus by two nuclear medicine specialists, all of whom were aware of the patients' clinical history. PET images were evaluated visually for regions of pathologically increased tracer uptake that could not be attributed to normal physiologic activity. The results were analyzed as patient based (any pathologic uptake, yes/no) and based on four reported tumor regions per patient, that is, the presence of pathologic tracer uptake in the liver, bones, lung, and lymph nodes. The primary tumor was also assessed, if present and if it could be identified. The lesion with the most radiotracer uptake was quantified using SUV. The maximum SUV (SUVmax) and the average SUV (SUVmean) of this lesion were determined by applying a volume of interest defined by 50% isocontours. Similarly, SUVmax and SUVmean of the lesion with lowest uptake (but with a lesion size of at least 1 cm to minimize the influence of partial volume effects) were also determined to evaluate the potential influence of metastasis with poor SSTR expression on PFS.
Time to Progression
The PFS for each patient was determined based on a consensus agreement of internal medicine physicians, endocrinologists, surgeons, nuclear medicine physicians, and radiologists in regular tumor boards based on all available information. The decision was primarily based on the Response Evaluation Criteria in Solid Tumors (RECIST). 25 Significant metastasis size increase and new metastases lead to classification as progressive disease, as defined by RECIST. In ambiguous situations, tumor markers and other clinical features (such as clinical symptoms, liver function parameters) were additionally considered. However, tumor marker changes and clinical features did not serve as primary markers for progression due to known high interindividual and intraindividual variation of these parameters. The average observation period was 65 ± 24 weeks.
Statistics
Statistics were performed using SPSS version 13 (SPSS Inc, Chicago, IL) and the open-source statistics package “R” version 2.15 (R project, http://www.r-project.org) with the packages “survival” and “deducer” installed.
Distributions of SUVmax and SUVmean were first examined using Kolmogorov-Smirnow tests. Curtosis and skewness of the distributions were checked.
The best prognostic cutoff for the SUV to separate between patients with a good and a poor response to octreotide acetate treatment (thus patients with long or short PFS) was estimated by fitting Cox proportional hazard models to the dichotomized variable and the survival variable using the Cutoff Finder Web Application. 26 Survival analysis was executed using the functions coxph and survfit from the “R” package survival. The optimal cutoff was defined as the value with the most significant (Mantel-Cox log-rank test) split. Hazard ratios (HRs) with 95% confidence intervals (CIs) were calculated.
Differences of other clinical characteristics, such as gender distribution, identifiable primary tumor, and the presence of liver, lymph node, bone, or lung metastases, were then compared between patients with long PFS and short PFS using square tables and Fisher exact tests. To further identify the influence of these potential prognostic factors on PFS, multivariate analysis using the Cox proportional hazard regression model with a backward stepwise (Wald) method for factor inclusion was applied.
Receiver operating characteristic (ROC) analyses were performed with areas under the curve (AUC) used to test the accuracy of SUVmax and SUVmean in predicting stable disease or progressive disease at 46 weeks after therapy initiation. Best sensitivity/specificity pairs were determined by iteratively minimizing the Manhattan distance of the ROC curve to the left top edge of the ROC diagram.
Results
Median PFS in our patients was 51.0 weeks (≈ 11.7 months), with a 95% CI from 26.4 to 75.6 weeks. Probability for stable disease was 70.0 ± 8.4% at 6 months and 48.5 ± 9.4% at 12 months. Figure 1 shows the respective Kaplan-Meier plot with 95% CIs for the entire cohort.

Plot of Kaplan-Meier estimates for progression-free survival among 30 patients with neuroendocrine tumors. Average time until disease progression was 68.2 weeks (95% CI 49.8–86.7).
Data exploration to determine the appropriate statistical tests revealed approximate normal distribution of SUVmax (p = .739) and SUVmean (p = .556) values (in the lesion with highest uptake) and SUVmax (p 5 .550) and SUVmean (p = .767) values (in the lesion with lowest uptake) in Kolmogorov-Smirnov tests. In reverse, log transforms of these values (as applied by some authors) violated the assumption of normal distribution. Further statistics are therefore based on untransformed data.
Average SUVmax values in our patient population were 33.1 ± 16.1 in the lesion with the most uptake and 11.7 ± 5.6 in the lesion with the poorest uptake. Average SUVmean values were 22.5 ± 11.1 and 8.3 ± 4.0, respectively.
SUVmax and SUVmean in the lesion with the most uptake were higher in patients with stable disease (39.7 ± 21.2 and 26.7 ± 15.5) than in patients with progressive disease (30.2 ± 12.9 and 20.6 ± 8.5), without the group differences being significant (p = .139 and p = .173, respectively).
SUVmax and SUVmean in the lesion with the lowest uptake were similar in patients with stable disease (11.4 ± 4.9 and 8.2 ± 3.2) and in patients with progressive disease (11.9 ± 5.9 and 8.3 ± 4.4), with respective p values of .850 and .911.
Information obtained from the lesions with lowest uptake did not allow differentiation between patients with long and short PFS in Kaplan-Meier analyses (Figure 2A for SUVmax and Figure 2B for SUVmean; log-rank p values were 0.42 and 0.24, respectively).

Plot of Kaplan-Meier estimates for progression-free survival among 30 patients with neuroendocrine tumors according to (A) SUVmax with cutoff at 10.5 (log-rank p = .42) and (B) SUVmean with cutoff at 7.28 (log-rank p = .24) of the lesion with lowest uptake. HR = hazard ratio.
In contrast, SUVmax and SUVmean of the lesions with the highest uptake could distinguish between long and short PFS of patients treated with octreotide acetate (log-rank respective p values of .019 and .020). Further results are therefore confined to analyses in lesions with the highest radiotracer uptake.
The ideal cutoffs (see statistics) for SUVmax and SUVmean in these lesions were 29.35 and 20.30, respectively, resulting in identical group separation. Median PFS was higher (69.0 weeks; 95% CI 9.8-128.2) in patients with high radiotracer uptake than in patients with low uptake (26.0 weeks; 95% CI 8.7-43.3), as shown in Kaplan-Meier analyses (Figure 3A for SUVmax, Figure 3B for SUVmean). Calculated HRs with 95% CIs for SUVmax and SUVmean were 0.34 (0.13-0.88) and 0.34 (0.13-0.88), respectively.

Plot of Kaplan-Meier estimates for progression-free survival among 30 patients with neuroendocrine tumors according to (A) SUVmax with cutoff at 29.35 (log-rank p = .019) and (B) SUVmean with cutoff at 20.30 (log-rank p = .020) of the lesion with highest uptake. HR = hazard ratio.
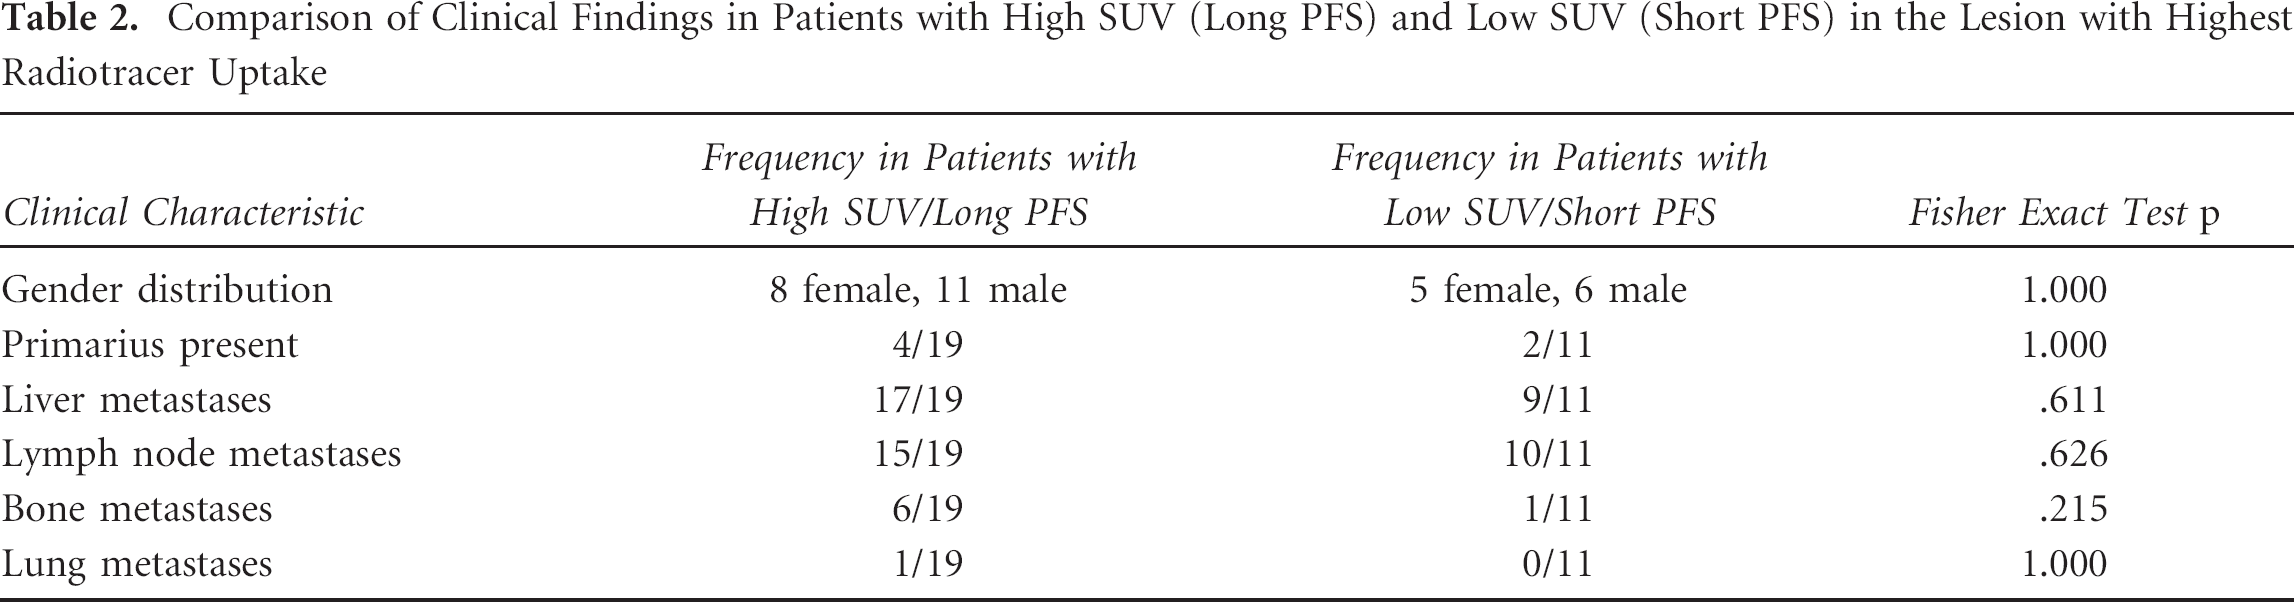
Other clinical characteristics (such as gender distribution, presence of the primary tumor, and location of metastases) did not differ significantly between patients with long or short PFS (Table 2). Accordingly, of the examined parameters, multivariate Cox regression with a backward stepwise model identified classified SUV as the only significant predictor for PFS.
Comparison of Clinical Findings in Patients with High SUV (Long PFS) and Low SUV (Short PFS) in the Lesion with Highest Radiotracer Uptake
To determine the predictive value of SUV measurements for disease progression, ROC analyses were performed (Figure 4). The AUC (± standard error) for SUVmaxwas slightly higher (0.647 ± 0.105, p = .170) than that for SUVmean (0.589 ± 0.109, p = .406). The best sensitivity/specificity combination for SUVmax at the optimum cutoff of 32.0 was (75%/64%). For SUVmean, the respective values at a cutoff of 20.3 were 75% and 57%.

Receiver operating characteristic curve of SUVmax and SUVmean (of the lesions with highest uptake) to predict stable or progressive disease. Best sensitivity/specificity pairs for SUVmax (cutoff 32.0) and SUVmean (cutoff 20.3) were 75%/64% and 75%/57%, respectively.
Discussion
SSTR PET with Ga-68-DOTA-TATE is well established for staging and therapy monitoring in patients with NETs. 11
An association of SSTR2 expression (but not of SSTR 1, 3, 4, and 5 expression) and radiopeptide uptake was described previously for the conventional tracer In-111-DTPA-octreotide, 27 with scintigraphy providing a qualitative parameter for receptor expression. For PET tracers, higher SUVs in lesions with prominent SSTR2 expression than in lesions with low receptor expression were reported for Ga-68-DOTA-NOC, 19 Ga-68-DOTA-TOC, 28 and Ga- 68-DOTA-TATE, 29 indicating that SUV can be used as a quantitative measure of SSTR2 expression.
Compared to other peptide tracers, Ga-68-DOTA-TATE is highly selective for the SSTR2. 11 Ga-68 is generator produced, and the labeling procedure for Ga- 68-DOTA-TATE is simple, 30 making this radiotracer widely available. The ability of Ga-68-DOTA-TATE (or other radiopeptide tracers) to predict therapy response to treatment with octreotide acetate, however, has not been examined systematically.
We examined SUVmax and SUVmean in the lesion with highest radiotracer uptake, as frequently performed in clinical routine imaging and in analogy with the recommendations for PET Response Criteria in Solid Tumors (PERCIST) 31 analysis. Metastatic disease in NETs can be heterogeneous, with some metastatic sites better differentiated than others. We therefore also analyzed the lesion with lowest radiotracer uptake to see if PFS was adversely impacted by the tumor site with the lowest SUVmax and/or SUVmean. The tumor site with the poorest uptake may correspond to the clonal population of tumor that has the highest risk of progression due to relatively poor differentiation (also suggesting that such a site would represent not only a site of more aggressive disease but also one that would have a relatively poor response to octreotide acetate).
Median PFS in our NET patients was 11.7 months, which is comparable to that recently reported by Campana and colleagues and Rinke and colleagues.19,32
Uptake of Ga-68-DOTA-TATE in sites of NETs is known to be considerably higher than in normal tissue. Considering the analysis of the lesions with highest uptake, an average SUVmax of 33.1 ± 16.1 and an average SUVmean of 22.5 ± 11.1 were observed; for comparison, physiologic liver uptake of Ga-68-DOTA-TATE is approximately 6.5. 33 Interestingly, SUVmax values were almost twice as high as that reported by Demirci and colleagues (16.13 ± 11.11) for NET patients. 4 However, Demirci and colleagues included a large variety of different tumor entities (including medullary thyroid carcinoma, Merkel cell carcinoma) and reported the average SUVmax of up to five lesions, whereas our study includes ileum NETs only, and we only considered (for calculations) the lesions with the maximum (and minimum) uptake.
Based on SUVs obtained from the lesion with the lowest uptake, no differentiation between patients with long and short PFS was possible. This might be attributed to confounding factors that interfere with adequate determination of SUVs in these lesions, such as a predominance of partial volume effects in small lesions (a minimum lesion size needs to be arbitrarily defined based on morphologic data in addition to PET 34 ) or poor contrast of lesions with low uptake to the surrounding physiologic uptake.
Based on the lesions with the highest uptake, we could show prolonged PFS with octreotide acetate therapy in patients with high SUVmax and SUVmean values. This is in line with early In-111-DTPA-octreotide studies showing an association of positive tracer uptake with slow disease progression. 27 Similarly, Campana and colleagues recently reported an association of Ga-68-DOTA-NOC SUV and disease prognosis with a cutoff for the SUVmax of 17.9 to 19.3 to distinguish between stable and progressive disease. 19
Of the examined parameters, SUVmax and SUVmean were the only significant predictors of PFS. Other clinical characteristics, such as gender distribution, the presence of the primary tumor, and the location of metastases, did not reveal relevant prognostic value in multivariate analyses. Some clinical factors potentially predicting PFS, such as tumor burden (hepatic tumor load), however, were not available for analysis. 32
The prognostic cutoffs determined based on our data were 29.35 for the SUVmax and 20.30 for SUVmean, allowing significant differentiation between patients with long and short PFS to octreotide acetate treatment. Patients with SUVs above these thresholds had a 2.9-fold higher chance for stable disease after 46 weeks than patients with lower SUVs. Considering the fact that lesional Ga-68-DOTA-TATE uptake is approximately 35% higher than Ga-68-DOTA-NOC, 35 the cutoff for the SUVmax is quite similar to that determined by Campana and colleagues. 19 Our study design, however, differs significantly from that of Campana and colleagues as we only included ileum NETs with G1 or G2 grading and therapy was confined to somatostatin analogues, whereas Campana and colleagues also included poorly differentiated NETs and analyzed the outcome with different therapeutic arms (radiopeptide therapy, somatostatin analogues). By inclusion of a more homogeneous group of patients with a single treatment arm, we were able to minimize potential confounding factors.
The prognostic value of SUVmax and SUVmean was equal (with identical HRs and log-rank p values in Kaplan-Meier analyses). For clinical routine imaging, determination of SUVmax is easier and less prone to errors than analysis of SUVmean in three-dimensional volumes of interest.
Unfortunately, ROC analyses using SUVmax as a predictor of disease progress versus stable disease revealed a rather low AUC (0.647), with—depending on the cutoff used—either poor sensitivity or specificity with a best sensitivity/specificity combination of 75%/64%. A similar observation was made by Campana and colleagues, who calculated a sensitivity of only 53% at an acceptable specificity of 92%. 19 This finding may be accounted to the heterogeneity of SSTR2 expression of different lesions.36,37 SUVmax may also differ significantly between well and poorly differentiated NETs, 19 adding further variability; grading system distinguishes three categories based on Ki67 levels (G1: Ki67 < 2%, G2: 3-20%, G3: Ki67 > 20%).14,15 Also, differences of SSTR2 expression between nonfunctioning and functioning tumors were reported, with nonfunctioning tumors showing lower expression, 38 but not consistently noted in imaging studies.39,40 Possibly, our results would even be worse if NETs of other than ileum origin would be included as tumors of different origin have also been shown to further differ in SUVmax (with Ga-68-DOTA-NOC uptake being higher in pancreatic NETs than in gastrointestinal or bronchial NETs19,41) and no significant effect of octreotide acetate in these NETs has been described in prospective trials so far.
Response evaluation based on size changes (RECIST 25 ) is currently considered the reference for NET response to conventional chemotherapy but is not adapted to targeted therapies. The latter will not necessarily induce tumor size reduction. For other malignancies treated with targeted therapies, tumor response and clinical outcomes are better correlated with functional imaging. Some authors, therefore, consider combined morphologic and functional exploration mandatory. 42 Moreover, morphology-based tumor treatment response evaluation is retrospective and requires follow-up examinations. The functional approach presented here provides a potential basis to predict therapy response in advance, even prior to treatment initiation.
Although providing prognostic information, SUVmax of Ga-68-DOTA-TATE PET currently most likely cannot be used on an individual basis to predict treatment response. Diagnostic accuracy could potentially be improved by defining separate thresholds for different subgroups, such as for different tumor grades, Ki67 indices, tumor origin, functional versus nonfunctional tumors, etc. As a limitation, attempts to create more homogeneous subgroups were hampered by the number of patients available for analysis in our study due to NETs still being a rare tumor entity.
Although all patients had histopathologically proven NETs, histopathologic confirmation was not frequently available for the lesion with highest uptake. Last but not least, some technical limitations need to be considered. Four scans were acquired during octreotide acetate treatment, but according to the literature, octreotide acetate treatment does not alter SUVs obtained. 43 To provide clinically relevant data, we did not correct for partial volume effects as this is not feasible in clinical routine imaging. Recovery depends on many factors, including resolution of the imaging system, resolution modeling, scatter correction, and the size and shape of the examined lesion. For PET with Ga-68-DOTA-TOC, partial volume effects may affect quantification in lesions of less than 20 mm diameter. 34
Conclusion
SUVmax and SUVmean of NET tumor lesions in Ga-68- DOTA-TATE are important prognostic indices for predicting therapy response to therapy with octreotide acetate. Although, due to the heterogeneity of NETs, the parameters can currently not be reliably applied to predict therapy response on an individual basis, our findings are proof of concept. The approach presented provides a basic concept to predict tumor treatment response in advance, even prior to treatment. Refined thresholds for different tumor grades and tumor origins, which would have to be determined in further prospective (possibly multicenter) studies, could enable prognostic stratification on an individual basis, thus allowing the individualization of treatment strategies.
Footnotes
Acknowledgment
Financial disclosure of authors: Christoph J. Auernhammer has received research contracts (Ipsen, Novartis), lecture honorarium (Ipsen, Novartis) and advisory board honorarium (Novartis).
Financial disclosure of reviewers: None reported.