
Abstract
Rheumatoid arthritis (RA) and osteoarthritis (OA) are serologically and clinically distinctive, but at the local level, both diseases have many molecular pathways in common. In vivo molecular imaging can unravel the local pathologic processes involved in both diseases. In this study, we investigated matrix metalloproteinase (MMP) and cathepsin activity during cartilage destruction, in an RA and an OA mouse model, using biophotonic imaging of substrate-based probes. Mice with collagen-induced arthritis (CIA) or destabilization of the medial meniscus (DMM) were imaged using near-infrared fluorescent probes, activated by several cathepsins or MMPs. Fluorescence signal intensity was compared to synovial gene expression, histology, and cartilage staining of a neoepitope of aggrecan cleaved by MMPs with the amino acids DIPEN. Increased cathepsin and MMP activity was seen during CIA, whereas the DMM model only showed increased MMP activity. DIPEN expression was seen only during CIA. A possible explanation can be differences in gene expressions; MMP3 and -13, known to produce DIPEN neoepitopes, were upregulated in the CIA model, whereas MMP12, known to be involved in elastin degradation and chemokine inhibition, was upregulated in the DMM model. Thus, molecular imaging showed no cathepsin activity at the time of cartilage damage in the DMM model, whereas both cathepsins and MMPs are active in the CIA model during disease progression.
Several imaging modalities are available to monitor disease progression in patients: acoustics to measure synovitis and cartilage edema, radiography or magnetic resonance imaging (MRI) to measure bone loss and loss of cartilage by joint space narrowing, and MRI to detect soft tissue pathology. 4 Additional techniques to measure molecular processes primarily used in preclinal research are single-photon emission computed tomography and positron emission tomography, using radioisotopes, and biophotonic imaging, using fluorescent probes. 5 The advantage of the latter is that enzyme activities can be assessed using quenched fluorophores that become activated on enzymatic cleavage.
During RA, a variety of proteases are upregulated in the inflamed joint, including different cathepsins6,7 and matrix metalloproteinases (MMPs). 8 Cathepsins are lysosomal proteases able to degrade collagen. Cathepsin S is secreted by tissue macrophages and is involved in extracellular matrix (ECM) degradation. It has been shown that mice with cathepsin S deficiency are less susceptible to collagen-induced arthritis (CIA), indicating an important role for cathepsin S in the development of this model. 9 On the other hand, cathepsins L and K are known to be involved in osteoclastic bone degradation. 10 Cathepsins B, L, and S are all abundantly found in the synovial fluid and the lining tissue of arthritic joints.7,11 Differences are seen between the macrophage-like cells, called type A synoviocytes, and the fibroblast-like cells, called type B synoviocytes, in the expression of cathepsins. Cathepsin K is mostly expressed in type B synoviocytes, whereas cathepsin S is mostly expressed in type A synoviocytes. 12
Lower cathepsin expression is seen in OA compared to RA.12,13 In a study by Lai and colleagues, cathepsin B was used as a marker of collagenase-induced OA. 14 Using a cathepsin B-sensitive near-infrared (NIR) fluorescent probe, they showed that a difference could be measured between osteoarthritic and normal joints. They therefore proposed that this method may provide a new strategy for early detection of OA.
The MMPs are a large group of zinc-dependent enzymes known to degrade the ECM during both RA and OA, causing cartilage proteoglycan depletion and breakdown of the collagen network, leading to erosion. MMP2 and MMP9 belong to the gelatinases, whereas MMP13 belongs to the collagenases. MMPs are regulated in three ways: by transcriptional control, by proenzyme activation, and by tissue inhibitors of metalloproteinases. 11
During RA, MMPs are produced by chondrocytes and the cells of the synovium. MMPs can directly influence the cartilage because of their ability to cleave components of the ECM. Also, indirectly, MMPs can influence the cartilage homeostasis; they affect chondrocyte function and therefore the maintenance of the cartilage. The amino acid sequence DIPEN is a neoepitope in the proteoglycan core protein that is cleaved by MMPs, such as MMP13, and remains bound to hyaluronan in the cartilage 15 and on chondrocytes. 16 DIPEN can be visualized by immunostaining and is nowadays known to represent MMP activity on histology. Interestingly, Mort and colleagues showed that cathepsin B can also cleave aggrecan and therefore produce the DIPEN neoepitope as well. 17
In this study, we investigated cathepsin and MMP activity in the process of cartilage destruction, in both an RA and an OA model, using fluorescence imaging. CIA, a model displaying profound inflammatory cell influx and destruction, resembling RA, was used. On the other hand, the destabilization of the medial meniscus (DMM) model, displaying cartilage destruction as an effect of the instability of the joint caused by the rupture of the meniscus, but with less inflammatory cell influx, was used to resemble OA. Geurts and colleagues found no differences between human RA and OA synovial fibroblasts when using hierarchical clustering of gene expression profiles. 18 Using fluorescence imaging, we tried to unravel the local pathologic processes involved in both diseases. The activity of MMPs and cathepsins in these two different processes of cartilage damage was monitored using an activatable NIR fluorescent probe, and this may predict the amount of inflammation or cartilage damage caused during (osteo)arthritis. The CIA is a model that is highly dependent on interleukin-1 (IL-1), 19 and by treating these mice with anti-IL-1 antibodies, 20 we can also determine the sensitivity of the different probes to determine the response to therapy. We showed that using anti-IL-1 antibodies, the two probes are sensitive to treatment response and that cathepsins are not active at the time of cartilage damage in the DMM model, whereas both cathepsins and MMPs are active in the CIA model during disease progression.
Materials and Methods
Animals
For the CIA model, 12-week-old male DBA1/J mice and, for the DMM model, 12-week-old male C57Bl6/J mice were obtained from Janvier (Le Genest Saint Isle, France). All mice were housed in filtertop cages, and food and water were supplied ad libitum. All in vivo studies complied with national legislation and were approved by the local authorities of the care and use of animals.
Induction of Experimental Arthritis
Bovine type II collagen was dissolved in 0.05 M HAc to a concentration of 2 mg/mL and was emulsified in equal volumes of Freund's complete adjuvant (2 mg/mL of Mycobacterium tuberculosis strain H37Ra; Difco Laboratories, Detroit, MI). For the imaging experiment, 40 mice were used. Six nonarthritic animals were used as controls. For ribonucleic acid (RNA) isolation and subsequent microarray, 18 mice were used. Mice were immunized intradermally at the base of the tail with 100 μL emulsion (100 μg of bovine collagen type II). After 21 days, an intraperitoneal (IP) booster injection with bovine type II collagen dissolved in phosphate-buffered saline (PBS) was given. Clinical onset and progression were monitored by macroscopic scoring of the paws, on a scale of 0 to 2 for each paw, in a blinded fashion by two independent observers. Cumulative scoring based on redness, swelling, and, in later stages, ankylosis was as follows: 0 = no changes; 0.25 = one to two toes red or swollen; 0.5 = three to five toes red or swollen; +0.5 = swollen ankle; +0.5 = swollen footpad; 0.5 = severe swelling and ankylosis. Incidence at day 31 was calculated as the percentage of positive animals from the total amount of animals used. Mean severity was calculated as the mean macroscopic score of all paws. At day 31, mice were imaged and sacrificed and ankle joints were processed for histology.
Induction of Experimental OA
Destabilized medial meniscus OA was induced by transection of the medial anterior meniscotibial ligament as described by Glasson and colleagues. 21 Sham operations were included, which served as a control. For the imaging experiment, 12 mice were DMM operated, together with 4 sham operated mice. For RNA isolation and subsequent microarray, 6 mice were DMM operated. At day 56 after surgery, mice were imaged and sacrificed and knee joints were processed for histology.
Anti-IL-1α/β Treatment
As a treatment, CIA mice were given an IP injection with rabbit antimurine IL-1α and anti-IL-1β serum (1 mg Ig each) at day 22 after immunization. This dose revealed to be sufficient to suppress several murine arthritis models. 20 As a control, mice received an IP injection with normal rabbit serum (2 mg Ig).
Fluorescent Agents
Two commercially available fluorescent probes (PerkinElmer, Waltham, MA) were used to image the disease activity and efficacy of the treatment. The ProSense 680 probe becomes activated on enzymatic cleavage by cathepsins (B, L, and S), which are collagen-degrading lysosomal cysteine proteinases. The MMPSense 680 can be activated by various MMPs (2, 3, 12, and 13), known to degrade collagen and proteoglycans during arthritis.
Fluorescence Imaging
CIA mice received an intravenous (IV) injection with either ProSense (n = 16) or MMPSense (n = 24, 150 μL, 2 nmol) at day 31 of the model. DMM or sham mice received an IV injection with either ProSense (n = 4) or MMPSense (DMM; n = 8, sham; n = 4, 150 μL, 2 nmol) at day 56 of the model. At day 31 of the nonsynchronized CIA model, the mice had different disease severities, ranging from no clinical signs of arthritis to severe arthritis. This allowed us to correlate the fluorescent signal intensities to arthritis severity. Day 56 of the DMM model was chosen because this time point represents moderate to severe OA, 21 and at this time point, no effects are seen anymore from the surgical procedure, whereas at week 4, sham operated animals also showed MMP activity due to wound healing (data not shown). At the time of imaging (6 hours post IV injection), mice were anesthetized with 2.5% isoflurane/oxygen, shaved, placed on their back inside the light-tight chamber, and imaged with the IVIS Lumina (Caliper Life Sciences, Hopkinton, MA), using the Cy5.5 filter. The collected data were analyzed using Living Image 3.0 (Caliper Life Sciences). For the CIA model, two-dimensional regions of interest (ROI) were drawn around the ankle joints. For the DMM model, ROI were drawn around the knee joints. Fluorescence signal intensity was measured and corrected for background and tissue autofluorescence by using blue-shifted background filters.
RNA Isolation
For the CIA model, one synovial tissue sample from the lateral site and one from the medial site were isolated per knee joint, in a standardized manner, using a 3 mm biopsy punch (Stiefel, Wachtersbach, Germany). Biopsies were taken from 12 nondiseased and 12 arthritic knee joints (24 biopsies per group; 48 biopsies in total). Samples from both medial and lateral sites were pooled in a randomized fashion to generate triplicates for each group, and each triplicate consisted of eight biopsies. For the DMM model, two groups were made: DMM (right knee joints) and contralateral (left knee joints). Per knee joint, one synovial tissue sample from the lateral site and one from the medial site were isolated in a standardized manner using a 3 mm biopsy punch. Biopsies were taken from six mice. Samples were pooled to generate triplicates, and each triplicate consisted of four biopsies. Total RNA from the biopsies was prepared by TRIzol extraction (Invitrogen Life Technologies, Carlsbad, CA) and purified on an affinity resin (RNeasy Kit, Qiagen, Venlo, Limburg, the Netherlands) according to the manufacturer's instructions. Quantity and purity were assessed by the absorbance at λ = 260 nm (A260nm) and the ratio A260nm/A280nm. The integrity of the RNA was confirmed by nondenaturing agarose gel electrophoresis. Total RNA was stored at –80°C until further processing.
Oligonucleotide Array
One microgram of total RNA was used as a starting material for complementary DNA (cDNA) preparation. Generation of biotinylated cDNA and subsequent hybridization, washing, and staining of MOE 430_2 oligonucleotide arrays (Affymetrix, Santa Clara, CA) were performed according to the Affymetrix Expression Analysis Technical Manual for one-cycle amplification. The arrays were then scanned using a laser scanner GeneChip Scanner (Affymetrix), and data were analyzed and normalized using Affymetrix Microarray Suite 5.0 software according to the manufacturer's instruction. The gene expression data were deposited in the Gene Expression Omnibus database under accession number GSE13071.
Histology
CIA ankle joints and DMM knee joints were isolated, fixed in phosphate-buffered 4% formaldehyde, decalcified with 5% formic acid, dehydrated, and embedded in paraffin. Serial sections of 7 μm were made and stained with hematoxylin-eosin to study inflammatory cell influx and chondrocyte death or stained with safranin O to assess cartilage destruction and proteoglycan depletion. These histopathologic changes were scored on an arbitrary scale ranging from 0 to 3 per joint. For the CIA model, both hind paws of each mouse were examined. Cell influx (predominantly exudates of polymorphic neutrophils) was graded as follows: 0 = no inflammatory cells in the joint cavity; 1 = a few inflammatory cells in the joint cavity; 2 = joint cavity partly filled with inflammatory cells; 3 = joint cavity totally filled with inflammatory cells. Synovitis (characterized by monocyte and lymphocyte infiltration) was graded as follows: 0 = healthy, uninflamed appearance of the synovium; 1 = mild influx of inflammatory cells into the synovial lining; 2 = substantial influx of inflammatory cells into the synovium; 3 = severe influx of inflammatory cells into the synovium. Destruction of cartilage was graded as follows: 0 = normal appearance; 1 = minor destruction of the cartilage surface; 2 = clear loss of cartilage; 3 = cartilage almost absent. Chondrocyte death was graded as follows: 0 = no chondrocyte death; 1 = some chondrocyte death, evident by empty lacunae in the cartilage; 2 = most places of cartilage have empty lacunae; 3 = no chondrocytes present and a lot of empty lacunae. Proteoglycan depletion was graded as follows: 0 = no loss of safranin O red staining of glycosaminoglycans in the cartilage; 1 = some loss of red staining; 2 = moderate loss of red staining; 3 = total loss of red staining in the upper metabolically active layers of the cartilage (above the tidemark of the deeper calcified cartilage layer).
Immunohistochemical DIPEN Staining
For immunostaining, sections of CIA ankle joints and DMM knee joints were deparaffinized, rehydrated, and digested with proteinase-free chondroitinase ABC to remove the side chains of the proteoglycans. Subsequently, sections were treated with 1% hydrogen peroxide, 1.5% normal goat serum, and affinity-purified rabbit anti-DIPEN IgG (kindly provided by John Mort, Montreal, QC). Thereafter, sections were incubated with biotinylated goat antirabbit, and avidin-streptavidin-peroxidase (Elite kit, Vector Labs, Burlingham, CA) staining was performed. Counterstaining was done with orange G.
Statistics
Data are presented as mean ± standard error of the mean. Significance analysis was done using a two-tailed unpaired Mann-Whitney test when comparing two groups (GraphPad Prism version 4.0, GraphPad Software, San Diego, CA). Statistical correlations were made using the Pearson correlation coefficient. A p value < .05 was regarded as significant.
Results
Biophotonic Imaging of Local Cathepsin Protease Activity in the CIA Model
Mice immunized with collagen type II were imaged using the cathepsin-cleavable NIR fluorescent ProSense probe. A strong fluorescent signal was measured from the inflamed paws (Figure 1). In a separate study, microarray analysis was performed on synovial tissue biopsies obtained from knee joints. The obtained fluorescence signal coincided with enhanced expression of the ECM-degrading enzymes cathepsin K (≈ 9-fold) and cathepsin S (≈ 5-fold), compared to nondiseased knee joints (Table 1). Histologically, inflammatory cell influx can be seen in the joint space, as well as proteoglycan depletion in cartilage, seen as discoloration of the red-stained cartilage layer. Empty lacunae in the cartilage represent chondrocyte death. (Figure 2). The extent of the fluorescence signal significantly correlated (Pearson r = .81, p < .001) with the amount of inflammatory cell influx in the ankle joint (Table 2). The measured fluorescence signal intensity also correlated with other histologic changes as proteoglycan depletion (r = .78, p < .01) but not with chondrocyte death (Figure 3A) and cartilage erosion. This showed that the cathepsin activity in the arthritic joints, detected by the ProSense probe, is strongly correlated with synovial inflammation.
Differences in Upregulation of Genes between the Arthritic CIA Model and the OA DMM Model

CIA = collagen-induced arthritis; DMM = destabilization of the medial meniscus; MMP = matrix metalloproteinase; OA = osteoarthritis.
Gene expressions in synovial biopsies from knee joints of CIA at day 10 after booster and in synovial biopsies from knee joints at day 56 of the DMM model. MMP12 is the only MMP upregulated in the DMM model, whereas in the CIA model, MMP13, -3, and -2 are upregulated. This reflects different processes during cartilage damage in the DMM model compared to the CIA model. Depicted as fold increase compared to joints of nondiseased (CIA) or nonoperated animals (DMM).
p < .001
p < .01.
p < .05.
Correlation of the NIR Fluorescence Signal with Various Histologic Parameters in the CIA Model

CIA = collagen-induced arthritis; NIR = near-infrared.
p < .001.
p < .01.
p < .05.

Cathepsin and MMP activity is significantly higher in arthritic animals. A and C, Fluorescent signal intensity as measured by the IVIS Lumina, using ProSense or MMPSense, was higher in arthritic versus control animals (p < .05 for both ProSense and MMPSense measurements). This reflects higher cathepsin and MMP activity in the hind paws of arthritic animals. B and D, Histologic staining of ankle joints from arthritic animals with corresponding pictures of fluorescent imaging using ProSense or MMPSense (original magnification ×100). Influx of inflammatory cells, chondrocyte death, and corresponding fluorescence signal intensity were higher in arthritic joints. Histologic slides are representative for the corresponding fluorescent images. The arrowhead indicates chondrocyte death as presented by empty lacunae. c = calcaneus; CIA = collagen-induced osteoarthritis; i = influx of inflammatory cells.

Histologic staining of collagen-induced arthritis (CIA) in the ankle joint showed inflammation, cartilage damage, and DIPEN expression. Histologic staining of a nondiseased joint (A, C, E) and a joint with CIA (B, D, F). A and B, Safranin O staining; more proteoglycan depletion can be seen in joints with arthritis. C and D, DIPEN neoepitope staining representing MMP-mediated proteoglycan cleavage, with IgG control (inset). Strong DIPEN staining is present in joints with arthritis; no DIPEN staining is present in nondiseased joints. E and F, Hematoxylin-eosin staining, cartilage destruction, and chondrocyte death can be seen in joints with arthritis. The arrow indicats DIPEN staining; the arrowhead indicates chondrocyte death. C = calcaneus; CE = cartilage erosion; i = influx of inflammatory cells in the joint cavity. *Proteoglycan depletion. #Aspecific staining of inflammatory cells in the joint cavity.
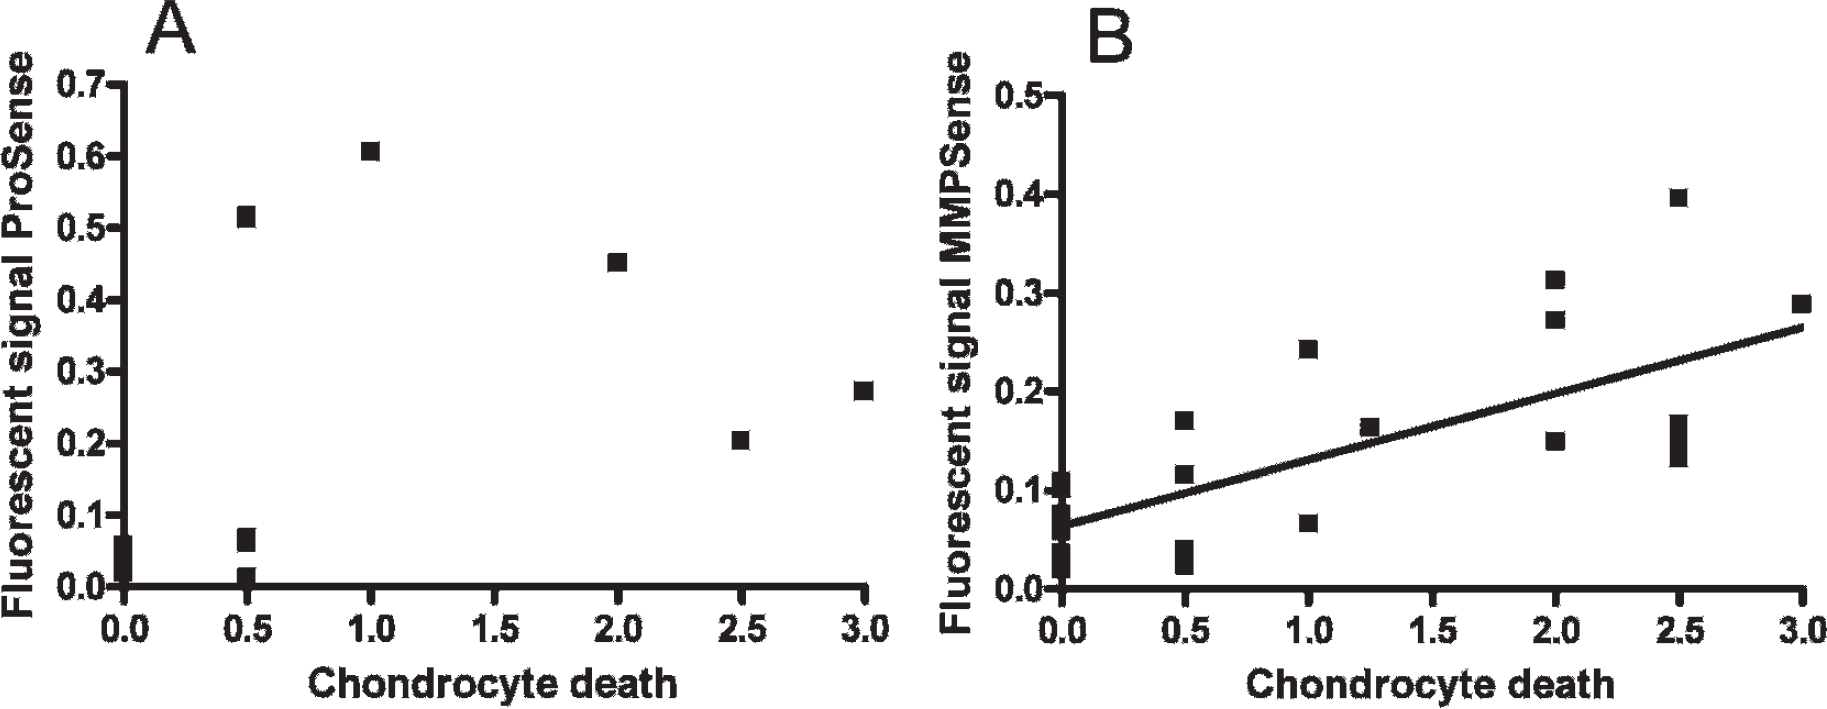
Fluorescent signal intensity of MMPSense, but not ProSense, correlated with chondrocyte death. A, No correlation can be seen between ProSense and chondrocyte death. B, A strong correlation can be seen between MMPSense and chondrocyte death.
Biophotonic Imaging of Local Cathepsin Protease Activity in the DMM Model
Cathepsin activity was measured 56 days after surgical induction of the DMM model at the time of joint pathology (Figure 4A). No difference between the contralateral and the operated knee was seen, indicating no cathepsin activity during the osteoarthritic process at this stage of the disease. The microarray analysis showed limited upregulation of cathepsins B (≈ 1-fold), S (≈ 2-fold), and K (≈ 3-fold) and no upregulation of cathepsin L genes (see Table 1). This confirmed that the lack of fluorescence signal was due to low levels of local cathepsin expression. No inflammatory cell influx was seen histologically (Figure 5), confirming the absence of inflammation seen with ProSense. Therefore, these results show that at this stage of the disease, no cathepsin activity was present in the knee joints.

Biophotonic imaging of knee joints of the osteoarthritic destabilization of the medial meniscus model showed MMP activity, but no cathepsin activity, in osteoarthritic knee joints. A, Fluorescence signal intensity of the ProSense probe did not show a difference between DMM and control knee joints, indicating no differences in cathepsin activity. B, Fluorescence signal intensity of the MMPSense probe was measured in the unilateral DMM model and sham operated animals. The ratio between DMM operated and corresponding control knee joints is significantly higher compared to the ratio between sham operated and control knee joints. C, Representative fluorescence image of a DMM operated mouse, imaged with MMPSense. D, Representative fluorescence image of a sham operated mouse, imaged with MMPSense. E, Representative fluorescence image of a DMM operated mouse, imaged with ProSense. n.s. = not significant.

Histologic staining of destabilization of the medial meniscus operated knee joints showed cartilage damage but no inflammation or DIPEN staining. Histologic staining of a nonoperated joint (A, D, G), a sham operated joint (B, E, H), and a DMM operated joint (C, F, I). A to C, Safranin O staining; no differences in proteoglycan depletion can be seen between the different treatments, whereas cartilage loss is visible in the DMM operated knee joint. D to F, DIPEN neoepitope staining representing MMP-mediated proteoglycan cleavage, with IgG control (inset). No difference in DIPEN staining can be seen between the different treatments. G to I, Hematoxylin-eosin staining, fissures, fibrillations, and loss of cartilage can be seen in the DMM knee joint, whereas no OA features are visible in the control and sham operated joints. The arrow indicates cartilage erosion. F = femur; T = tibia.
Biophotonic Imaging of MMP Activity in Arthritic CIA Joints
MMP activity in the arthritic joint was imaged using the MMP-activatable MMPSense probe (see Figure 1C). Microarray analysis showed that MMP13 was highly expressed (≈ 22-fold) in the inflamed synovium, as well as MMP3 (≈ 13-fold), also compared to MMP2, which was upregulated five times (see Table 1). The fluorescence signal of MMPSense correlated with the extent of cartilage proteoglycan depletion (r = .61, p < .01), joint inflammation (r = .66, p < .001), and cartilage erosion (r = .52, p = .01) (see Table 2). In comparison with the ProSense probe used in this study, the MMPSense correlated much better (r = .72, p < .001) with the histologically observed chondrocyte death (see Figure 3B). This shows that the MMPSense probe reflects MMP activity, which was strongly correlated with cartilage destruction.
Biophotonic Imaging of MMP Activity in Osteoarthritic DMM Joints
MMP activity, in contrast to cathepsin activity, was significantly increased in osteoarthritic knee joints compared to contralateral knee joints (see Figure 4B). This activation was not a result of the surgery itself because no MMP activity was seen in sham operated animals. According to the microarray analysis from synovial tissue biopsies, MMP12 was indeed upregulated almost 20 times (see Table 1). MMPs are involved in cartilage damage; therefore, histologic sections were examined to confirm cartilage damage, which was indeed seen as fibrillations, fissures, and sometimes complete loss of cartilage above the tight mark, as shown by the arrows (see Figure 5).
DIPEN Neoepitope Formation in Arthritic CIA and Osteoarthritic DMM Joints
Expression of DIPEN, a neoepitope in the proteoglycan core protein that can be cleaved by MMPs, was visualized by immunostaining. More DIPEN staining was seen in arthritic joints compared to nondiseased joints (see Figure 2). Staining was mostly seen in the chondrocytes but also in the damaged superficial cartilage. No differences in DIPEN staining were seen between contralateral and DMM knees, whereas cartilage damage was clearly present in DMM knee joints (see Figure 5). As expected, sham operated animals in the DMM model did not show DIPEN staining.
Anti-IL-1 Treatment in the CIA Model
Mice immunized with collagen type II were treated with anti-IL-1α/β polyclonal antibodies, as previously described. 19 Incidence and severity were suppressed by anti-IL-1 treatment (Table 3). At day 31 after immunization, mice were imaged using the ProSense and MMPSense probes. A strong fluorescence signal was measured from the inflamed paws, whereas the signal was significantly lower in the group that had received the anti-IL-1 treatment (see Table 3). Analysis of the paws histologically confirmed the antiinflammatory effect of IL-1 blockade and associated lower fluorescence signals in these mice (Figure 6). The histologic score of inflammation was 1.2 in normal rabbit serum (NRS)-treated mice and 0.2 in anti-IL-1-treated mice. Also on histology, a reduction in chondrocyte death was seen; mice treated with NRS had a histologic score for chondrocyte death of 1.1, whereas the anti-IL-1–treated mice had a score of 0.25. No DIPEN expression was seen in animals treated with anti-IL-1 (see Figure 6).
Incidence, Severity, and Fluorescence Signal of CIA at Day 31 after Immunization Is Lower in Mice Treated with Neutralizing Rabbit Antimurine IL-1α/β Antibodies
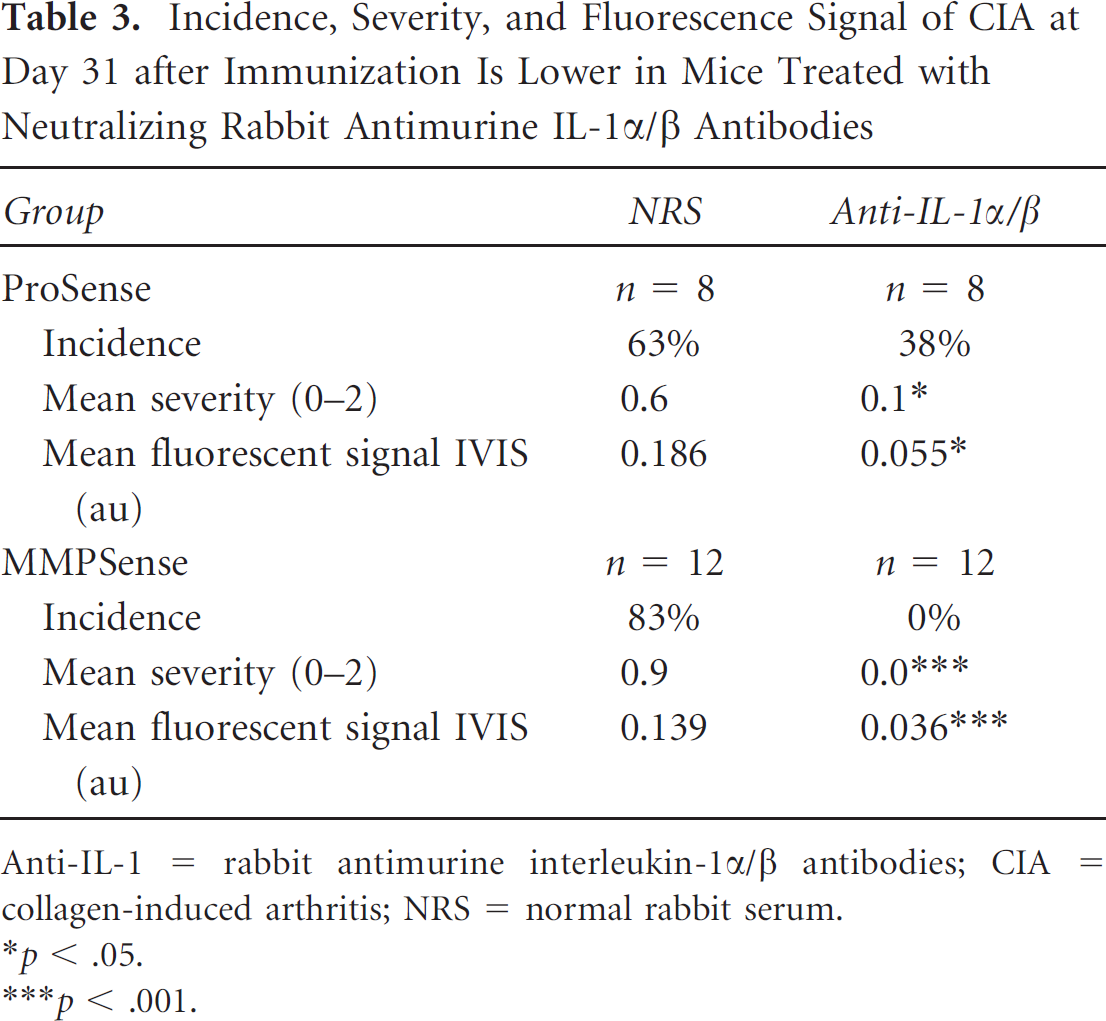
Anti-IL-1 = rabbit antimurine interleukin-1α/β antibodies; CIA = collagen-induced arthritis; NRS = normal rabbit serum.
p < .05.
p < .001.

Histology and representative biophotonic imaging of anti-IL-1-treated animals. Histologic staining and representative fluorescent images of joints from anti-IL-1-treated animals, imaged with either ProSense (A, C, E, G) or MMPSense (B, D, F, H). A and B, Safranin O staining; no proteoglycan depletion can be seen on anti-IL-1 treatment. C and D, DIPEN neoepitope staining representing MMP-mediated proteoglycan cleavage, with IgG control (inset). There is no DIPEN neoepitope formation present in joints from anti-IL-1-treated animals. E and F, Hematoxylin-eosin staining; no inflammation or chondrocyte death can be seen. C = calcaneus.
Discussion
In this study, we have shown, using NIR fluorescence imaging, that MMPs are active during the process of irreversible cartilage destruction in both RA and OA experimental models. Cathepsin activity was seen only in the RA model. In the CIA model, inflammation and destruction are correlated, whereas the DMM model showed MMP activity without notable inflammation, suggesting a role for MMPs but not for cathepsins in the DMM model.
CIA is characterized by a polyarticular chronic inflammation, and the inflamed knees and paws can be imaged using NIR fluorescent probes. The ProSense probe is most sensitive for cleavage by cathepsin B, an enzyme highly expressed in monocytes and dendritic cells and enhanced in the inflamed synovium. 7 On the other hand, cathepsin B is also proposed as a diagnostic marker for OA. 14 We found increased gene expression and enzyme activity of cathepsins in the inflamed synovial tissue and the arthritic joint in the CIA model. The signal intensity of ProSense was correlated with cartilage proteoglycan depletion, illustrating the potential proteoglycan degrading activity as was shown for especially cathepsin L. 22 No cathepsin activity, and only a marginal upregulation of cathepsin genes, was found in the DMM model, corresponding to a limited role for cathepsins at this stage of the OA model.
Like cathepsins, MMP levels are also lower during OA compared to RA. 23 In our study, MMP upregulation was seen in both the CIA and the DMM model, on gene expression levels, and when using fluorescence imaging. The MMPSense probe is activated by a range of MMPs (MMP2, -3, -12, -13) and therefore does not distinguish between these different MMPs. Interestingly, when looking at the microarray, different MMPs are upregulated in the CIA model (MMP2, -3, and -13) when compared to the DMM model (MMP12). In the CIA model, the fluorescence signal intensity of the MMPSense probe seems to correlate with chondrocyte death, whereas in the DMM model, the MMPSense signal is also upregulated, but there is no chondrocyte death. This can also be caused by the upregulation of different MMPs in the two models.
Aggrecan, a major proteoglycan in cartilage, can be cleaved by MMPs 15 or cathepsin B 17 between the first and second globular domains of the core protein, leaving a specific neoepitope of the amino acids DIPEN. The amount of DIPEN in cartilage is a marker of cartilage proteoglycan degradation and can be immunohistochemically detected in the cartilage of experimental models of arthritis. 24 Because no DIPEN staining was seen in early stages of CIA with mild proteoglycan depletion, as demonstrated with safranin O staining, van Meurs and colleagues speculated on a limited role for MMPs early in disease. 24 In later stages of CIA, with marked proteoglycan depletion, a strong DIPEN staining was visible at sites where cartilage erosion was abundant. For this, DIPEN was considered a marker of irreversible cartilage damage. Another group also showed a delayed response of MMPs in cartilage explants; the MMPs were activated and started to cleave aggrecan only after 12 days of culture. 25 We observed DIPEN expression in the CIA model, which correlated with MMP activity, measured by the fluorescent probe. Interestingly, we did not see DIPEN staining in the DMM model, whereas fissures, fibrillations, and cartilage loss were confirmed histologically. This discrepancy could have been caused by the differences between the strains of mice used in this study, the DBA1/J for the CIA model and the C57Bl6/N for the DMM model. 26 Another explanation could be the lack of cathepsin activity in the DMM model. Mort and colleagues showed that cathepsins can cleave aggrecan by endo- and exopeptidase activity and leave the DIPEN neoepitope in the cartilage. 17 Because we only saw MMP activity and no cathepsin activity in the DMM model, this MMP activity may not be enough to activate DIPEN neoepitope formation. On the other hand, it is known that MMP3 and -13 can produce the DIPEN neoepitope, 27 whereas MMP12 is mostly regarded as an MMP that is involved in elastin degradation and the inhibition of chemokines. 28 According to our microarray, MMP3 and -13 are upregulated in the CIA model, giving DIPEN expression, whereas only MMP12 is upregulated in the DMM model, giving no DIPEN expression. It is also shown that MMP12 is mostly expressed by M2 macrophages, 29 whereas Tsuneyoshi and colleagues showed that there are more M2 macrophages present in the synovial tissue of OA patients compared to that of RA patients. 30 This can explain the upregulation of MMP12 in the DMM model, whereas on the other hand, no MMP12 upregulation was seen in the CIA model.
We previously showed that CIA in mice is highly dependent on the cytokine IL-1 and either treatment with neutralizing antibodies or with the IL-1 receptor antagonist can prevent onset and cure CIA in mice.19,20 In the present study, IL-1 was used to investigate the sensitivity of the fluorescent probes to a treatment response. Both the ProSense and the MMPSense signals were markedly lower in mice treated with anti-IL-1 antibodies, reflecting lower cathepsin and MMP activity. As a consequence, the effects of anti-IL-1 were also seen on histology; almost no inflammatory cell influx, no proteoglycan depletion, and almost no chondrocyte death were present. Also, no DIPEN expression was seen. This is in line with the study by van Meurs and colleagues, who found that IL-1 is involved in DIPEN expression; therefore, blocking IL-1 can prevent this neoepitope formation. 24
We showed that NIR fluorescent probes are useful tools to measure enzyme activity in the (osteo)arthritic joint in real time and quantitatively. We demonstrated that the measured NIR fluorescence signal intensity is correlated with pathologic changes and can be used to monitor the antiinflammatory effect of therapeutics, as we showed for anti-IL-1 in this study. Furthermore, in experimental settings, NIR fluorescence can provide additional information on the pathophysiology of arthritis, and in combination with histologic evaluation of pathology and gene expression, it may provide new insight into the enzymes that are potentially involved in cartilage damage, as shown by DIPEN staining on histology.
Footnotes
Acknowledgment
Financial disclosure of authors: This research was supported by the 7th Framework Programme for Research (project NanoDiaRA, NMP-2008-4.0-1, No 228929) and by the Center for Translational Molecular Medicine, project “TRACER.” Financial disclosure of reviewers: None reported.