
Abstract
The aim of this work was to quantify the brain distribution of the enzyme aromatase in the female baboon with positron emission tomography and the tracer [11C]vorozole using three different quantification methods for estimating the total distribution volume (VT): a graphical method, compartment modeling, and a tissue to plasma ratio. The graphical model and the compartment modeling gave similar estimates to the data and similar values (correlation R = .988; p = .0001). [11C]Vorozole shows a rapid uptake by the brain followed by a relatively constant accumulation, suggesting the possibility of using the tissue to plasma ratio as an estimate of VT. The highest uptake of [11C]vorozole in the baboon brain was measured in the amygdala, followed by the preoptic area and hypothalamus, basal ganglia, and cortical areas. Pretreatment studies with vorozole or letrozole showed a generalized decrease in brain accumulation and VT. The results suggested that the physiologic changes in gonadal hormone levels accompanying the menstrual cycle had a significant effect on brain aromatase VT.
THE LAST STEP in estrogen biosynthesis is the conversion of androgens to estrogens, which is catalyzed by the cytochrome P-450 aromatase. 1 This enzyme is a key element in brain sexual differentiation and neural development. 2 Brain aromatase is also involved in neuroprotection 3 and Alzheimer disease. 4
Studies performed in rodents and nonhuman primate brains show that there are high levels of expression of aromatase in the amygdala, bed nucleus of stria terminalis, and preoptic area, followed by the hypothalamic nuclei, hippocampus, and temporal cortex.5,6 Aromatase activity can be inhibited by steroidal (reversible and irreversible binding) and nonsteroidal compounds (reversible binding). Aromatase inhibitors are used clinically as adjuvant therapy for breast cancer in postmenopausal patients.7–9 Use of aromatase inhibitors is also reported among body builders and athletes. 10
Vorozole is a potent, stereoselective nonsteroidal aromatase inhibitor. 11 This compound was labeled with [11C] 12 and was used to measure the brain distribution of aromatase in nonhuman primates in vivo using positron emission tomography (PET). 13 The tracer showed a high uptake in the amygdala and preoptic area, which was blockable by administration of unlabeled vorozole. Quantification was done by calculating the standardized uptake value, and full kinetic modeling was not performed. We recently reinvestigated the labeling of vorozole with 11C and reported its distribution in baboon brain. 14
The development of new radioligands requires the validation of the quantification method, by testing different approaches and comparing the results obtained. The aim of this work was to assess and to quantify the brain distribution of the enzyme aromatase by using PET and [11C]vorozole data. We compared the graphical model, 15 compartment modeling, and a ratio approach. Furthermore, we used these methods to assess the regulation of brain aromatase by physiologic changes in gonadal hormone accompanying the female baboon menstrual cycle.
Material and Methods
Synthesis of [11C]Vorozole
(S)- and (R)-vorozole and (S)- and (R)-nor-vorozole were obtained from Johnson & Johnson Pharmaceutical Research and Development (Beerse, Belgium). Radiotracer synthesis was performed as recently described. 14 Briefly, to (S)-norvorozole (4.1 mg, 3.22 μmol) in dimethyl sulfoxide (300 μL) was added 5 M potassium hydroxide (1 μL, 1.6 Eq). After vortexing for 30 seconds, the reaction mixture was transferred into a V-shaped reaction vessel. [11C]Methyl iodide was purged into this solution at room temperature, and peak trapping was observed by a pin-diode detector. The reaction mixture was heated to 90°C for 3 minutes and then cooled and diluted with high-performance liquid chromatography (HPLC) eluent and chromatographed using a solvent mixture of water (pH 3.0, adjusted with formic acid)/methanol (45/55) at a flow rate of 1 mL/min on a Luna PFPP(2) (250 mm × 10 mm, 5 μ; Phenomenex, Torrance, CA). [11C]-(S)-Vorozole, eluted at 24.5 minutes, was collected, and the solvent was removed by azeotropic evaporation with acetonitrile under the reduced pressure. The residue was dissolved in saline (4 mL), filtered through a 0.22 mm Millipore filter (Millipore Corp., Billerica, MA) into a sterile vial. The radiochemical purity was > 99%. Specific activity was measured by radioactivity/mass (Ci/μmol). Radiochemical purities were measured by analytical HPLC using aqueous formic acid solution (pH 3.0)/methanol (1/2) at a flow rate of 1 mL/min on a Luna PFPP(2) (250 mm × 4.6 mm, 5 μ; Phenomenex). The product co-eluted with “cold” vorozole. [11C]-(R)-vorozole, and the inactive enantiomer was synthesized from (R)-norvorozole using the same procedure.
[11C]Vorozole PET Studies
All animal studies were reviewed and approved by the Brookhaven Institutional Animal Use and Care Committee. PET imaging was carried out on a Siemens (Siemens, Germany) HR+ high-resolution, whole-body PET scanner (4.5 × 4.5 × 4.8 mm3 full width at half-maximum at the center of the field of view) in three-dimensional acquisition mode. A transmission scan was performed using a 68Ge rotating rod source before the emission scan to correct for attenuation during reconstruction. Emission data were acquired for 90 minutes with the following scanning protocol: 1 × 10 seconds, 12 × 5 seconds, 1 × 20 seconds, 1 × 30 seconds, 8 × 60 seconds, 4 × 300 seconds, and 8 × 450 seconds. Twelve [11C]vorozole PET studies in three different female baboons were performed: seven under baseline conditions, three after pretreatment with vorozole (two with 0.1 mg/kg and one with 0.05 mg/kg 5 minutes prior to the tracer injection), one after pretreatment with letrozole (0.1 mg/kg, 5 minutes prior to the tracer injection), and one where the inactive optical isomer was injected as radiotracer. The stage of the menstrual cycle was monitored by visual inspection of the perianal region. For the PET study, the animal was initially sedated with an intramuscular injection of ketamine hydrochloride (10 mg/kg) and maintained on gaseous anesthesia (isoflurane [Forane] 1.0–4.0%), oxygen, and nitrous oxide throughout the study. Catheters were placed in a popliteal artery for arterial blood sampling and in the arm vein for radiotracer injection. The average injected dose (± SD) of [11C]vorozole was 3.74 ± 1.03 mCi (specific activity averaged [± SD] 19.31 ± 6.49 mCi/nmol). Arterial blood was drawn continuously during the first 2 minutes after tracer injection and then at 5, 10, 20, 30, 60, and 90 minutes using an automated blood sampling machine (Ole Dich, Germany). Blood samples were placed into heparinized vials for subsequent radioassay. Blood samples at 1, 5, 10, 30, 60, and 90 minutes were also used for solid-phase analysis to determine the fraction present of [11C]vorozole. During the entire scanning procedure, vital signs were monitored and automatically recorded (heart rate, respiration rate, oxygen partial pressure, and temperature).
Solid-Phase Analysis of Plasma Samples
Plasma samples (200–400 μL) were diluted in 3 mL water and applied onto 2 mL with 500 mg C18 Seppak previously conditioned with 5 mL methanol followed by 5 mL water and preloaded with 2 mL of water. The combined sample and preload water volumes (3 + 2 mL) were pushed through using N2 gas until the dead volume of the solid phase (SP) sample was cleared and collected together in a sample tube. The SP sample was rinsed sequentially with 3 × 5 mL of water, each collected separately and counted. The activity remaining on the C18 Seppak was [11C]vorozole and was counted. The percentage unchanged was reported as the fraction of the C18 SP activity to the total radioactivity recovered in all fractions. Radioactivity recoveries (all fractions and SP/total applied) were typically 90 to 110%. This SP method was implemented on a Zymark Laboratory robot and validated using the HPLC method reported previously. 14
Image Analysis
PET images were reconstructed using the filtered backprojection algorithminto a 128 × 128 × 63 matrix, voxel size 1.72 × 1.72 × 2.43 mm3, and coregistered to a baboon magnetic resonance imaging (MRI) template 16 by maximizing their mututal information (using the SPM5 program, University College of London, UK). Regions of interest (ROI) were manually drawn over the MRI template: amygdala, caudate, cerebellum, cortical white matter, occipital cortex, preoptic area, putamen, brainstem, temporal cortex, thalamus, and whole brain. ROI were applied to the PET data to obtain the corresponding time-activity curves (TACs). TACs were quantified by applying the graphical analysis 15 and a two-compartment model 17 to determine the distribution volume (VT), a parameter that gives an estimation of the amount of available enzymes. K1 was obtained from the TACs in the ROI and the plasma using a two-compartment model. A ratio approach was obtained using an average of the ROI concentration of [11C]vorozole between 70 and 90 minutes to the average [11C]vorozole concentration in the arterial plasma at the same time intervals.
The effect of pretreatment with vorozole or letrozole on brain [11C]vorozole binding was tested by two-way analysis of variance (ANOVA treatment × region) followed by post hoc regional comparisons by Fisher protected least significant difference test with a p < .05 considered significant. Statistical analysis was carried out with StatView 4.1, for Apple Macintosh. Test–retest variability was assessed in both baseline and vorozole pretreatment studies in two animals. The effect of the estrus cycle was tested in a similar fashion comparing the estrus to the nonestrus phases of the cycle.
Results
Brain Distribution and Kinetics
[11C]Vorozole shows a rapid uptake by the brain, reaching a maximum before 3 minutes postinjection. Brain clearance was also rapid until ≈ 20 minutes postinjection, when it reached a relatively steady accumulation throughout the end of the study (90 minutes postinjection) (Figure 1). The uptake of [11C]vorozole in the baboon brain was highest in the amygdala, followed by the preoptic area and hypothalamus (Figure 2). Although we saw uptake in the hypothalamus, no ROI was drawn because of the small size of this region. Other brain regions, such as the caudate and putamen, occipital and temporal cortex, and cerebellum and brainstem showed a lower uptake, as can be seen in Figure 2. Pretreatment studies with vorozole or letrozole showed a generalized decrease in brain accumulation (see Figure 2). The inactive enantiomer of vorozole, [11C]R-vorozole, does not accumulate in the brain (see Figure 1).

Mean time-activity curves for [11C]vorozole at baseline (bas, filled circle) and after vorozole pretreatment (blo, empty circles) in the (A) amygdala, (B) preoptic area, (C) cerebellum, and (D) amygdala after vorozole and letrozole (letro) pretreatment and when the inactive enantiomer was injected as radiotracer. iso = optical isomer radiotracer.

[11C]Vorozole brain distribution. The upper row shows the magnetic resonance imaging (MRI) coronal sections of the template chosen. Regions of interest (ROI) are indicated with an arrow. The second row shows a baseline positron emission tomographic study (summed frames minutes 20–90) overlayed over the MRI template. The third row shows a pretreatment study with vorozole (0.1 mg/kg) and the fourth row the corresponding distribution when pretreatment was done with letrozole (0.1 mg/kg). The last row corresponds to the study where the optical isomer was injected. amy = amygdala; cau = caudate; cb = cerebellum; hypo = hypothalamus; occ = occipital cortex; put = putamen; poa = preoptic area; stem = brainstem; temp = temporal.
Plasma Concentration
The percentage of unchanged fraction in plasma for [11C]vorozole was high (82–94% at 30 minutes postinjection, 79–86% at 60 minutes postinjection). The plasma integral of [11C]vorozole was relatively large compared to other tracers, such as [11C]raclopride. There was no significant difference in the mean of plasma integral at 90 minutes for the baseline and the blocked studies (baseline = 6,124 nCi/cc × minutes vs blocked = 6,255 nCi/cc × minutes; p = .7).
Kinetic Analysis
Table 1 reports the mean (± SD) distribution volumes obtained from the graphical analysis (VTg) and the two-compartment model (VT2c). The table also includes the mean (± SD) K1 values (obtained with the two-compartment model) and the ratio ROI to blood.
Quantification of [11C]Vorozole Brain Uptake Using Different Models

Quantification results (mean ± SD) in baseline conditions (n = 7) and after vorozole pretreatment (n = 3): distribution volume graphical method (VTg, in mL/mL), VT two-compartment model (VT2c, in mL/mL), K1 tissue to plasma transport constant (mL/[min mL]), and ratio region of interest (ROI) to blood summing frames from minutes 70 to 90 (ROI/blood).
0.05 < p < .09.
0.1 < p < .05.
0.001 < p < .01.
Both the VTg and the VT2c gave similar estimates to the data and similar values (correlation R = .988; p = .0001); thus, we only used the values from the graphical analysis for our analysis. The VTg rank order was highest in the amygdala (VTg = 2.69), preoptic area, and cortical white matter, followed by the putmen, occipital cortex, and thalamus, and the lowest VTg was found in the cerebellum, brainstem, and temporal cortex (VTg = 1.53). The regional distribution effect was highly significant (two-way ANOVA p < .0001, followed by post hoc comparisons; see Table 1).
When the ratio ROI to blood (RB) approach was used, the highest value was also found in the amygdala (RB = 2.30), followed by the preoptic area, cortical white matter, thalamus, putamen, caudate, brainstem, occipital cortex, cerebellum, and temporal cortex (RB = 1.60). The regional distribution effect was not significant (two-way ANOVA p = .676).
The agreement between VTg and RB values was very high (paired t-test p = .666). The results seem to indicate that RB slightly underestimates the highest VTg values. When each ROI was analyzed separately, only the amygdala showed a trend toward significance (p = .089).
Vorozole pretreatment induced a significant decrease in the measured VTg in the amygdala (57%, p = .010), preoptic area (41%, p = .030), and occipital cortex (24%, p = .085). The rest of the ROI showed the smallest (and nonsignificant) decrease. The blocking effect of vorozole in the ratio RB was also significant in the amygdala (48%, p = .010) and preoptic area (41%, p = .014) but not in the occipital cortex (21%). The rest of the ROI considered, again, showed a small (and nonsignificant) decrease. The decrease in the VTg was also significant when the baboon was pretreated with the specific aromatase inhibitor letrozole (p < .0001) and when the inactive enantiomer ([11C](R)-vorozole was administered (p < .0001) (data not shown).
The highest value for K1 was found in the cerebellum (0.16 mL/[min ml]) and the lowest in the cortical white matter (0.09 mL/[min mL]). Vorozole pretreatment did not induce any change in the estimated K1s.
Effect of Estrus
A considerable test–retest variability was obtained in the VTg and RB parameters for two baboons who were scanned at baseline on two different days (eg, the percent difference in baseline VTg in amygdala for one baboon was 50% and for the other it was 21%). To test if the stage of the cycle could play a role, regional VTg and the ratio RB were compared in the same animals when in estrus versus nonestrus(n = 3). The results show that the mean VTg and RB were decreased in all ROI when the animal was in estrus (Figure 3). There was a significant effect of both the stage of the cycle and ROI (p < .001) on VTg, with a stage × ROI interaction term showing a trend toward significance (p = .08). The stage of the cycle was a significant effect in RB (p < .007), and there was a trend toward significance for the ROI effect (p < .078). We note that the decrease in binding in response to vorozole pretreatment was larger (VTg amygdala 57%) than the effect of the estrus cycle per se.
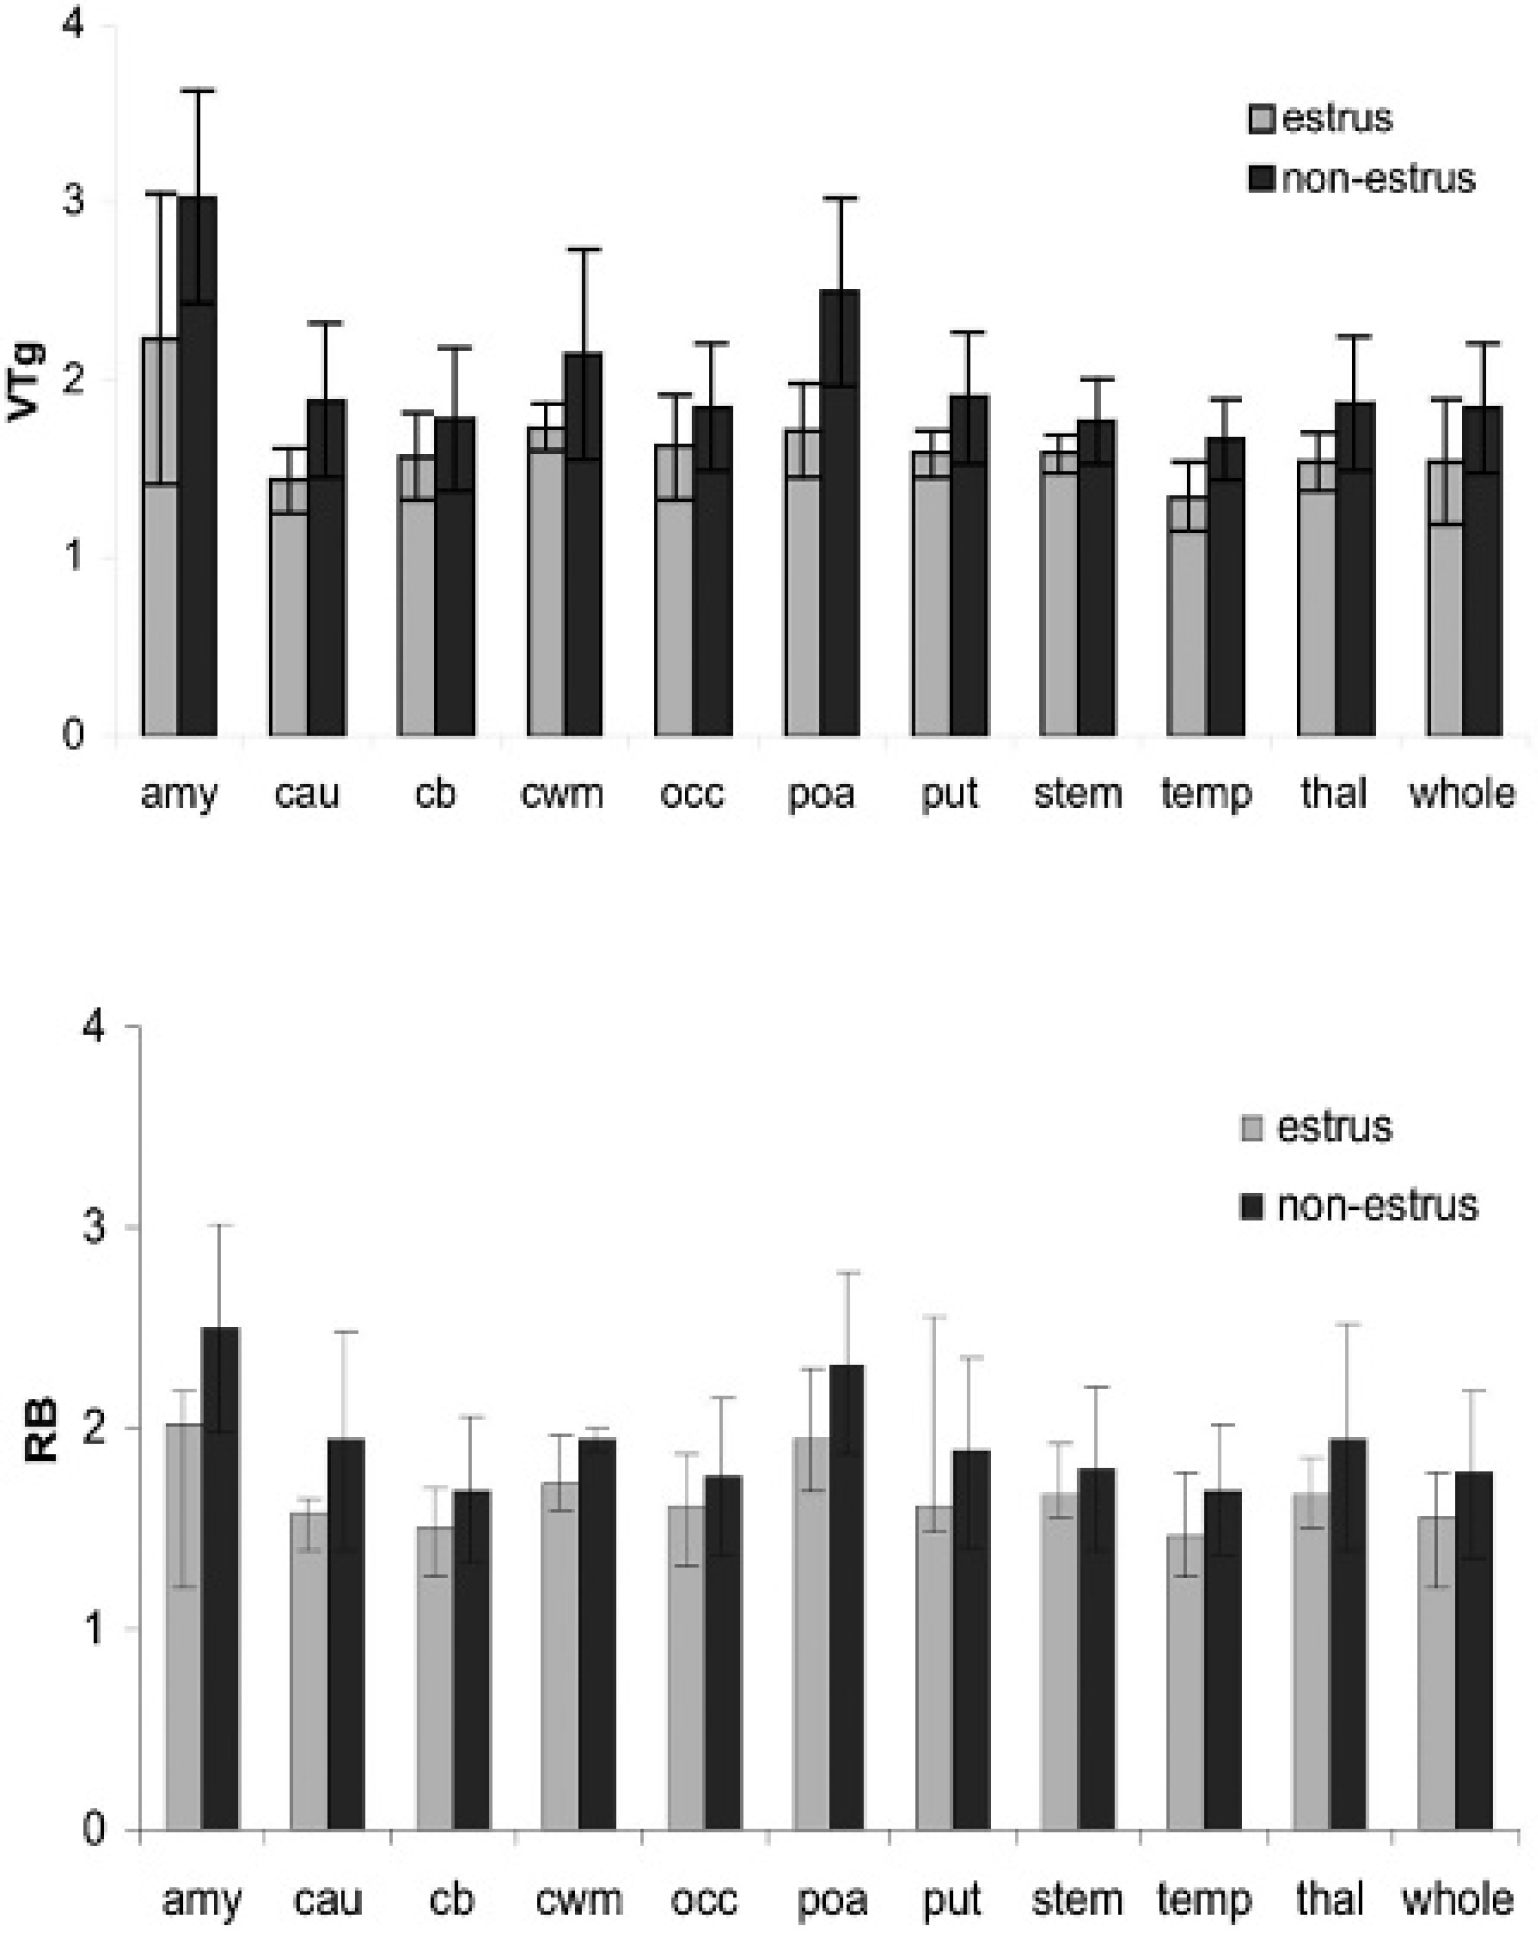
Effect of estrus cycle on [11C]vorozole distribution. Mean baseline studies performed when animals were in estrus compared to studies performed when the same animals were not in estrus. The graphs depict the regional distribution of the graphical distribution volume (VTg, top panel) and ratio region of interest to blood (RB, bottom panel). There was a significant effect of both cycle phase and region (p < .001) on VTg, with a phase × region interaction term showing a trend toward significance (p = .08). The stage of the cycle was a significant effect in RB (p < .007), and region showed a trend toward significance (p < .078). amy = amygdala; cau = caudate; cb = cerebellum; cwm = cortical white matter; occ = occipital cortex; poa = preoptic area; put = putamen; stem = brainstem; temp = temporal cortex; thal = thalamus; whole = whole brain.
Discussion
This study reports the distribution of the enzyme aromatase in the baboon brain, using [11C]vorozole and PET, and three methods for quantitating the uptake of this tracer. Aromatase distribution in the rhesus brain has already been reported, 13 although full kinetic modeling was not performed. Kinetic analysis of the data reported here was performed using a two-compartment model and graphical analysis for reversible tracers. The results obtained with these two methods can be considered identical. For comparison, a ratio of the mean value of counts in the ROI (70–90 minutes) over the blood (metabolite corrected) has also been proposed. The values obtained using the ratio RB approach do not differ from the VTg (paired t-test, p = .666), although the results suggest that RB underestimates the highest VTg values. When each ROI was tested separately, only the amygdala (the ROI with the highest VTg) showed a trend toward underestimation, although it was not significant (p = .089). The RB approach using the last 20 minutes of the acquisition data agreed well with the full-kinetic modeling results.
The K1 values obtained range between 0.09 and 0.16 mL/(min mL), much lower than blood flow (0.50 mL/[min mL]).
The blocking studies performed with cold vorozole, letrozole, and the optical isomer suggest that the binding is specific and saturable. All the ROI evaluated in this study presented a certain degree of blocking after vorozole pretreatment, even the cerebellum (22%, although the effect was not significant), which has been used before as a reference region in PET studies. 13 This result discourages us from using a reference tissue model or a ROI to cerebellum ratio. From our results, the brainstem is a region with only a modest decrease (13%). When we used the ratio approach proposed by Takahashi and colleagues with the cerebellum as a reference (results not shown), vorozole pretreatment and regional distribution were both significant effects (p < .0001). The effect of blocking was significant in more ROI (amygdala, caudate, preoptic area, temporal cortex, thalamus, and the whole brain). The ratio ROI to cerebellum presented a much lower standard deviation (compared to the VTg; results not shown), probably justifying these results.
The fact that after 20 minutes postinjection the TACs showed a relatively steady accumulation throughout the end of the study and that the percentage of unchanged plasma fraction in plasma was high, even at 60 minutes postinjection (79–86%), supports the idea of using a late-time ratio ROI to blood approach, such as the one proposed here. A late-time ROI to blood measurement can be very useful when performing human PET studies because it will avoid the need of an arterial input function. At such late time points, arterial and venous blood samples have an identical time course.
The distribution of aromatase cytochrome P-450 messenger ribonucleic acid (mRNA) has been reported in the adult rhesus monkey brain. 18 In males, the highest levels were found in the bed nucleus of stria terminalis and medial preoptic/anterior hypothalamus followed by the amygdala. Undetectable levels were found in the cingulate and parietal cortex, hippocampus, and cerebellum. Our results indicate that aromatase enzyme levels are higher in the amygdala compared to the preoptic area; the hypothalamus was not measured in this study, although it may have partly been included in the preoptic area measurements. This disagreement can be explained in terms of species (rhesus vs baboon) and sex (males vs females) differences. In addition, PET resolution has a larger effect on the uptake measurements from small regions (such as the preoptic area, compared to the amygdala). Finally, if a region has a higher mRNA expression compared to another region, it does not always mean that the protein levels will be expressed in the same proportion.
We should also consider that since our study included females at different stages of the cycle, estrogen fluctuations could also play a role. Previous studies have reported that aromatase mRNA expression is not affected by estrogen fluctuations, although only the hippocampus and temporal cortex were assessed. 6 The high test–retest variability obtained in three baseline studies could be attributed to the stage of the cycle.
Applying the kinetic analyses described here to the possible modulation of aromatase by physiologic fluctuations in female gonadal hormones, we found that estrus females (high circulating levels of estrogen) had significantly lower VT compared to the same females when they were not in estrus, when estrogen levels in the plasma are expected to be relatively low. The amygdala and preoptic area/hypothalamus, regions containing the highest levels of aromatase and estrogen receptor alpha receptors in the primate brain, 19 showed the most pronounced effects.
Footnotes
Financial disclosure of authors: PET studies were carried out at Brookhaven National Laboratory using the infrastructure support of the US Department of Energy OBER (DE-AC02-98CH10886). This work was supported in part by National Institutes of Health grants R01 NS050285 (to A.B.), K05DA020001 (to J.S.F.), and MO1RR10710 (to the General Clinical Research Center of Stony Brook University).
Financial disclosure of reviewers: None reported.