
Abstract
The development of high-affinity radiotracers for positron emission tomography (PET) has allowed for quantification of dopamine receptors in extrastriatal and striatal regions of the brain. As these new radiotracers have distinctly different kinetic properties than their predecessors, it is important to examine the suitability of kinetic models to represent their uptake, distribution, and in vivo washout. Using the simplified reference tissue model, we investigated the influence of reference region choice on the striatal binding potential of 18F-fallypride, a high-affinity dopamine D2/D3 receptor ligand. We compared the use of the visual cortex and a white matter region (superior longitudinal fasciculus) to the cerebellum, a commonly used reference tissue, in a PET-fallypride study of healthy and methamphetamine-dependent subjects. Compared to the cerebellum, use of the visual cortex produced significantly greater sample variance in binding potential relative to nondisplaceable uptake (BPND). Use of the white matter region was associated with BPND values and sample variance similar to those obtained with the cerebellum and a larger effect size for the group differences in striatal BPND between healthy and methamphetamine-dependent subjects. Our results do not support the use of the visual cortex as a reference region in 18F-fallypride studies and suggest that white matter may be a reasonable alternative to the cerebellum as it displays similar statistical and kinetic properties.
The reference tissue model (RTM) was developed for autoradiography and PET to simplify the standard quantification method for radiotracer kinetic analysis, which requires an arterial plasma input function based on radioactivity of the free radiotracer (not the protein-bound parent compound or metabolites).1–3 This two-tissue compartment model (four parameters) was originally applied to, and validated for, tracers with relatively fast kinetics and modest receptor binding potentials (BPND: binding potential relative to nondisplaceable uptake) in the range of 1 to 5 (eg, 3H-diprenorphine and 11C-raclopride). Although the RTM produces large BPND values, it converges slowly (often not at all), and the standard errors of the parameters estimated in the model (R1, k2, and k3) tend to be large. 4 A subsequent simplification of the RTM method, the simplified reference tissue model (SRTM), 4 was developed to address these problems. The SRTM is a single-tissue compartmental model (three parameters) applicable only to radiotracers that produce regional time-radioactivity curves (TACs) that can be fit satisfactorily to a single exponential form. The SRTM was validated in human subjects for 11C-SCH23390 and 11C-raclopride, tracers that meet this requirement. 4 However, a simulation study of the binding of 11C-WAY-100635, 5 which has slower kinetics and higher affinity, showed that estimates of BPND obtained with SRTM can have substantial errors.
RTMs have also been applied to 11C- and 18F-labeled receptor ligands that exhibit relatively slow kinetics and yield very high values of BPND (in the range of 10 to 40). Striatal BPND values for these tracers in different laboratories vary substantially (Table 1). Although these differences may be influenced by definitions of the target and reference tissues, scanning duration, and processing methods, it is unlikely that these factors explain the large ranges of published striatal BPND values. Differences across scanner models are likely due to the implementation of various software programs for scatter and attenuation correction during reconstruction. To help clarify the source of the variation in measurements across laboratories, we review the advantages of the RTM and SRTM in neuroreceptor imaging and the stringent requirements for their use and extend this discussion to an investigation of the influence of choice of reference region on BPND using 18F-fallypride.
Variation of Reported 18F-Fallypride BPND from Reference Region Methods with the Cerebellum as a Reference Region in Healthy Subjects
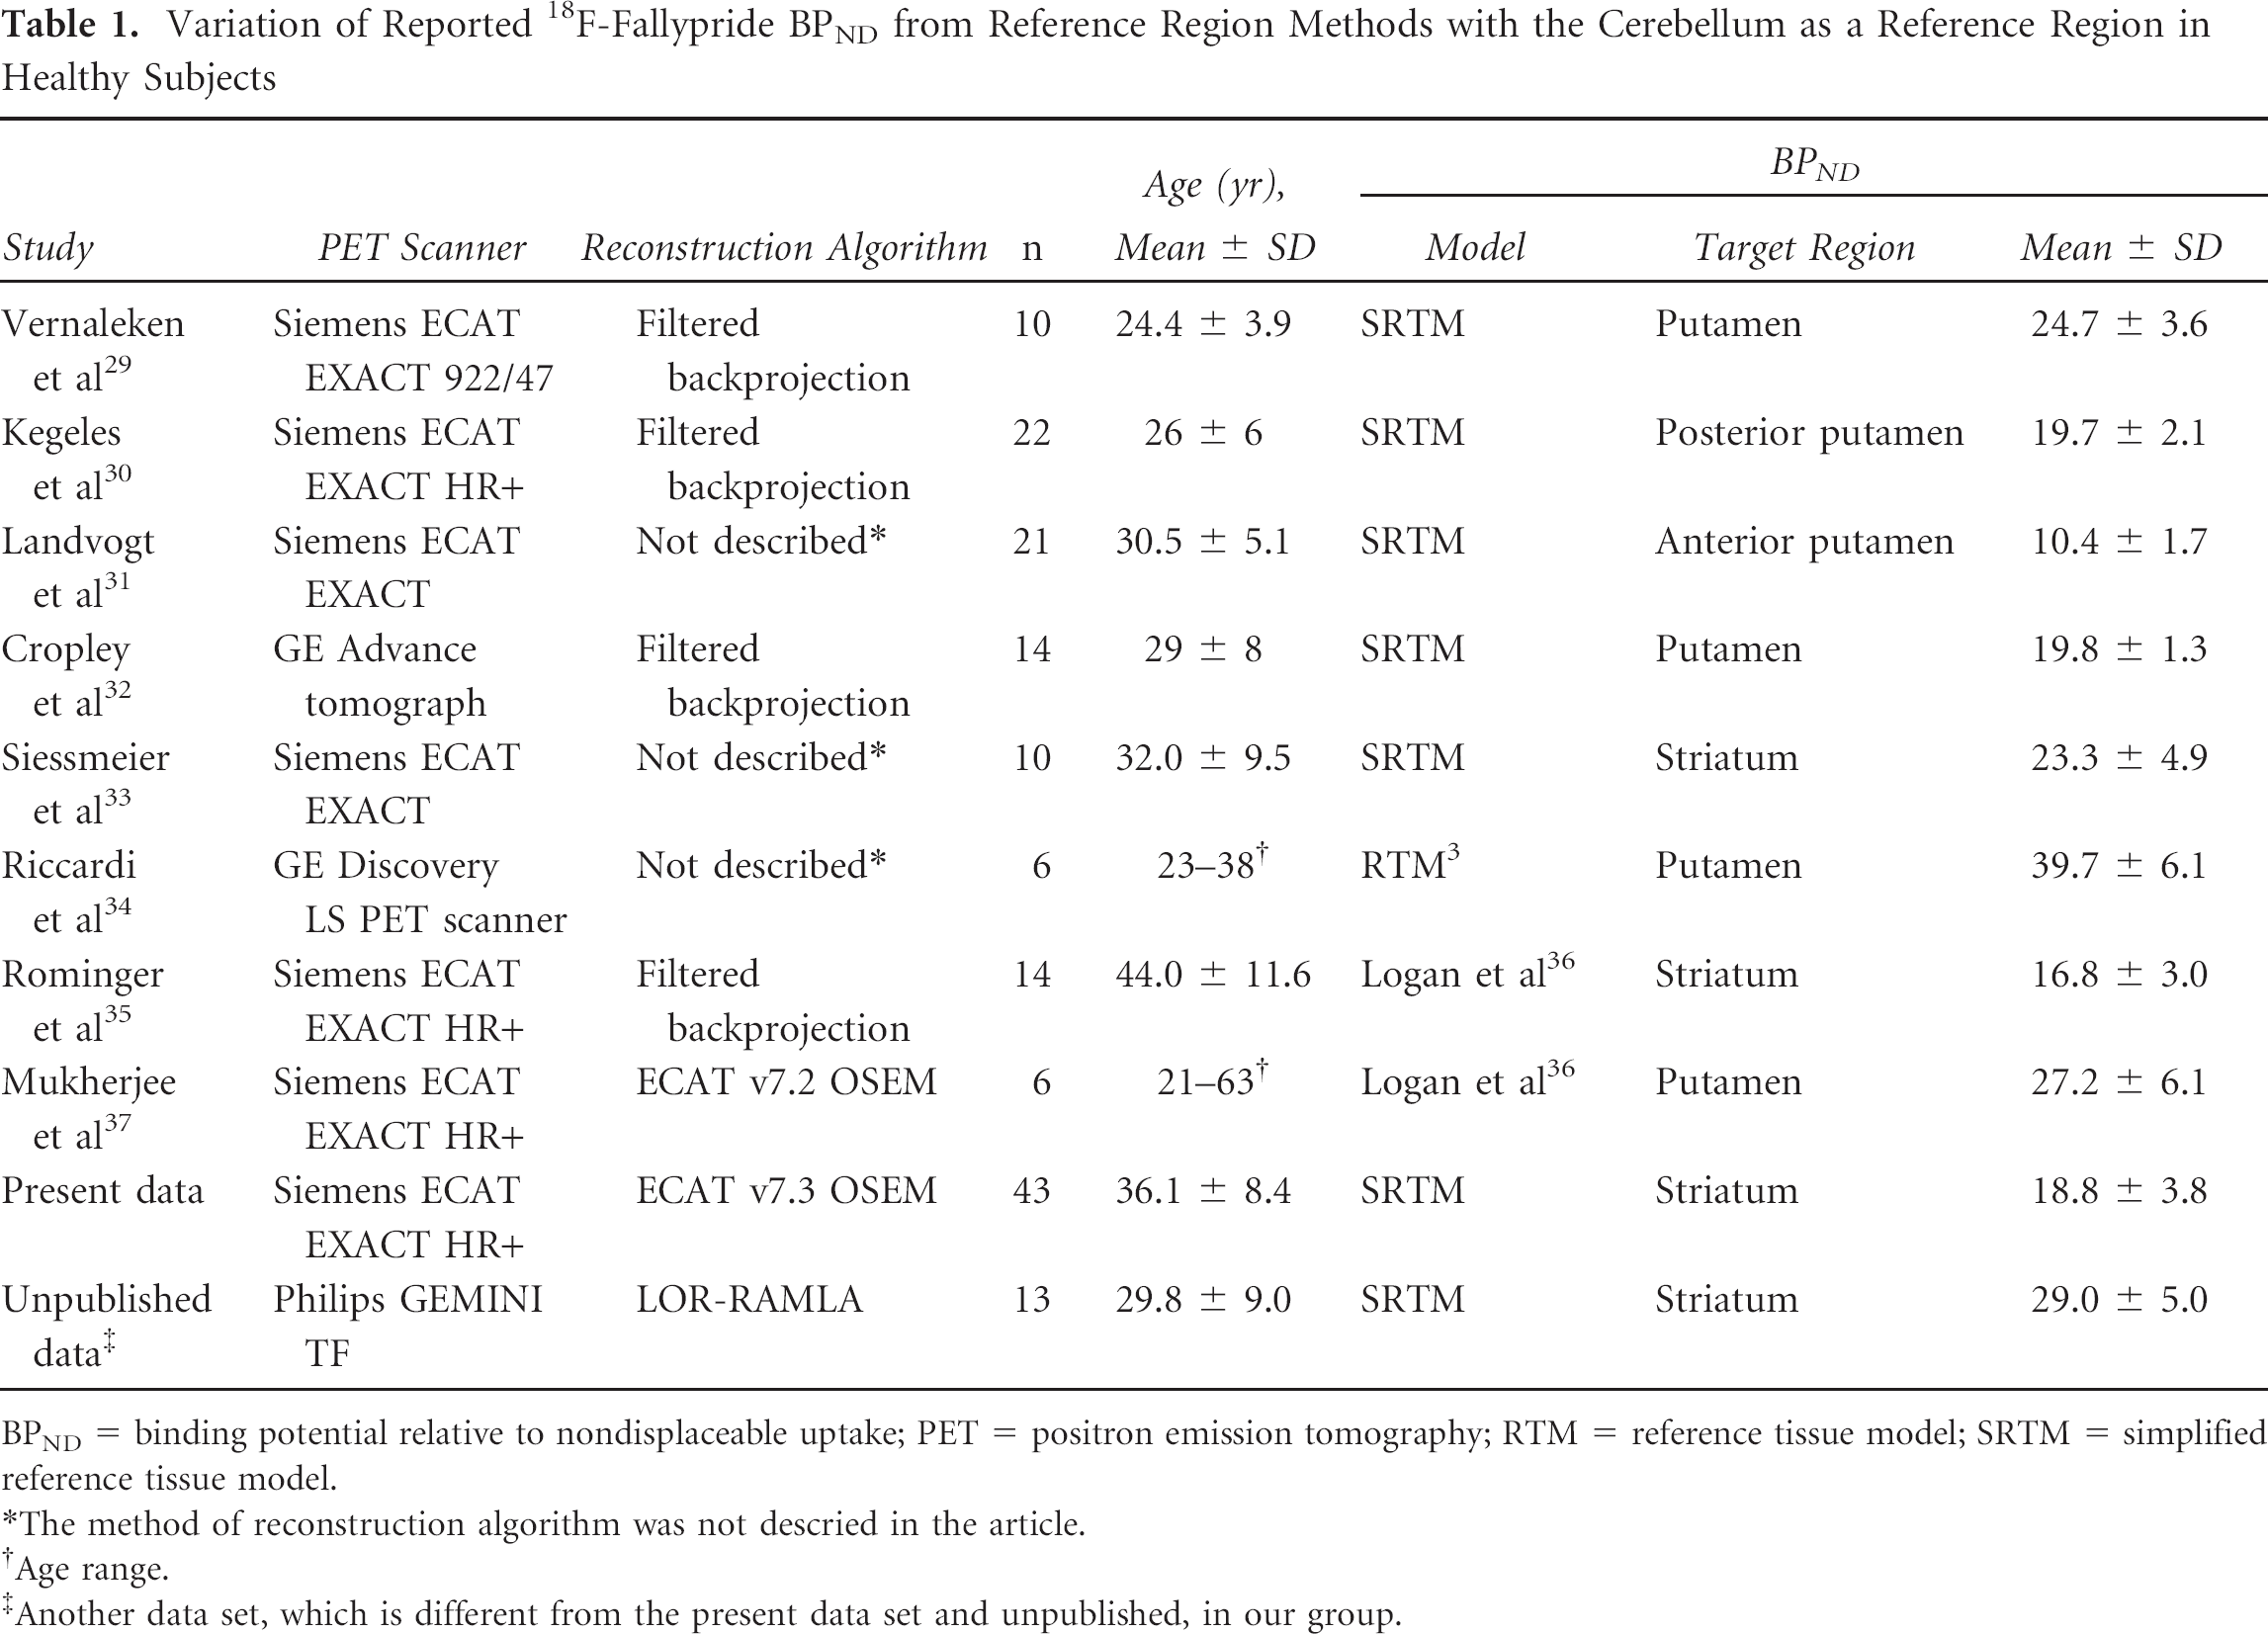
BPND = binding potential relative to nondisplaceable uptake; PET = positron emission tomography; RTM = reference tissue model; SRTM = simplified reference tissue model.
The method of reconstruction algorithm was not descried in the article.
Age range.
Another data set, which is different from the present data set and unpublished, in our group.
The RTM and SRTM substitute an input function derived from measured activity in a reference tissue for an arterial plasma input function, obviating the need for arterial cannulation and metabolite assay. The reference tissue measurement also is preferred to the arterial measurement because it is continuous, creating reference and target TACs with equal numbers of data points. Furthermore, assuming that all radioactivity in the brain represents the parent compound,6,7 the reference tissue measurement obviates the need for assay of radiolabeled peripheral metabolites and tracer bound to plasma protein, which contribute to uncertainty and bias in the arterial input function measurement. The requirements of RTM and SRTM are as follows:
The distribution volumes of nondisplaceable radioligand (VND) for the target and reference regions must be equal. Specifically, the condition VND = K1/k2 = K1′/k2′ must be satisfied, where the unprimed coefficients are the target tissue rate parameters and the primed coefficients are those for the reference tissue. Notably, studies with 18F-fallypride and 11C-FLB 457 have shown violation of this requirement when the reference region is the cerebellum. 8
The kinetics in the target region are such that the specifically bound and the free/nonspecific compartments are nearly indistinguishable. Accordingly, the target tissue compartments must be “well mixed” and act as a single-tissue compartment; violations of this assumption with 11C-WAY-100635 produce biased BPND estimates from the SRTM.9,10
The concentration of bound ligand in the reference tissue must be small compared to that of nondisplaceable ligand. This requirement is particularly important for high-affinity tracers because the ratio of bound to free ligand is ≈ k3/k4 = B′max/KD. Thus, when KD (dissociation equilibrium constant) is small (ie, high-affinity ligands), a relatively small B′max (estimated in vivo receptor concentration) (as in low–receptor density areas) can lead to substantial contamination of the reference tissue activity by specifically bound ligand. Studies using 11C-FLB 457 have shown that specific binding contributes to activity in the cerebellum and can lead to gross underestimation (by more than a factor 2) of striatal BPND.11,12
Several of the aforementioned requirements are of particular concern for the high-affinity dopamine D2/D3 receptor (D2/3R) radioligands 18F-fallypride and 11C-FLB 457. Both tracers have relatively slow kinetics, requiring prolonged scanning time (2 to 3 hours' scan duration).13,14 Due to rapid cerebellar clearance, the measured reference tissue activity is small during much of the scan. The striatal activity reaches ≈ 1 μCi/mL (decay-corrected to injection time) and remains relatively constant. The cerebellar activity (decay-corrected to injection time) falls to 0.01 to 0.02 (1–2%) of striatal activity by the end of the scan, to an absolute activity of < 10 nCi/cc, which is comparable in magnitude to activity due to scatter from the high-activity striatum.
The accuracy of BPND estimations using the RTM and SRTM crucially depends on how well the reference tissue TAC is measured. The reference tissue TAC is substantially smaller than the target tissue TAC during most of the scanning period, thereby having potentially large effects on the accuracy of the BPND estimation. Furthermore, because reference tissue activity is small, it is more vulnerable to bias produced by inaccuracies in random, scatter, or attenuation correction. Even accurate random and scatter correction degrades the statistical precision of a low-activity measurement, that is, if the corrected activity for a region is given by AC = AM − AR − AS, where AC is corrected activity, AM is measured activity, AR is activity due to random coincidences, and AS is activity due to scatter. The corresponding variance is given by VC = VM + VR + VS. Thus, precision of the reference tissue TAC may be compromised when the total measured activity is small and consists substantially of activity from scatters and randoms. Finally, another source of measurement degradation in the reference tissue TAC is reconstruction inaccuracy. Reconstruction errors occur relatively frequently in low-activity regions.15–17 When filtered backprojection reconstruction is used, streak artifacts are particularly prominent in low-activity regions, and when iterative reconstruction is used, inaccuracy is greatest in low-activity regions because of the positivity constraint.16,17
Although some of these problems for reference tissue methods, such as violations of the SRTM requirements, are specific for the tracer, others, such as contamination of the reference tissue activity by scatter and reconstruction artifacts, can vary among different possible reference tissues. Tissues further from high-activity regions, or from the radioactive blood pool, have less scatter contamination than closer regions. Reconstruction artifact varies across the field of view (FOV) of the scanner because scatter and attenuation are better modeled in some parts of the brain than others. 15 The most substantial bias in reconstruction is found in lower brain regions, including the brainstem and cerebellum. 15 Brain regions other than the cerebellum also have comparably small D2/3R densities12,18 and may serve as alternative choices of a reference region with fewer of the aforementioned problems in measurement error. Therefore, we sought to determine whether, on the basis of the statistical properties of the results, we could identify one or more reference tissues as superior to others. If these reference regions have comparable tracer kinetic properties but one offers advantages in susceptibility to bias by random, scatter, or attenuation correction, then it is reasonable to consider its use as a reference tissue for PET studies with high-affinity D2/3R ligands. We tested the influence of the choice of reference region on striatal BPND using 18F-fallypride, comparing the visual cortex and a white matter region (superior longitudinal fasciculus) to the cerebellum as reference regions for striatal BPND measurements with 18F-fallypride, a high-affinity D2/3R ligand (KD ≈ 0.20 nM in vivo). 10
Materials and Methods
Research Participants
Data used in this investigation were collected in a study of the effects of methamphetamine dependence on D2/3R binding potential. Thirty-six methamphetamine-dependent (mean age = 34.2 years, SD = 9.5 years) and 43 age- and sex-matched control research participants (mean age = 36.1 years, SD = 8.4 years) provided written informed consent and underwent PET scanning as approved by the UCLA Institutional Review Board. Some were rescanned ≈ 30 days later. Data from controls who were retested (
PET Scanning
PET scanning was performed on an ECAT EXACT HR+ scanner (Siemens, Washington, DC) (measured according to National Electrical Manufacturers Association [NEMA] protocol: in-plane resolution full width at half maximum [FWHM] = 4.6 mm, axial FWHM = 3.5 mm, axial FOV = 15.52 cm) in three-dimensional [3D] mode.
20
A 7-minute transmission scan was performed using a rotating 68Ge/68Ga rod source. Dynamic data acquisition was initiated with a bolus injection of 18F-fallypride19,21,22 (≈ 185 MBq ± 5%, specific activity ≥ 37 GBq/μmol) and continued for 80 minutes. After a short break, another transmission scan was performed, and emission data collection continued for another 80 minutes. Data were reconstructed using
Magnetic Resonance Imaging and Definition of Volumes of Interest
Magnetic resonance images (MRIs) were acquired at 1.5 T (Sonata, Siemens) (sagittal T1-weighted 3D volumetric, magnetization-prepared rapid acquisition with gradient echo sequence [repetition time/echo time = 25/11 ms, number of excitations = 1, slice thickness = 1.2 mm contiguous, in-plane resolution = 1 × 1 mm2, runtime = 10 minutes]) and processed using the FMRIB Software Library (FSL; Oxford University). The striatum, cerebellum, visual cortex, and white matter were defined as volumes of interest (VOI) (Figure 1). A whole-striatum VOI was created by combining bilateral caudate, putamen, and nucleus accumbens VOI, anatomically defined in native space using FSL
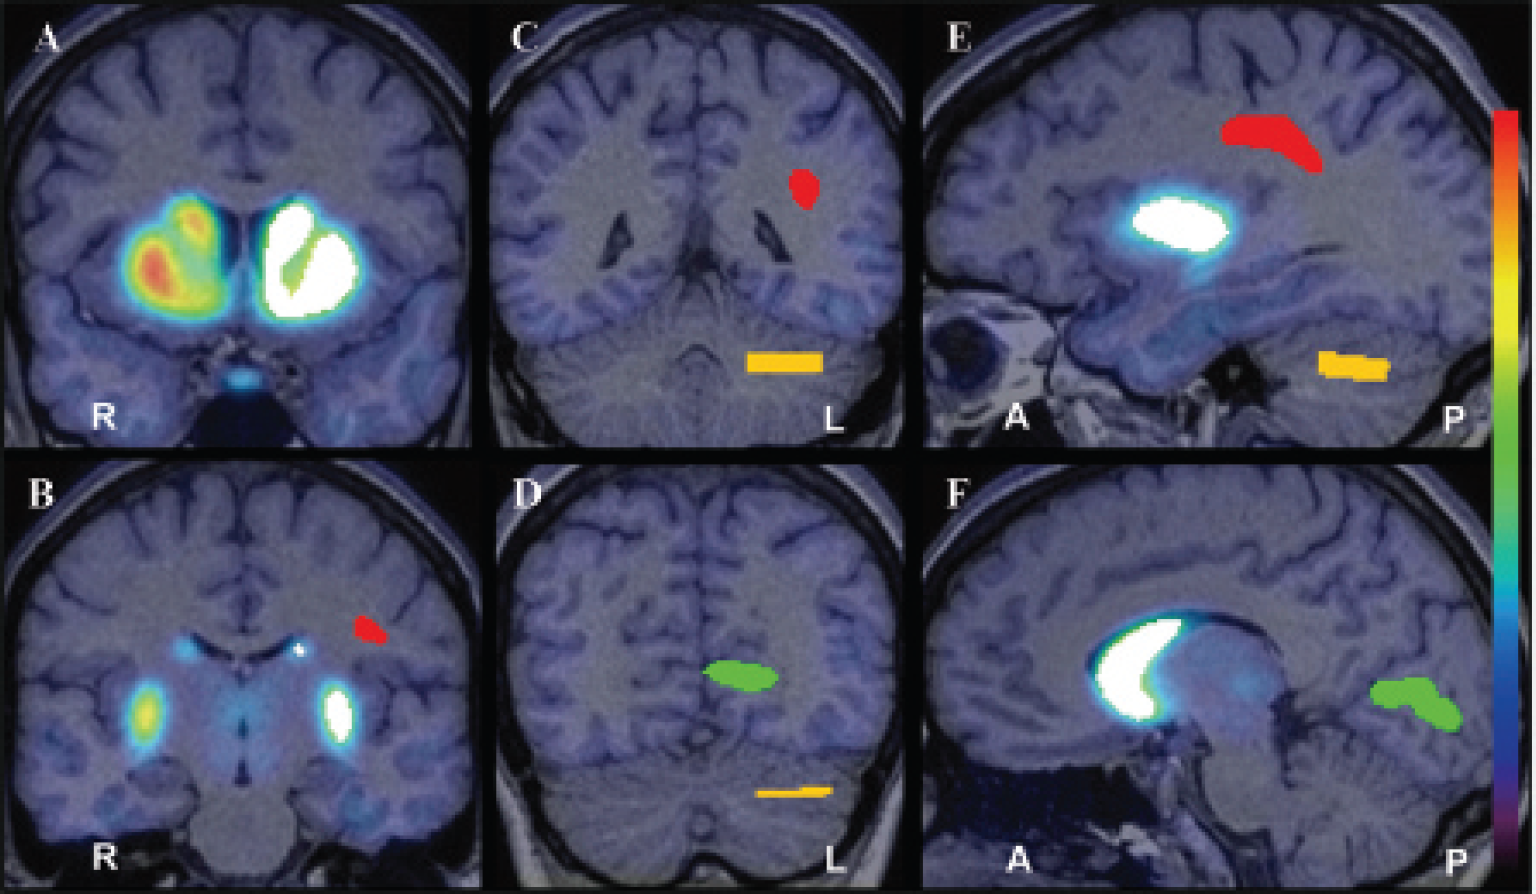
An example of volumes of interest (VOI) placed on the whole striatum (
PET Image Processing
Reconstructed PET data (160 minutes) were combined into 16 images, each representing an average of 10 minutes of dynamic data. After motion correction using FSL
Data Analysis and Statistical Analysis
Correlation of BPND values calculated using the cerebellum with those using the other reference regions was tested by linear regression analysis with the Pearson correlation test. The coefficient of variation (CV = standard deviation/mean) was used as an index to assess BPND variability, and the Levene test was used to assess the equality of variance between the three different samples. Differences between subject groups and between scan sessions were tested by independent and paired
Test–retest variability was calculated as the ratio of the absolute value of the difference in BPND between the test and retest values to the mean of the test and retest BPND values, and the difference in variability among the three reference regions was tested by one-way repeated-measures analysis of variance (ANOVA). The results were deemed statistically significant at
Results
The TACs obtained from each of the three reference regions exhibited similar curve shapes, especially near the end of the scan session (Figure 2). Notably, the peak activity for the white matter region was lower than those of the other regions. Regardless of the reference region used, BPND values obtained in this study were within the range of published striatal BPND values using 18F-fallypride (see Table 1). In healthy controls, BPND values determined with white matter as the reference region were 6.2% higher than BPND values determined with the cerebellum; BPND values determined with visual cortex were 19.9% lower than with cerebellum. In methamphetamine-dependent individuals, BPND values determined with white matter as the reference region were 7.7% higher than BPND values calculated with the cerebellum; BPND values determined with the visual cortex were 18.1% lower than BPND values determined with the cerebellum (Table 2). BPND values calculated using the cerebellum as the reference region were highly correlated with values obtained using white matter (
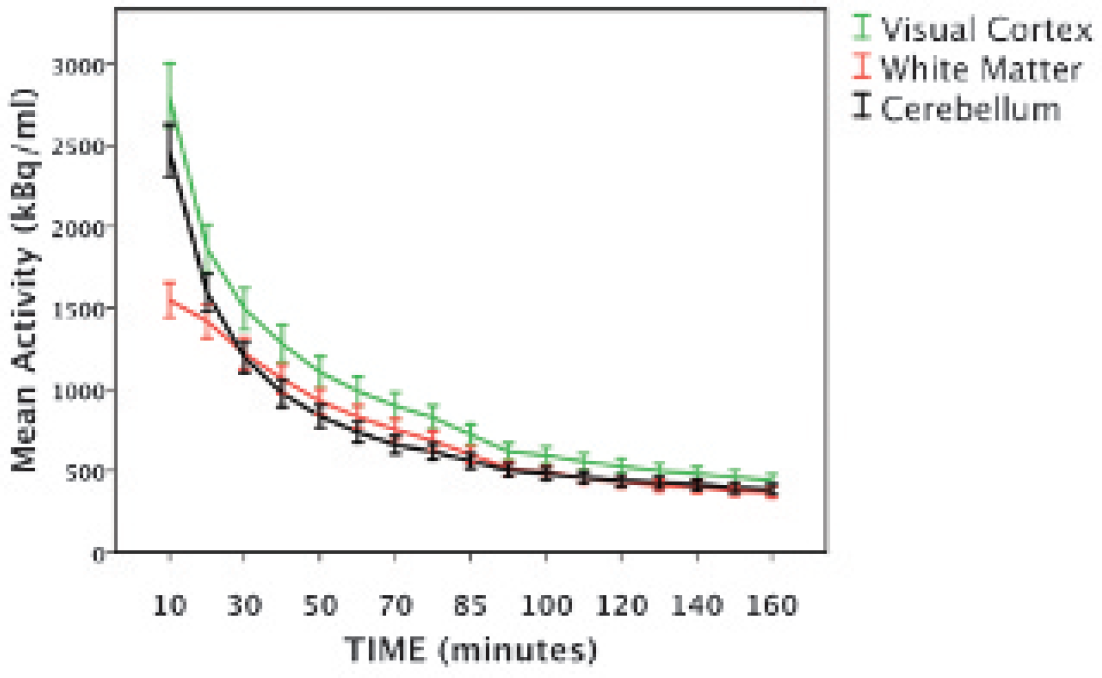
The averaged regional time-radioactivity curves for 18F-fallypride in human brain in each of three reference regions: visual cortex (intracalcarine cortex), white matter (superior longitudinal fasiculus), and cerebellum. Error bars: ± 1 SEM.

Correlations of striatal BPND calculated using the cerebellum with BPND calculated using white matter (
BPND Values Calculated Using Each of Three Reference Regions in Healthy and Methamphetamine-Dependent Participants

BPND = binding potential relative to nondisplaceable uptake; CV = coefficient of variation = standard deviation/mean; HC = healthy participants; MA = methamphetamine-dependent participants.
Independent
Effect size = difference in mean/standard deviation.
CV values obtained for BPND using white matter were 17.9%, and 27.8% lower than those calculated with the cerebellum in healthy control and methamphetamine-dependent subjects, respectively (see Table 2). CV values for BPND using the visual cortex were 8.4%, and 19.5%lower than those calculated with the cerebellum in healthy control and methamphetamine-dependent subjects, respectively. The Levene test revealed an inequality of variance among the three samples (Levene statistic = 4.85;
To interpret the practical impact of the differences in observed effect size, we calculated the projected number of subjects needed per group (in an independent sample) to allow detection of this group difference in BPND with 80% power, using the observed effect sizes. The estimated number of subjects needed per group was 45 when using the cerebellum as the reference region, 50 when using the visual cortex, and 36 when using white matter.
In the test–retest subsample analysis, test–retest reproducibility among the three reference regions was similar as the BPND values were not significantly different between sessions, irrespective of reference region (paired
Test–Retest Reproducibility in 16 Healthy Participants (

BPND = binding potential relative to nondisplaceable uptake; CV = coefficient of variation = standard deviation (SD)/mean; VAR = variability.
Paired
VAR (%); test–retest variability (%) = 100 × |scan 2 − scan 1|/(scan 2 + scan 1)/2.
Discussion
The primary objective of this study was to investigate the influence of reference region choice on BPND using 18F-fallypride and the SRTM. We compared the visual cortex and the superior longitudinal fasciculus (a white matter region) to the cerebellum to determine if any region offered statistical or technical advantages over others. Using white matter as a reference region produced higher striatal BPND values compared to the other reference regions tested, consistent with reports of lower specific binding to D2/3Rs in white matter than in cerebellum or visual cortex.12,18 In this respect, white matter adheres more to the STRM requirements of very low specific binding in the reference region than the other reference regions examined in this study. Notably, using white matter yielded the most robust group difference (largest effect size) in BPND between healthy and methamphetamine-dependent participants, consistent with previous reports of these differences.19,25
Whereas other groups have noted that data obtained using 11C-FLB 457 and reference regions composed mostly of gray matter exhibit TACs with markedly different shapes than those obtained using reference regions composed mostly of white matter, 12 18F-fallypride TACs had similar shapes for all three reference tissues tested (see Figure 2), which suggests that the tracer kinetics are similar for 18F-fallypride among the reference regions examined. Higher BPND calculated using white matter might be explained by the lower volume of distribution (K1′/k2′) of white matter compared to the target tissue. Although we are not aware of studies reporting K1′/k2′ of white matter using 18F-fallypride, the calculated total volume of distribution for 11C-FLB 457 in the cerebellum is highly correlated with that calculated in white matter. 12 However, it should be noted that values of K1′/k2′ obtained for D2/3R radioligands are both region and tracer specific.8,26–28
The present findings suggest that using the visual cortex as a reference region with the SRTM produces BPND values for 18F-fallypride with higher sample variance than when the cerebellum is used. More sample variance in these data, compared to those obtained with white matter or cerebellum, may be attributed to the poorer quality of the reference region TAC measurement, possibly as a result of greater error in attenuation and scatter correction in the visual cortex when compared to the other reference regions. Attenuation and scatter correction are the most important correction processes of PET for quantitative analysis. These corrections, however, can be biased due to incorrect estimation of the attenuation coefficient. Because of poor counting statistics, bones near the lower parts of the skull are often misclassified as tissue on attenuation maps, and bias due to attenuation error in these regions is prominent. In particular, the largest negative bias from attenuation correction has occurred in the brainstem and cerebellum, whereas the largest positive bias occurred in the occipital cortex and superior portion of the cerebellum. 15
On the basis of the data presented here, the visual cortex appears to offer few statistical or technical advantages over the cerebellum as a reference region for assessment of BPND for 18F-fallypride. However, our data support the use of the superior longitudinal fasciculus, a white matter region, as a reference region in 18F-fallypride PET studies. White matter appears comparable in performance to the cerebellum as a reference region in studies using 18F-fallypride and may offer slight statistical and technical advantages in studies using high-affinity D2/3R radioligands. These findings have implications that could be extended to other high-affinity radiotracers with rapid cerebellar clearance and slow kinetics.
Although this work does not fully address the limitations of reference tissue models with high-affinity radioligands, investigating the effect of reference region choice on BPND is an initial step toward identifying potential problems associated with modeling the kinetics of newly developed high-affinity ligands. Further investigations, including D2/3R-specific blocking studies, are advisable to assess the degree to which reference region methods and other kinetic modeling techniques can be used accurately with high-affinity D2/3R ligands to estimate binding potential. As new radiotracers are developed for use with PET, it is necessary to reevaluate the methods used to describe their binding kinetics accurately in vivo and to identify potential sources of error.
Footnotes
Acknowledgments
We are grateful to Drs. Gerhard Hellemann and J. David Jentsch for helpful comments.
Financial disclosure of authors: This research was supported by US National Institutes of Health (NIH) grants P20 DA022539, R01 DA015179, R01 DA020726 (to E.D.L.); M01 RR00865 (University of California-Los Angeles General Clinical Research Center); and endowments from the Marjorie Green Trust and the Thomas P. and Katherine K. Pike Chair in Addiction Studies (to E.D.L.). C.L.R. was supported by NIH grant T32 DA024635.
Financial disclosure of reviewers: None reported.