
Abstract
Bioluminescence imaging is widely used for cell-based assays and animal imaging studies in biomedical research and drug development, capitalizing on the high signal to background of this technique. A relatively small number of luciferases are available for imaging studies, substantially limiting the ability to image multiple molecular and cellular events, as done commonly with fluorescence imaging. To advance dual reporter bioluminescence molecular imaging, we tested a recently developed, adenosine triphosphate–independent luciferase enzyme from Oplophorus gracilirostris (NanoLuc [NL]) as a reporter for animal imaging. We demonstrated that NL could be imaged in superficial and deep tissues in living mice, although the detection of NL in deep tissues was limited by emission of predominantly blue light by this enzyme. Changes in bioluminescence from NL over time could be used to quantify tumor growth, and secreted NL was detectable in small volumes of serum. We combined NL and firefly luciferase reporters to quantify two key steps in transforming growth factor β signaling in intact cells and living mice, establishing a novel dual luciferase imaging strategy for quantifying signal transduction and drug targeting. Our results establish NL as a new reporter for bioluminescence imaging studies in intact cells and living mice that will expand imaging of signal transduction in normal physiology, disease, and drug development.
BIOLUMINESCENCE IMAGING with luciferase enzymes has revolutionized molecular and cellular imaging studies in small animals. Using bioluminescence imaging, researchers can analyze molecular level events, such as protein interactions and kinase activities, detect the distribution and trafficking of cells, and monitor disease progression and response to therapy in living mice.1–5 Luciferase enzymes provide sensitive detection of molecular and cellular processes in vivo, due in part to the broad dynamic range of these enzymes and minimal background bioluminescence. Ease of use of bioluminescence imaging instrumentation also encourages investigators to integrate this imaging method into preclinical research studies.
Most bioluminescence imaging studies in cell-based assays and particularly living animals use firefly luciferase (FL) as a reporter protein. Although imaging with FL has provided tremendous insights into in vivo biology, use of a single luciferase means that only one molecular event or cell population can be analyzed. Firefly and other beetle luciferases also are relatively large enzymes (≈ 60 kDa) that require adenosine triphosphate (ATP) as a cofactor, creating potential steric problems when fused to other proteins and restricting applications to intracellular events. To overcome the limitations of beetle luciferases and expand the range of intracellular and extracellular events that can be imaged, there is an ongoing need for smaller, ATP-independent luciferases for use in fusion proteins and analyses of extracellular molecules. Ideally, new luciferase reporter enzymes would have substrates and emission spectra distinct from beetle luciferases to enable monitoring of two distinct events, similar to fluorescence techniques.
Gaussia luciferase (GL) is used as an alternative or complement to beetle luciferases for cell-based and animal imaging studies. GL has a molecular weight (≈ 20 kDa) smaller than fluorescent proteins, so fusing this enzyme to a protein of interest is less likely to perturb functions of a target protein compared to beetle luciferases. As an ATP-independent, secreted enzyme, GL provides a marker for extracellular signaling, protein secretion, and tumor growth.6–8 GL also uses a different substrate, coelenterazine, than the pair of FL and luciferin, enabling imaging of two different molecular or cellular events. However, GL has notable disadvantages that limit its use for animal imaging studies. Coelenterazine oxidizes in serum, producing high levels of background luminescence that decrease the detection of imaging signals in cultured cells and living animals. GL also exhibits flash kinetics, such that the signal drops by approximately 70% within 1 minute. 6 Mutants of GL with more sustained, glow-like kinetics have been described recently, although these mutants require special assay conditions incompatible with intact cells or exhibit dramatic (100×) losses in bioluminescence.9,10 Coelenterazine must be injected systemically via intravenous or intracardiac injection for animal imaging, which substantially restricts animal throughput. Finally, GL emits blue light with peak emission at 480 nm, which limits penetration through tissues for in vivo imaging.
As an alternative to GL as a small, secreted, ATP-independent luciferase, we investigated a recently reported luciferase from the deep sea shrimp Oplophorus gracilirostris engineered for enhanced protein stability (NanoLuc [NL]) and its optimally designed substrate, furimazine. 11 NL is a 19 kDa, ATP-independent enzyme with some in vitro properties, suggesting that it will be advantageous for molecular imaging studies compared to GL. In particular, NL has sustained glow-type luminescence, providing a broader time window for imaging. Furimazine, a derivative of coelenterazine optimized for NL, has greater stability and reduced background activity to enhance signal detection. In addition, by appending a secretion signal to NL, the enzyme is secreted efficiently into the extracellular space.
In the current study, we show that bioluminescence imaging for NL can be accomplished in superficial tumors and internal organs of living mice with sensitivity at least comparable to that of GL. NL signal increases in proportion to tumor growth, providing an imaging metric for tumor burden. NL also can be detected readily in small samples of serum from living mice. Finally, we establish that NL can be combined with FL to image two distinct signaling events in a tumor, expanding the capabilities for molecular imaging in small animal models of disease.
Materials and Methods
Plasmids
We amplified secreted NL from plasmid pNL.1.3 (Promega, Madison, WI) using the forward polymerase chain reaction (PCR) primers 5′-atta
Cells
We previously described MDA-MB-231 human breast cancer cells stably expressing FL (231-FL) or GL (231-GL).7,13 We prepared lentiviral vectors for secreted NL in FUnucGFPW by transient transfection of 293T cells to generate populations of 231-FL cells expressing secreted NL (231-NL/FL).14,15 To generate cells expressing pathway reporters for TGF-β signaling, we transfected A549 cells stably expressing the BTR reporter (A549-BTR) with the SBE-NL plasmid using Lipofectamine 2000 (Invitrogenm Carlsbad, CA) and selected a population of stable cells (A549-BTR/SBE) with 300 μ/mL hygromycin-B (Invitrogen). 12 We cultured cells in Dulbecco's Modified Eagle's Medium or RPMI (A549 cells) with 10% fetal bovine serum in a humidified 5% CO2 incubator at 37°C A549-BTR/SBE cells were maintained in medium with 250 μg/mL G418 and 150 μg/mL hygromycin B.
Cell-Based Assays
We transiently transfected 293T cells with plasmids for secreted NL or GL by calcium phosphate precipitation. Transfections included constitutively expressed FL as a control. We also transfected cells with FL alone to control for background bioluminescence from substrates for NL (furimazine) or GL (coelenterazine). One day following transfection, we plated 1.5 × 10⁴ cells per well in 100 μL standard culture medium in black-walled 96-well plates. For 231 cells stably expressing NL or GL, we plated 1.5 × 10⁴ cells per well 1 day prior to the experiments. To quantify secreted NL or GL, we collected 5 μL of supernatant from each well, transferred supernatant samples to round-bottomed 96-well plates, and added 45 μL of phosphate-buffered saline (PBS) containing 1 μg/mL final concentration of furimazine or coelenterazine, respectively (Promega). We measured bioluminescence on an IVIS 100 (Perkin Elmer) immediately after adding substrate. We measured bioluminescence from cell-associated NL or GL by removing culture medium from wells and adding 40 μL PBS with 1 μg/mL final concentration of furimazine or coelenterazine, respectively, to intact cells. For selected experiments, we acquired imaging data for approximately 40 minutes. After obtaining NL and GL images on open filter, we added 10 μL of PBS with a 150 μg/mL final concentration of D-luciferin (Promega) to each well, incubated cells for 5 minutes at 37°C, and then measured bioluminescence from FL with a 595 nm filter to exclude light from NL or GL. For photon flux values from NL and GL, we subtracted bioluminescence from cells not transfected with either reporter. We graphed data as mean values ± SEM. To compare the relative loss of bioluminescence from NL or GL over time, we normalized all values to corresponding measurements obtained immediately after adding substrate.
For assays of TGF-β signaling, we initially transiently transfected A549 cells with a plasmid for SBE-NL in 12-well plates. Twenty-four hours after transfection, we treated cells for 22 hours with 10 ng/nL TGF-β (HumanZyme, Chicago, IL) in the absence or presence of 10 μM TGF-β inhibitors SB461542 or SD208 (Tocris, Minneapolis, MN). After establishing stable A549-BTR/SBE-NL cells, we seeded 5 × 10³ cells per well in black-walled 96-well plates. We treated cells in phenol red–free, serum-free media with various concentrations of TGF-β or TGF-βR1 inhibitor SD208 (Tocris) as listed in the figure legends and quantified bioluminescence as described above.
Single-Cell Bioluminescence Microscopy
We imaged NL bioluminescence in A549-BTR/SBE cells treated as described for 96-well plate assays using 10 μg/mL furimazine and 1-minute acquisition on a LV200 bioluminescence microscope (Olympus, Tokyo, Japan).
Western Blot
We performed Western blot analyses as described previously. 12 For NL or GL Western blots, we used 1:10,000 dilutions of polyclonal antirabbit antibodies to NL (Promega) or GL (New England Biolabs, Ipswich, MA), followed by a 1:10,000 dilution of goat antirabbit secondary antibody conjugated to horseradish peroxidase (Jackson ImmunoResearch, West Grove, PA). We quantified relative intensities of bands by ImageJ (Bethesda, MD) and normalized NL and GL to glyceraldehyde 3-phosphate dehydrogenase (GAPDH). 16
Animal Studies
All animal studies were approved by the University of Michigan Committee on Use and Care of Animals. We implanted 5 × 10⁵ 231-FL/NL, 231-GL cells, or A549-BTR/SBE-NL cells into the fourth inguinal mammary fat pads of 6- to 8-week-old female NSG mice (Taconic, Hudson, NY). To introduce cells into lung as a representative deeper tissue, we injected 1 × 10⁶ 231-FL/NL or 231-GL cells in 100 μL 0.9% NaCl intravenously via the tail vein.
To study TGF-β signaling in vivo, we separated mice with 8 to 10 mm tumors into three treatment groups (n = 5 mice per group): (1) 100 ng TGF-β intraperitoneally 17 ; (2) SD-208 (50 mg/kg) by gavage, a dose shown to substantially inhibit TGF-β signaling in mice18–20; and (3) SD208 followed 3 hours later by TGF-β. Groups also received appropriate vehicle controls (PBS or 1% methylcellulose in PBS for TGF-β or SD208, respectively). We imaged mice 6 and 24 hours after injection.
We imaged NL activity in implanted cells by injecting 5 μg (≈ 0.25 mg/kg) furimazine (≈ 40× dilution of Nano-Glo substrate) in 100 μL sterile PBS via the tail vein and imaged mice on an IVIS Spectrum (Perkin Elmer) within 30 seconds of injection. We imaged with open filter and acquisition times from 1 to 60 seconds. For selected experiments, we also obtained images with optical filters as shown in the figures. We imaged GL and FL as described previously.13,21
We measured the serum levels of secreted NL or GL in 20 μL blood samples obtained by retro-orbital puncture as described previously. 22 We quantified bioluminescence from secreted NL or GL as described above for cell supernatants, subtracting values from control mice without injected tumor cells.
Statistics
We analyzed data by unpaired t-test (GraphPad, GraphPad Software, La Jolla, CA) using p < .05 to define statistically significant differences. We used linear regression analysis to determine the goodness of fit for bioluminescence for GL and NL versus numbers of cells (R value).
Results
NL Produces More Sustained Bioluminescence than GL
To directly compare bioluminescence from secreted NL and GL, we transiently transfected 293T cells with equal amounts of plasmid for each enzyme and FL to control for differences in transfection efficiency. Both in five μL aliquots of cell supernatants and intact cells, secreted NL produced approximately two logs more bioluminescence than GL (p < .005) (Figure 1A). We observed comparable differences between secreted NL and GL in supernatants and cells, suggesting similar efficiency of secretion for both luciferases.
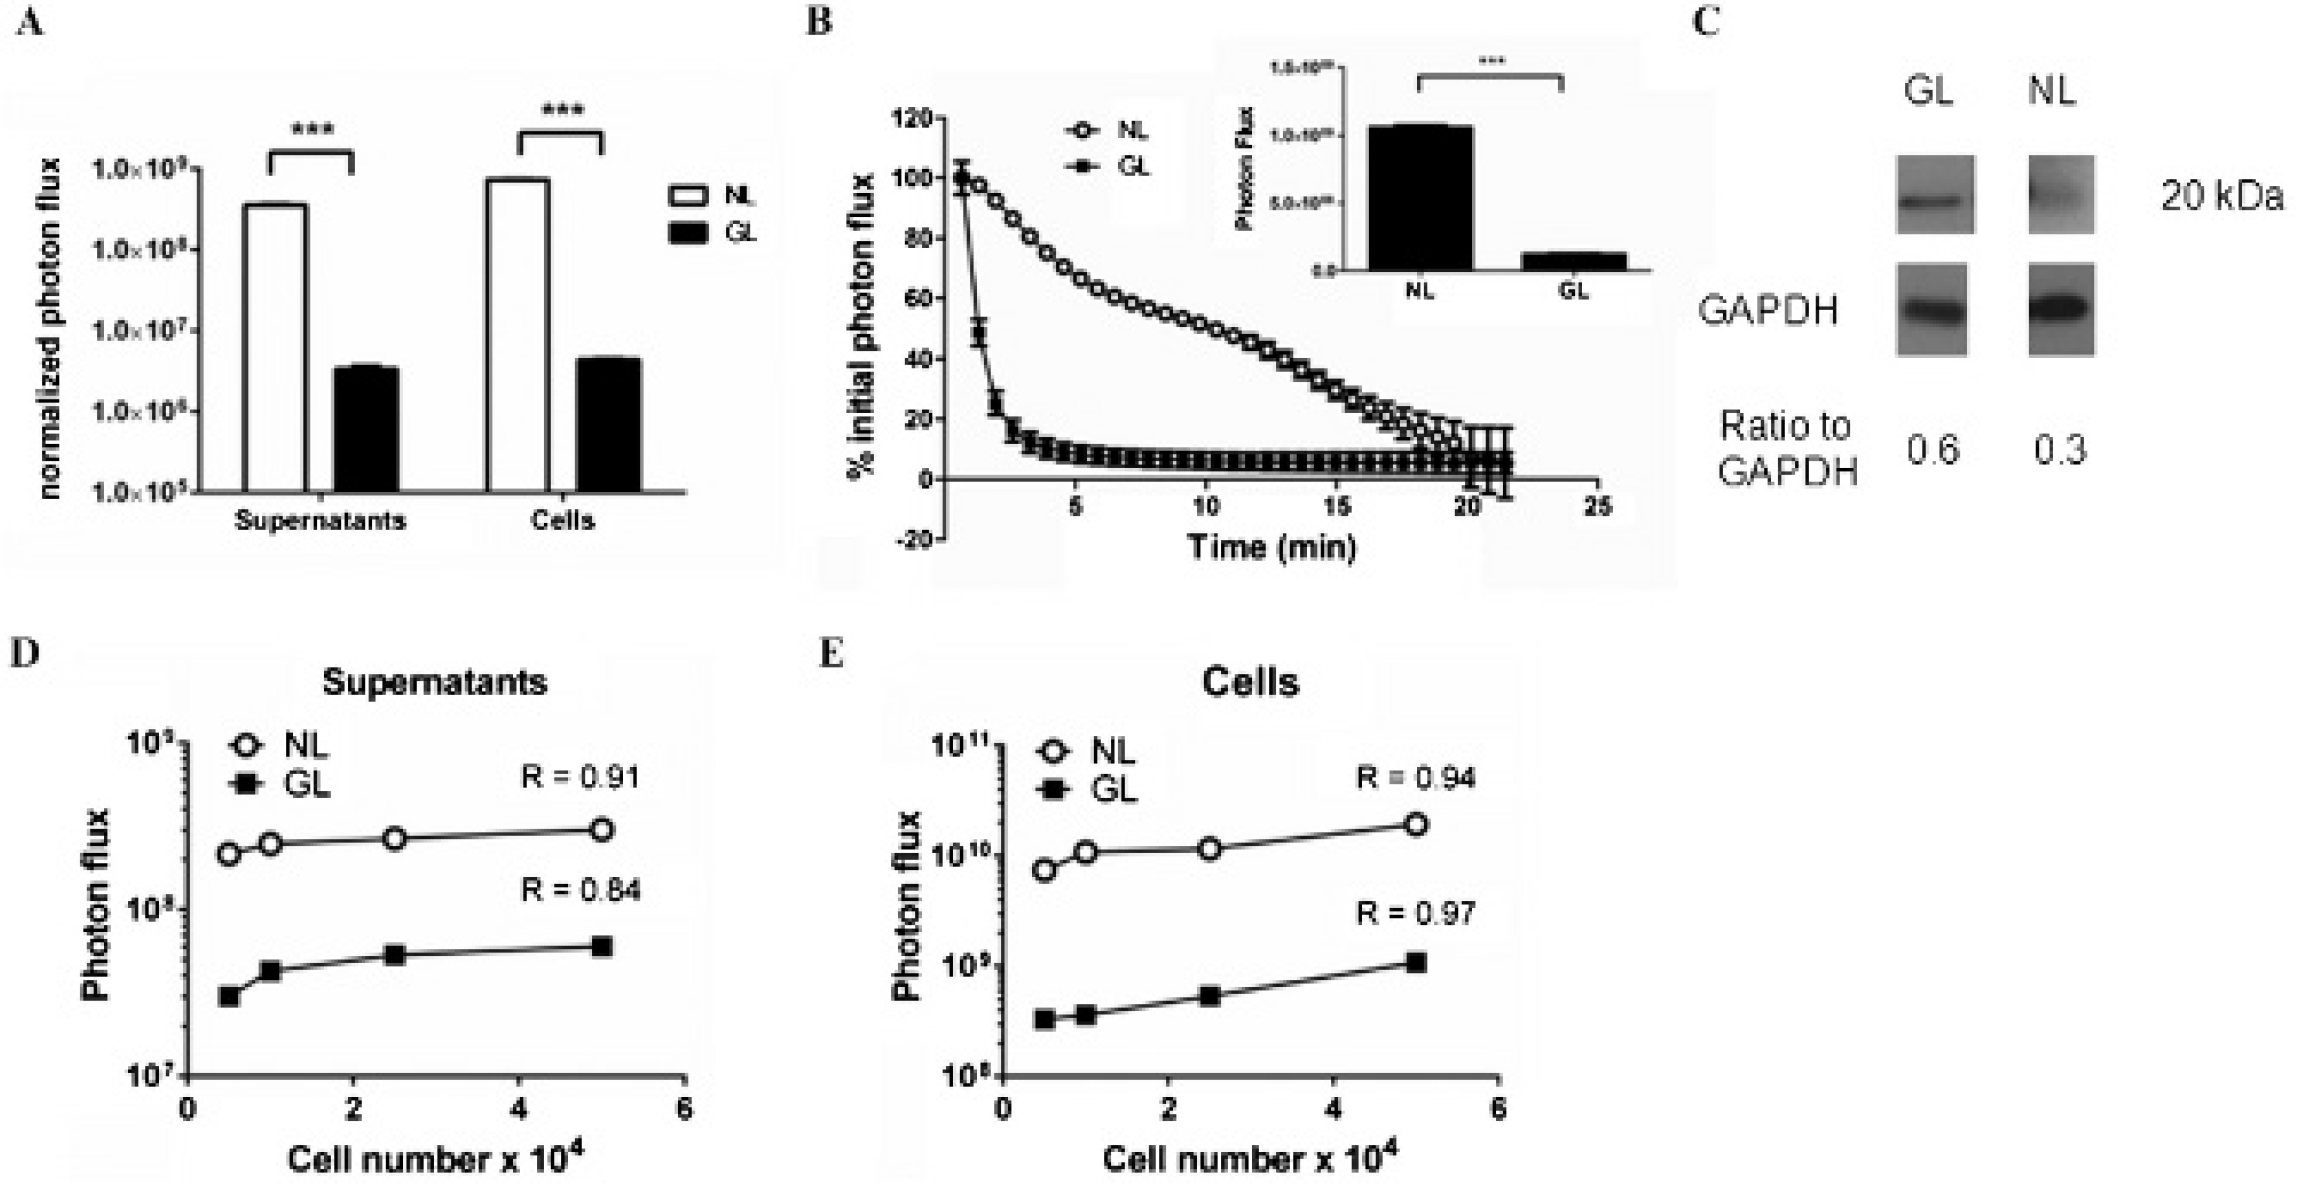
Enhanced signal from cell-associated and secreted NanoLuc (NL). A, We measured bioluminescence in supernatants and intact 293T cells transiently transfected with NL or Gaussia luciferase (GL). The graph displays mean values ± SEM for bioluminescence from each luciferase enzyme normalized to cotransfected firefly luciferase (FL) (n = 4 per condition). In some panels, error bars are smaller than corresponding symbols for each data point. B, Equal concentrations of furimazine or coelenterazine were added to MDA-MB-231 human breast cancer cells stably transduced with NL (231-NL) or GL (231-GL), respectively. The graph shows mean values ± SEM for bioluminescence relative to initial photon flux for each enzyme measured for over the initial 30 seconds of imaging after adding substrate (n = 4 per condition). The inset shows actual photon flux values for the initial 30 seconds of imaging for 231-NL and 231-GL cells. ***p < .005. C, Total cell lysates from 231-NL or 231-GL cells were probed with antibodies to NL or GL, respectively. Western blots were stripped and probed for GAPDH as a control for equal loading. Ratios of band intensities for NL or GL relative to GAPDH were quantified by ImageJ. D and E, The graphs display bioluminescence quantified in supernatants (D) and intact cells (E) from listed numbers of 231-NL and 231-GL cells. The graphs show mean values ± SEM for each enzyme (n = 4 per condition). R values denote goodness of fit for linear regression analysis of data.
To facilitate repeated cell-based assays and in vivo imaging, we generated populations of MDA-MB-231 breast cancer cells stably expressing secreted NL (231-NL) or GL (231-GL), respectively. We added equal concentrations of furimazine to 231-NL and coelenterazine to 231-GL cells, respectively, and measured the magnitude and kinetics of bioluminescence immediately after adding substrate. Similar to transient transfections, 231-NL cells produced significantly greater bioluminescence than 231-GL cells at the earliest imaging time point, even though NL protein was comparable to or less than GL in stable cells (Figure 1, B and C). Bioluminescence from 231-GL cells decreased by > 50% within 1 minute, and signal essentially reached background levels by 5 minutes. By comparison, 231-NL cells produced more sustained bioluminescence, with 50% of initial signal still remaining after 10 minutes. These results are consistent with previous reports of flash and more sustained, glow-like bioluminescence from GL and NL, respectively.6,11
We analyzed the relationship between reporter signal and cell number by plating decreasing numbers of cells and then quantifying bioluminescence in supernatants and intact cells. Although the magnitude of bioluminescence was greater for NL, both NL and GL showed progressively less bioluminescence in supernatants and cells with decreasing numbers of cells per well (Figure 1, D and E). Collectively, these data validate the notion that changes in NL signal in both intact cells and cell supernatants correspond linearly with differences in the numbers of cells.
Substrate Specificity for NL and GL with Furimazine and Coelenterazine
Furimazine is an analogue of coelenterazine optimized as a substrate for NL. 11 To investigate cross-reactivity of NL with coelenterazine and GL with furimazine, we incubated 231-NL and 231-GL cells with each substrate and quantified bioluminescence from luciferases secreted into supernatants and associated with intact cells. We also analyzed the effects of different substrates on the spectral emission of each enzyme.
231-NL cells incubated with furimazine and imaged with an open filter produced the highest bioluminescence signal from secreted NL and intact cells (Figure 2). Secreted NL and 231-NL cells also produced bioluminescence using coelenterazine as a substrate, although bioluminescence was ≈ 6.5-fold less than the reaction of NL with furimazine. Bioluminescence from 231-NL supernatants and cells incubated with coelenterazine also was greater than that produced by the combination of coelenterazine with secreted and cell-associated GL. Notably, GL produced one to two logs less bioluminescence using furimazine as a substrate relative to signal from coelenterazine.
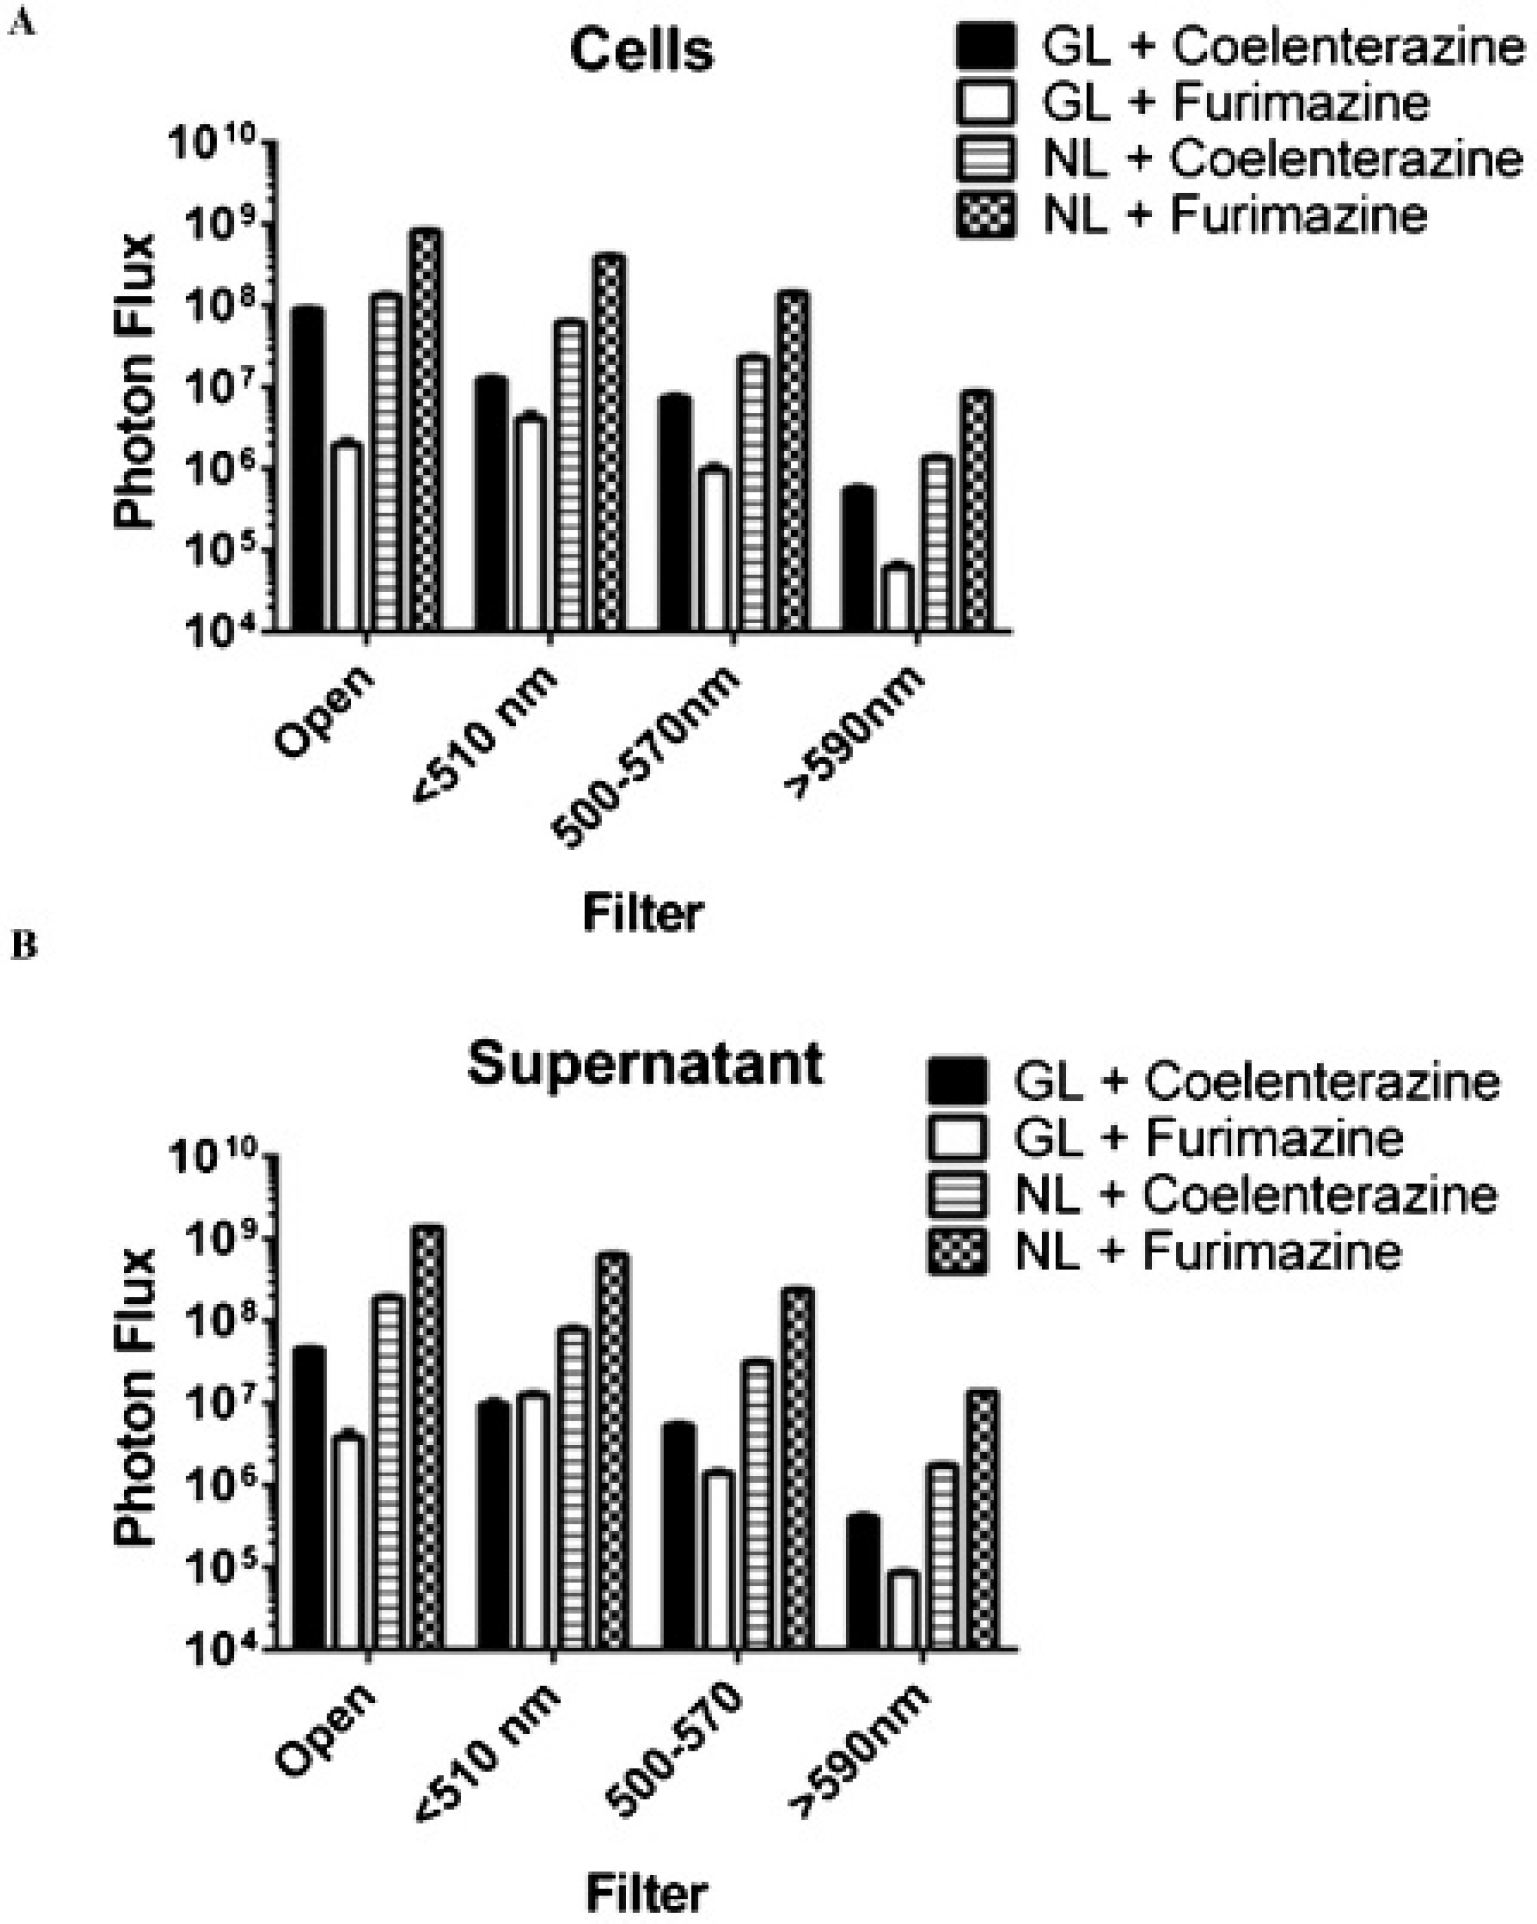
Comparative analysis of substrate specificity for NanoLuc (NL) and Gaussia luciferase (GL). A and B, We incubated 231-NL or 231-GL cells (A) or supernatants from these cells (B) with equal concentrations of furimazine or coelenterazine and measured bioluminescence with open filter or filters for < 510 nm, 500 to 570 nm, or > 590 nm light. The graphs show mean values (n = 4 per condition). Error bars for SEM are not apparent on this log scale.
Bioluminescence from NL decreased in rank order from open filter, < 510, 500 to 570, and > 590 nm using either furimazine or coelenterazine. We detected comparable signal from GL using both open filter and < 510 nm settings with progressive loss of signal at 500 to 570 and > 590 filters. These results verify the predominantly blue-green emissions of NL and GL and establish that changing substrates does not markedly affect the spectral output of NL.6,11 Collectively, imaging data demonstrate the selectivity of furimazine as a substrate for NL relative to GL and show the cross-reactivity of NL with coelenterazine.
Imaging NL in Orthotopic Breast Tumor Xenografts
Although NL previously has been used as a reporter for cell-based assays, the utility of this luciferase for in vivo imaging has not been tested. To establish the feasibility and performance characteristics of NL for small animal imaging, we implanted 231-NL cells orthotopically into the left fourth inguinal mammary fat pads of immunocompromised mice. We implanted 231-GL cells into the corresponding mammary fat pad on the right side of each mouse to enable direct comparisons between these luciferases. We initially imaged mice with 5 to 6 mm diameter tumors by injecting furimazine intravenously by tail vein injection and then acquiring images with open filter and emission cutoff filters from 500 to 620 nm. Using an open filter, we readily detected bioluminescence from 231-NL tumors following injection of 5 μg (≈ 0.25 mg/kg) of furimazine (Figure 3A). With these imaging conditions, open filter images greater than 5 seconds exceeded the detection limits of the imaging camera. Larger amounts of injected furimazine (up to 20 μg) produced even greater bioluminescence but exceeded the upper limits of the imaging system with 1-second exposure, suggesting that 5 μg of furimazine does not saturate NL enzyme activity in vivo. Photon flux measurements decreased progressively with longer wavelength emission filters, ranging from ≈ 20% of open filter values for a 500 nm filter to minimally detectable above background at wavelengths of 580 nm or higher (Figure 3B). Notably, we could not detect any bioluminescence above background levels for 231-GL tumors in mice injected with furimazine, further demonstrating the relative specificity of the NL-furimazine pair for animal imaging studies.
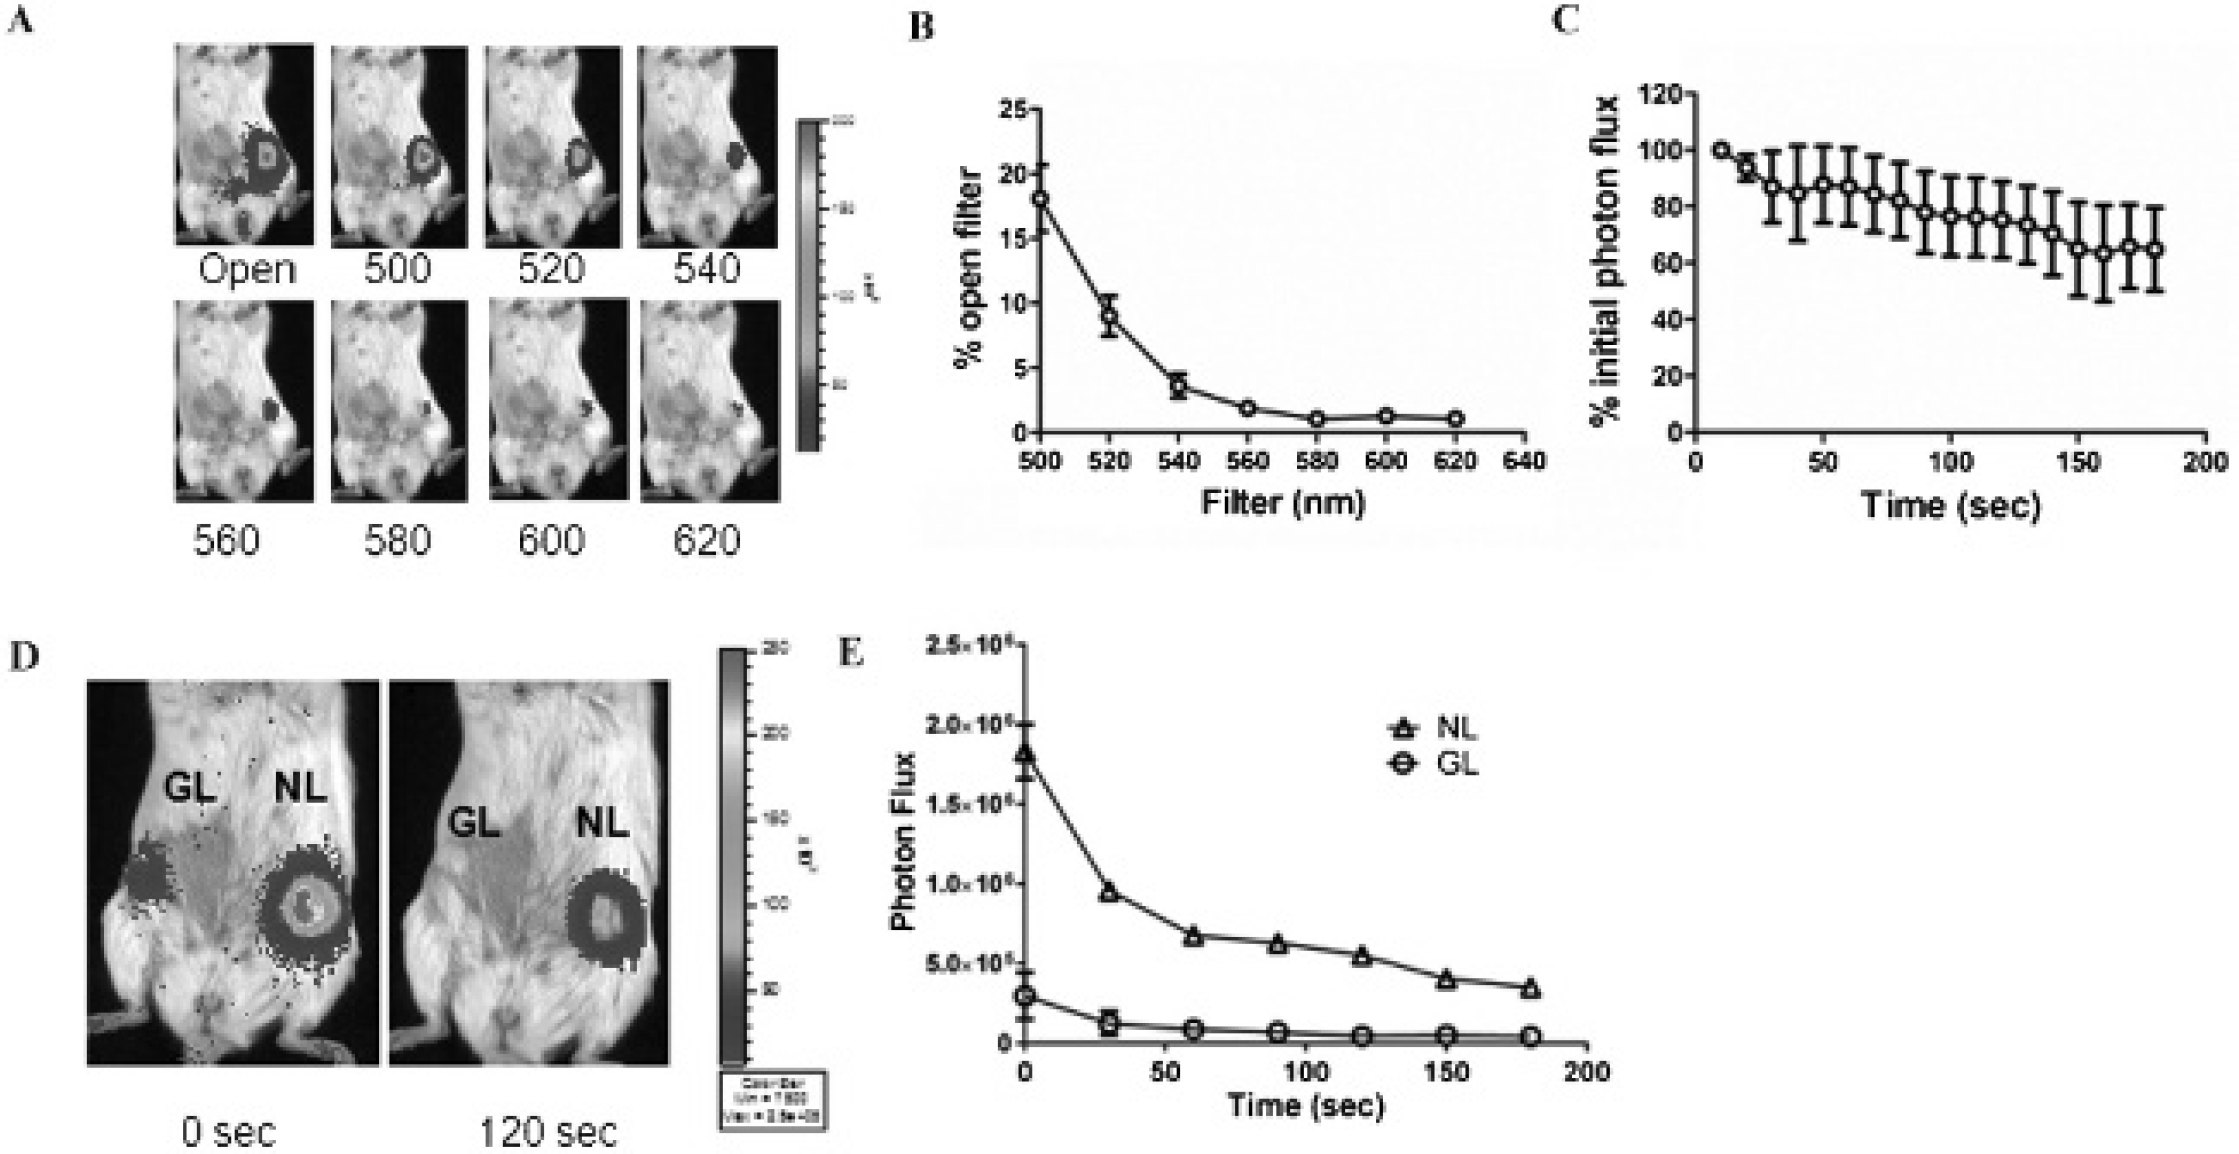
Imaging NanoLuc (NL) in mammary tumor xenografts. A, Representative bioluminescence images of a mouse implanted with 231-NL cells in the animal's left mammary fat pad after injection of furimazine. Images were obtained with open emission and selective bandpass filters listed below each image. B, The graph depicts mean values ± SEM for bioluminescence at each wavelength as a percentage of open filter photon flux (n = 5). C, Mice were imaged for NL bioluminescence with sequential 10-second images and open filter. Data were graphed as mean values ± SEM as a percentage of NL photon flux on the initial image (n = 4). D, Representative bioluminescence images of mice implanted with 231-GL and 231-NL cells as tumor xenografts and injected intravenously with coelenterazine. E, The graph depicts mean values ± SEM for bioluminescence from Gaussia luciferase (GL) and NL in response to coelenterazine (n = 5). The error bars for some data points are smaller than the corresponding symbols.
We also quantified the duration of bioluminescence from 231-NL tumors following intravenous injection of furimazine. Photon flux values peaked on the initial image and then declined gradually to ≈ 70% of starting levels after 3 minutes of imaging with open filter settings (Figure 3C). In addition to intravenous delivery of furimazine, we tested intraperitoneal injection of this substrate. However, intraperitoneal injection of this furimazine produced nonspecific bioluminescence throughout the peritoneum, precluding this route of delivery for imaging (Figure S1, online version only).
We further compared NL and GL as reporters for in vivo imaging by injecting mice with 200 μg (≈ 10 mg/kg) coelenterazine intravenously and acquiring images with 30-second exposure times. We selected 200 μg of coelenterazine based on previous research and our previous experience showing that this dose is needed to produce a readily detectable signal in superficial mouse tumors. 6 Bioluminescence from both luciferases decreased by ≈ 50 to 60% between the first and second 30-second images, with signal from GL being essentially at background by the second and all subsequent images (Figure 3, D and E). By comparison, bioluminescence from 231-NL tumors remained detectable through 3 minutes of imaging. Overall, these data establish NL as a bioluminescent reporter for in vivo imaging and show more sustained imaging signal from NL than GL in superficial tumors.
NL Bioluminescence Correlates with Tumor Progression
Having established that NL can be imaged in a superficial site, we then investigated the feasibility of using this luciferase to monitor tumor localization and progression in an internal organ. For these studies, we used 231-NL cells that coexpress firefly luciferase (231-NL/FL), thereby allowing direct comparisons of bioluminescence detected from both enzymes. We injected 231-NL/FL cells intravenously to establish lung metastases and then imaged mice at various times during tumor progression. Photon flux from NL and FL increased progressively from day 4 to day 17 with nearly equivalent slopes after injection of tumor cells (Figure 4, A and B). Unlike the very brief acquisition times needed for NL and furimazine in mammary tumors, we needed 60-second images to detect NL signal on day 4. We also note that photon flux from NL was two logs lower than that from FL, even though intrinsic bioluminescence from NL in vitro is ≈ 80 times greater than FL. 11 Substantially diminished detection of NL in mouse lung emphasizes the importance of wavelength of light for transmission through tissues. Predominantly blue light from NL (peak emission 460 nm) is absorbed to a much greater extent than the red-shifted light from FL (peak emission > 600 nm at 37°C). Despite relatively reduced sensitivity for detection, these data show that NL can be used to quantify tumor growth over time with responses that parallel the established in vivo reporter, FL.

Imaging NanoLuc (NL) bioluminescence in lung. A, Mice were injected intravenously with 231-NL/FL cells to produce experimental lung metastases. Bioluminescence images show the same mice imaged for NL or firefly luciferase (FL) signals. B, The graph displays mean values ± SEM for signal from NL (furimazine) or FL (luciferin) (n = 10 mice). C, Parallel cohorts of mice (n = 5 each) were injected intravenously with 231-GL or 231-NL/FL cells to produce lung metastases. The graph shows mean values ± SEM for photon flux over three time points after injection (n = 5). E, We collected serum samples from mice described in D and quantified bioluminescence from Gaussia luciferase (GL) or NL. The graph shows mean values ± SEM for bioluminescence from each secreted luciferase.
We also compared NL to GL for detecting lung metastases using a separate cohort of mice injected intravenously with 231-GL cells. We imaged mice with furimazine or coelenterazine for 231-NL and 231-GL cells, respectively, using the same doses of substrates as for mammary tumors. As lung metastases grew over time, photon flux values increased for both luciferases with no significant differences between NL and GL (Figure 4C). These results differ from mammary tumor implants where photon flux values from 231-NL were significantly greater than 231-GL cells. Relatively reduced detection of NL emitted from cells in lung likely is due to the slightly longer peak emission wavelength of GL (480 nm) improving transmission through tissues. However, we note that the results reflect injection of 40-fold less furimazine than coelenterazine. Based on the results with mammary fat pad tumors, we anticipate that NL signal could be increased by injecting greater amounts of furimazine.
Secreted GL has been used to monitor tumor growth based on ex vivo analysis of bioluminescence in serum, which motivated us to determine if secreted NL also could be used for this purpose. 22 We collected blood samples from mice with 231-NL or 231-GL lung metastases at time points corresponding to those of animal imaging studies. On day 4, we detected only minimal amounts of either secreted NL or GL in serum (Figure 4D). The serum levels of NL increased markedly on subsequent days, reflecting the progressive growth of lung metastases observed by in vivo imaging. By comparison, the serum levels of GL remained marginally detectable above background levels despite progressive increases in tumor burden quantified in mice. The differences in detection of NL versus GL are due in part to higher background signal produced by coelenterazine than furimazine in serum samples from non–tumor-bearing mice.
NL Enables Dual Luciferase Molecular Imaging of TGF-β Signaling
Combining NL with FL opens the opportunity to image two different molecular events in signal transduction pathways. We focused on the TGF-β signaling pathway, a context-dependent regulator of multiple steps in tumor progression and a promising therapeutic target. 23 We previously developed a novel FL-based reporter for kinase activity of the type I receptor for TGF-β (TGF-βR1), which we refer to as BTR (Figure 5A). 12 This single molecule reporter encodes split N-terminal and C-terminal fragments of FL, a consensus phosphorylation site for TGF-βR1 kinase activity, and a phosphopeptide binding domain. The reporter has low basal activity because of minimal spontaneous association of N-terminal and C-terminal fragments. However, inhibition of TGF-βR1 kinase activity allows association of N- and C-terminal fragments of FL, so signal from this reporter increases when the kinase activity of the receptor decreases. Given that the association and dissociation of luciferase fragments in the reporter occur rapidly, BTR bioluminescence measures real-time changes in TGF-βR1 kinase activity without a delay needed for new gene expression.

Dual luciferase imaging of TGF-β signaling in cell-based assays. A, Schematic of NanoLuc (NL) and firefly luciferase (FL) reporter constructs. Expression of NL is regulated by a promoter with a SMAD binding element (SBE), so canonical TGF-β signaling increases bioluminescence. The BTR FL reporter uses luciferase complementation to detect phosphorylation of the sensor by TGF-βR1. TGF-β signaling decreases bioluminescence from this reporter. B, A549 cells stably expressing an FL reporter for kinase activity of the type I receptor for TGF-β (BTR) were transiently transfected with SBE-NL and treated with 10 ng/mL TGF-β in the absence or presence of 10 μM of the TGF-βR1 kinase inhibitors SB431542 or SD208 for 22 hours. The graph shows mean values ± SEM for FL activity (n = 3 per condition). The inset shows a bioluminescence image of the 12-well plate and Western blot for levels of NL protein under various treatment conditions. Band intensities quantified by ImageJ were normalized to GAPDH, and values under the blot show induction relative to mock treatment. C, Stably transfected A549-BTR/SBE-NL cells were treated for 22 hours with increasing concentrations of TGF-β before quantifying NL bioluminescence. The graph shows mean values ± SEM (n = 4 per condition). D, The graph shows mean values ± SEM for NL bioluminescence in cells treated with 10 ng/mL TGF-β for 22 hours without or with increasing concentrations of SD208 (n = 4 per condition). *p < .01; **p < .001. E, Bioluminescence microscopy of A549-BTR/SBE-NL cells treated as described for D.
Canonical TGF-β signaling proceeds by phosphorylating SMAD proteins (SMAD2, SMAD3), which bind to SMAD4 and then activate gene expression from promoters containing a specific SBE. 24 However, TGF-β-dependent activation of TGF-βR1 also controls alternative, noncanonical pathways that do not lead to expression of genes controlled by SBE. 25 To link the activity of TGF-βR1 to canonical regulation of transcription via molecular imaging, we used our established A549 lung cancer cell line with the BTR (A549-BTR) and coexpressed a SBE transcriptional reporter driving NL (A549-BTR/SBE-NL) (see Figure 5A).
Initially, we transiently transfected A549-BTR cells with SBE-NL and incubated cells overnight with 10 ng/mL TGF-β. Bioluminescence from SBE-NL in these cells increased by ≈ 17-fold over cells treated with vehicle control, which was blocked completely by two different inhibitors of TGF-βR1 kinase activity (SB43154 and SD208) (Figure 5B).2,276 Changes in bioluminescence from TGF-β without or with added inhibitors corresponded with relative differences in NL protein determined by Western blot, further validating the SBE-NL reporter for signaling. We then used a batch population of A549 cells stably expressing both the BTR and SBE-NL reporters for subsequent assays. In these cells, TGF-β produced concentration-dependent increases in SBE-NL bioluminescence that peaked at > 40-fold induction with 10 ng/mL (Figure 5C). Activation of the SBE-NL reporter in cells treated with 10 ng/mL TGF-β decreased in response to increasing concentrations of SD208 with complete inhibition at 0.5 μM (Figure 5D). We also detected TGF-β-dependent induction and compound-mediated inhibition of the SBE-NL promoter-reporter by bioluminescence microscopy (Figure 5E). The ability to image SBE-NL activity at single-cell resolution emphasizes the strength of signal from NL reporters and opens the potential to analyze the intercellular heterogeneity of transcriptional responses to TGF-β. A549 reporter cells retained expected activation of the FL-based BTR reporter in response to increasing concentrations of SD208 (Figure S2, online version only). SD208 also blocked TGF-β signaling through SMAD2 and SMAD3 at concentrations as low as 0.5 μM as assessed by Western blot, corresponding with the concentration of compound needed to eliminate induction of SBE-NL bioluminescence (see Figure S2). Collectively, these data establish a dual molecular imaging reporter system to quantify activation and inhibition of two key components of canonical TGF-β signaling: receptor activity and transcription.
Dual Luciferase Imaging of TGF-β Signaling in Living Mice
To establish the feasibility of combining NL and FL reporters for molecular imaging in vivo, we implanted tumor xenografts of A549-BTR/SBE-NL cells in immunocompromised mice. After obtaining baseline data for bioluminescence from SBE-NL and BTR reporters, we treated mice with a single dose of TGF-β alone, SD208 alone, or both and imaged changes in signal from each reporter after 6 and 24 hours. Relative to pretreatment values, mice treated with TGF-β alone showed an almost twofold increase in NL signal after 6 hours that persisted through 24 hours (p < .05) (Figure 6, A and B). SD208 blocked the effects of TGF-β on SBE-NL signal. Furthermore, administering SD208 alone decreased basal TGF-β-dependent gene expression by ≈ 50% on both 6- and 24-hour imaging studies (p < .05). We normalized data from posttreatment imaging studies for each mouse to its corresponding pretreatment value, which allows each animal to serve as its own control and accounts for mouse-to-mouse variations in baseline photon flux values (see Figure S3, online version only, for nonnormalized mean photon flux values for each group). These data establish that the SBE-NL reporter can detect basal activity, acute induction, and therapeutic inhibition of TGF-β transcriptional responses in vivo.

Imaging TGF-β signaling with NanoLuc (NL) and firefly luciferase (FL) in living mice. A, Mice were implanted with A549-BTR/SBE-NL cells and treated with 100 ng TGFβ, 50 mg/kg SD208, or both TGF-β and SD208 (n = 5 per group). Bioluminescence images of SBE-NL activity show representative mice from each group prior to treatment and at 6 and 24 hours after treatment. B, NL data for 6- and 24-hour time points for each mouse were normalized to corresponding photon flux values prior to treatment. The graph shows mean values ± SEM for percent change relative to untreated animals in each group at the 6- and 24-hour time points. C, Representative FL bioluminescence images of mice treated as described in A. D, The graph depicts mean values ± SEM for each treatment condition after 6 and 24 hours. *p < .05; **p < .01 relative to pretreatment values.
After allowing ≈ 10 minutes for NL signal to reach background levels, we also imaged FL bioluminescence from the BTR reporter at each time point. The BTR signal after 6 hours increased by almost sixfold in mice treated only with SD208, and this effect was blunted in mice receiving both SD208 and TGF-β (p < .01 and p < .05, respectively) (Figure 6, C and D). FL signal returned almost to pretreatment levels by 24 hours, showing rapid responses of the BTR reporter for the pharmacodynamics of SD208. By comparison, TGF-β alone produced minimal change in FL bioluminescence over 24 hours; the minor increase in signal between pretreatment and posttreatment values may be due to the small growth of tumors between imaging studies.
These studies also show differences in response times due to the design of each reporter. Treatments altered SBE-NL bioluminescence through 24 hours, likely due in part to the stability of the NL enzyme and the duration of TGF-β-dependent transcription. BTR bioluminescence reversed more rapidly because this reporter does not require protein synthesis or degradation to alter signal. Using a destabilized NL enzyme likely would improve the response dynamics to more closely match the BTR, although this strategy would reduce the overall strength of NL signal.11 Most importantly, these studies establish that NL and FL can be combined to image two components of an integrated signaling pathway, providing a new strategy to expand the capabilities of bioluminescence imaging for analyses of signal transduction and therapy in mouse models.
Discussion
Relative to optical imaging with fluorescence, bioluminescence imaging provides numerous advantages for cell-based assays and animal studies. Bioluminescence imaging combines substantially lower background with enzymatic amplification of imaging signal, both of which enhance sensitivity for detection. However, bioluminescence imaging has only limited capabilities for imaging multiple molecular events, unlike fluorescence imaging, in which a wide array of spectrally distinct fluorescent proteins or dyes offer simultaneous detection of multiple signals. To overcome this disadvantage of bioluminescence imaging, there is an unmet need for new luciferase enzymes with distinct spectral properties and substrates to image multiple molecular and cellular processes in intact cells and living mice.
In this study, we investigated applications of the recently characterized luciferase NL and its optimized substrate, furimazine, as a reporter for animal imaging studies. We readily detected NL bioluminescence from cells implanted in superficial sites, showing the utility of this enzyme for in vivo studies of cells and molecular processes in superficial tissues. Bioluminescence from NL also could be imaged in a deeper tissue (lung) in living mice, although the sensitivity for detection was diminished substantially relative to tumors in a superficial tissue. The disparity between imaging NL in superficial versus deep tissues in mice is due to the known effects of tissue to preferentially absorb and scatter blue light, such as the 460 nm peak emission from NL. Even with reduced imaging sensitivity for cancer cells in lung, increases in bioluminescence from NL paralleled increases in FL bioluminescence over time, indicating that NL activity reflects changes in tumor burden in vivo. In studies using a secreted form of NL, we detected bioluminescence from this enzyme in serum samples from tumor-bearing mice, suggesting that NL bioluminescence in serum can be used as an ex vivo biomarker for tumor growth and response to therapy, as has been accomplished with GL.22,28 For cell-based and animal imaging assays, detection of NL bioluminescence was comparable to or greater than that of GL. Collectively, these studies establish the utility of NL for in vivo imaging studies, which we expect will expand applications of bioluminescence imaging for preclinical molecular imaging.
Consistent with a previous in vitro study of NL, we determined that this enzyme produced greater bioluminescence using furimazine as a substrate relative to coelenterazine. 11 However, the combination of NL and coelenterazine produced readily detectable bioluminescence in intact cells, cell supernatants containing secreted NL, and mouse xenograft models of cancer. By comparison, GL typically produced more light when incubated with coelenterazine relative to furimazine. Although these data demonstrate that NL-furimazine and GL-coelenterazine pairs maximize bioluminescence outputs, sufficient cross-reactivity exists with the nonoptimal substrate to substantially limit or preclude simultaneous use of both enzymes for molecular imaging studies.
A previous in vitro study of purified NL showed glow-like kinetics with a half-life exceeding 2 hours. 11 By comparison, our results with cell-based assays and living mice show more rapid loss of signal with a half-life of 5 to 10 minutes. This discrepancy is likely due to restricted diffusion of furimazine across intact cell membranes and metabolism and excretion of substrate from living mice. Nevertheless, NL produced much more sustained bioluminescence over time than GL when assayed under identical conditions. For both cell-based assays and animal imaging, this difference between NL and GL extends the period of time over which bioluminescence may be acquired and integrated, which may enhance the detection of weak signals.
As proof of concept for dual color molecular imaging with NL, we combined an FL reporter for kinase activity of TGF-β1 and an NL-based reporter for TGF-β-dependent transcription to detect and quantify two key steps in TGF-β signaling. The TGF-β signaling pathway regulates cell proliferation, apoptosis, epithelium-to-mesenchyme transition, and cell differentiation in processes including embryogenesis, fibrosis, and cancer. 29 The central involvement of TGF-β signaling in multiple disease processes makes this pathway an active target of drug discovery and development. 30 Capitalizing on differences in emission spectra, substrates, and kinetics of bioluminescence, we sequentially imaged NL and FL activities to measure the effects of TGF-β itself, specific inhibitors, or both on late (gene expression) or early (receptor activation) steps in signaling, respectively. The combination of these reporters allows us to image canonical TGF-β signal transduction from receptor activation to transcription and noncanonical signaling from receptors to outputs other than gene expression. This imaging strategy provides a powerful approach to investigate dynamics and outputs of TGF-β signaling in a variety of normal and pathologic contexts and test the pharmacodynamics of pathway inhibitors in vivo. Moreover, this dual bioluminescence imaging approach combining NL and FL reporters can be adapted readily to analyze key steps in other signaling pathways.
The NL enzyme used in this study previously has been enhanced through point mutation to increase protein stability, augmenting bioluminescence output from this enzyme when matched with furimazine as an optimized substrate. 11 As demonstrated in this study, NL can be used successfully for cell-based and animal imaging studies in combination with firefly luciferase. Similar to other luciferases and reporter proteins, there are future research opportunities to further expand applications of NL for molecular imaging through protein engineering and chemistry. Generating mutants of NL with relatively red-shifted emission, as has been done for enzymes such as Renilla luciferase and GL, will enhance general applications of NL for in vivo imaging.31,32
We also established that furimazine must be injected intravenously to image NL in mice. Although the underlying mechanism remains unclear, our studies showed that intraperitoneal injection of furimazine produced nonspecific bioluminescence throughout the peritoneal cavity. Such background signal did not occur following intravenous injection, potentially because of rapid dilution of substrate into blood. The need to inject the substrate intravenously limits throughput of bioluminescence imaging, which normally is an advantage of this imaging technique. We also note that coelenterazine routinely is injected systemically for imaging studies with GL.6,13
Summary
We established NL as a new bioluminescence reporter for in vivo imaging studies with properties, suggesting that this enzyme-substrate pair may provide advantages over other nonbeetle luciferases, such as GL. Although not formally tested in this study, NL may be particularly useful when fused to a protein of interest, as reported recently.11,33 With a molecular weight of only 19 kDa, NL is smaller than fluorescent proteins, making this imaging marker less likely to perturb functions of the tagged protein. Given that NL does not require ATP, it can be used to image proteins that function in the extracellular space, as we and others have done with GL.7,28,34 By incorporating NL into cell-based and animal studies, we expect that this reporter enzyme will expand the complexity of cellular and molecular events that can be detected and quantified through imaging.
Footnotes
Acknowledgments
We thank Promega for the generous gifts of plasmids for NanoLuc constructs, furimazine, and the polyclonal antibody to NanoLuc.
Financial disclosure of authors: This work was supported by National Institutes of Health national grants R01CA136553, R01CA136829, R01CA142750, and P50CA093990.
Financial disclosure of reviewers: None reported.