
Abstract
This article presents and validates a newly developed GATE model of the Siemens Inveon trimodal imaging platform. Fully incorporating the positron emission tomography (PET), single-photon emission computed tomography (SPECT), and computed tomography (CT) data acquisition subsystems, this model enables feasibility studies of new imaging applications, the development of reconstruction and correction algorithms, and the creation of a baseline against which experimental results for real data can be compared. Model validation was based on comparing simulation results against both empirical and published data. The PET modality was validated using the NEMA NU-4 standard. Validations of SPECT and CT modalities were based on assessment of model accuracy compared to published and empirical data on the platform. Validation results show good agreement between simulation and empirical data of approximately ± 5%.
PRECLINICAL IMAGING SYSTEMS are complex, high-performance research instruments. Having detailed models available that accurately capture their behavior enables new research, ranging from hardware design, to the development of reconstruction and correction algorithms, to the discovery of new imaging applications. These models are critical for aiding imaging developments as they enable execution of experiments that may be unfeasible in a physical system because of expense or technological difficulties.
GATE is a Monte Carlo simulation package based on GEANT4 that has been specifically tailored to the modeling of tomographic imaging systems.1,2 The OpenGATE Collaboration has enabled researchers to develop and share models for a number of preclinical systems. This collaborative network of developers has created the resources necessary for others to develop their own models.
Positron emission tomography (PET) and single-photon emission computed tomography (SPECT) modalities both use gamma photons to create functional images. PET uses positron-emitting isotopes, such as 18F and 124I, which give rise to collinear 511 keV gamma photons through positron-electron annihilation within the subject. Localization of these annihilation events is performed by drawing lines of response between the two detectors that measured the collinear gamma photons within predefined energy and timing windows. 3 SPECT uses single photon–emitting isotopes such as 99mTc, 111In, and 123I. Mechanical collimation (usually a multipinhole arrangement for preclinical systems) enables positioning of the events within a cone in the field of view (FOV), thereby facilitating image reconstruction.
Computed tomography (CT) uses an x-ray tube and a detector mounted to a rotating stage to acquire projection images at varying angles around the subject. These projection images can then be reconstructed into a tomographic image. CT differs from PET and SPECT in that it provides anatomic rather than functional information and is capable of higher-resolution imaging than either PET or SPECT. In addition, CT data play a critical role in providing the information necessary to correct the PET and SPECT data for scatter and attenuation effects.
This article describes and validates a newly developed GATE model of the Siemens Inveon trimodal imaging platform (Siemens Medical Solutions USA, Inc., Knoxville, TN). The model is complete in that it incorporates PET, SPECT, and x-ray CT simulation capabilities. We are making it available for download free of charge from <http://web.eecs.utk.edu/∼jgregor> and from <http://gsm.utmck.edu/research/MITRP/main.cfm> in the hope that this will facilitate new developments that benefit the field of preclinical imaging research.
Material and Methods
GATE models were developed for each of the PET, SPECT, and CT modalities of the Siemens Inveon scanner. Simulations were carried out to assess the consistency between experimental measurements and simulation data. For assessing the performance of the PET model, the National Electrical Manufacturers Association (NEMA) NU-4 standard 4 was used. For small animal SPECT and CT, no comparable standards exist to date. Model performance was therefore compared against a combination of manufacturer specifications, published data, and empirical studies.
All empirical data were collected using an Inveon trimodal system (Siemens Medical Solutions USA, Inc.) with PET, SPECT and CT imaging capabilities. The data were acquired using the Inveon Acquisition Workplace (IAW) software version 1.5 Service Pack 1. Data analysis was performed using ImageJ (National Institutes of Health, Bethesda, MD) and Inveon Research Workplace (IRW) software version 4.0 (Siemens Medical Solutions USA, Inc).
GATE Simulation Setup
GATE v6.1 and GEANT 4.9.1 were installed on a cluster of 30 Intel Xeon X5550 machines running Ubuntu v10.04.3/Linux 2.6.32. Each machine is equipped with eight 2.67 GHz cores and 12 GB DDR3 memory. Simulations with low activity and short duration were executed sequentially on a single machine. Simulations that required long execution times were divided into shorter back-to-back time intervals, which were subsequently executed on the cluster in parallel.
Statistical independence of the simulations was achieved by using the auto mode to seed the random number generation. In this mode, GATE uses the product of the system time and the process id as the seed. An alternative would have been to have a master node provide all nodes' unique seed values. We did not pursue the latter.
PET Modality
High-Level Description
The Siemens Inveon PET subsystem is composed of 16 detector modules. Each module consists of four axially oriented detector blocks. Each detector block consists of a 20 × 20 array of 1.59 mm × 1.59 mm × 10.00 mm lutetium oxyorthosilicate (LSO) crystals. The result is a total of 25,600 detector crystals organized in a 16.1 cm ring diameter. The scanner has an axial FOV of 12.7 cm and a transverse FOV of 10.0 cm. There are 64 acquisition channels, so each detector is coupled via a light guide to a position-sensitive photomultiplier tube (PSPMT). The output of each PSPMT is fed to and processed by a preamplifier electronics stack.
PET GATE Model
The PET GATE model was created by implementing the geometry of one Inveon PET module, which was then duplicated. Other related Inveon and microPET GATE models have been published. 5 Our model more closely accounts for the true system geometry and incorporates digitizers to achieve more accurate simulation results. A so-called ring repeater module was used to create a ring of 16 blocks with a diameter of 16.1 cm. In addition to the detector ring, our model includes the light guide, the back compartment, and lead shielding. These components all serve as photon scattering media. Reflective film and block variance were not modeled because they generally have a minimal effect on overall final model results compared to other factors and model parameters. Figure 1A shows the geometry of our PET model. The detector characteristics and signal processing chain components were modeled using a series of GATE digitizer modules, as shown in Figure 1B. Adder and readout modules were used to group blocks into 64 acquisition channels. Following the manufacturer's specifications, a coincidence window of 3.432 ns was used, and multiple coincidence handling was set to use the takeWinnerofGoods option to take only the good pair with the highest energy. A paralyzable dead-time digitizer was inserted to apply dead time at the single events level. The energy resolution was set to 14.6%. Energy resolution was determined through empirical measurements of energy resolution and comparison to publicly accessible manufacturer data.

(A) Geometry of the PET modality and (B) digitizer.
PET Model Validation
The following features were considered when assessing the validity of simulation data against empirical and published data 6 :
Sensitivity. The system sensitivity, defined as the number of coincidence events detected per unit of radioactive concentration, was measured with a 22Na point source according to the NEMA NU-4 standard and compared against published data 6 for consistency. A 22Na point source with a nominal size of 0.3 mm was embedded in an acrylic cube that was 10.0mmwide on all sides. Energy window settings of 350 to 650 keV and 250 to 750 keV were used. The source was located at the axial center of the FOV. The 22Na point source of 20 μCi was scanned until 10,000 true coincidences had been acquired. Standard deviations of the simulated data were obtained by repeating each simulation 10 times.
Scatter fraction. The scatter fraction, defined as the number of scattered events divided by the total events, was measured using two different cylindrical polyethylene phantoms that simulated the geometry of a mouse and a rat according to the NEMA NU-4 standard. Both phantoms were made of high-density polyethylene (0.96 g/cm3). The mouse-like phantom was a 70 mm long solid cylinder with a 25 mm diameter. A cylindrical hole of 3.2 mm diameter was drilled parallel to the central axis at the radial distance of 10 mm. The rat-like phantom was a 150 mm long solid cylinder with a 50 mm diameter. A cylindrical hole of 3.2 mm diameter was drilled parallel to the central axis at the radial distance of 17.5 mm. An 11C line source was inserted into the cylindrical hole of each phantom. The line source was 60 mm long, and the activity was 500 MBq for the mouse phantom. The line source was 140 mm long with an activity of 600 MBq for the rat phantom. Each phantom was located in the FOV, and data were acquired until the total activity had decayed below 10,000 Bq.
Count rate and noise equivalent count (NEC) rates. The count rate was calculated using the scatter fraction simulation result for the mouse-like phantom. NEC rates were calculated from the simulated count rates using the following equation:

where R2 true is the number of true coincidence events, Rtotal is the number of total events, and Rrandom is the number of random events.
Reconstructed image quality. A GATE model of the NEMA NU-4 Image Quality (IQ) phantom, shown in Figure 2A, was constructed and scanned for 10 minutes with 18F-fluorodeoxyglucose solution of activity 5.1 MBq. An energy window of 350 to 650 keV was used with a 3.432 ns timing window. With reference to Figure 2A, the phantom is composed of a main body, a fixed top cover, and a removable bottom cover, shown in Figure 2, B to E. The main phantom body is a cylinder with 33.5 mm diameter and 56 mm height. It contains a fillable cylindrical chamber with 30 mm diameter and 30 mm height and five fillable rods with diameters of 1, 2, 3, 4, and 5 mm. The cylindrical chamber and the five rods were modeled with cylinder sources with uniform activity. The solid part of the main body was modeled as high-density polyethylene (0.96 g/cm3). The fixed top cover contains two cold-region chambers. These regions are hollow cylinders with 10 mm diameter and 15 mm height with 1 mm thick walls. One chamber is filled with nonradioactive water, and the other is filled with air. Each cold region was modeled using the Forbid command to prevent any positron in that space in GATE. The removable bottom cover is a solid cylinder with 33.5 mm diameter and 5 mm height.
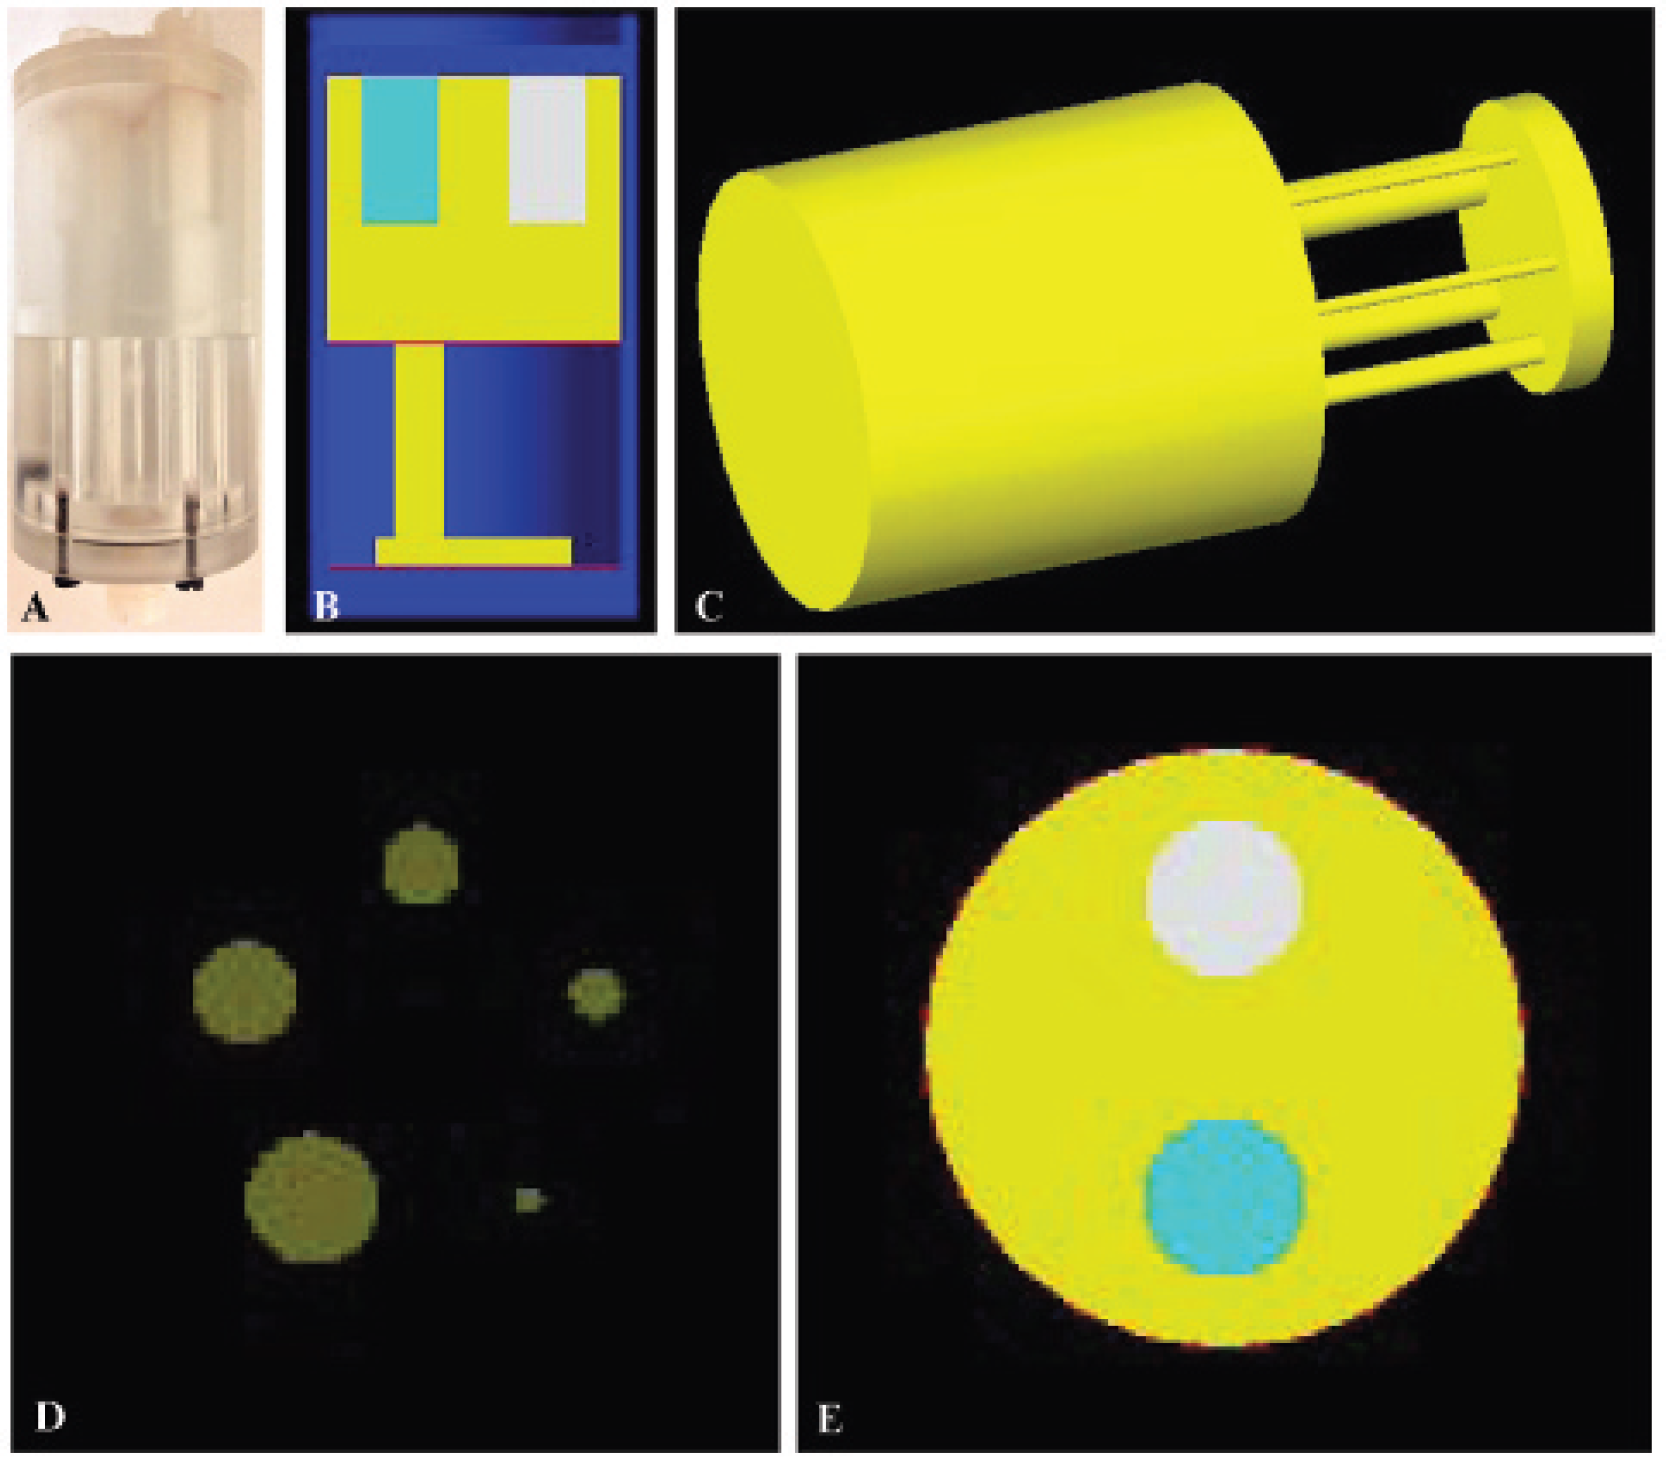
NEMA NU-4 Image Quality phantom picture (A) in coronal view (B), source distribution (C), transverse five-rod plane view (D), and top region (E).
SPECT Modality
High-Level Description
The Siemens Inveon SPECT subsystem contains two detector heads. 7 Each detector consists of a 72 × 72 pixelated scintillator array of 2.0 mm × 2.0 mm × 10 mm NaI(TI) crystals. The detector pixels are separated from one another by a 0.2 mm reflective compound. Moreover, only the central 68 × 68 pixels are used for generating projection images. The scintillator is attached to a light guide that is attached to a 3 × 3 array of 50 mm × 50 mm PSPMTs. The maximum active imaging region is 150 mm × 150 mm, and the detectable energy range is 30 to 300 keV. The SPECT module is equipped with removable collimators with apertures configured to achieve various settings of sensitivity, resolution, magnification, and FOV. Single-pinhole collimators have apertures of 0.5, 1.0, 2.0, and 3.0 mm. These are known as 1MHR05, 1MGP10, 1MHS20, and 1MME30. Two multipinhole collimators are available for imaging mouse brain and mouse whole body, known as 5MBR05 and 5MWB10, respectively. Both multipinhole configurations use five pinhole constellations. The mouse brain collimator (5MWB10) uses 0.5 mm diameter pinholes arranged with each aperture focused inward to tighten the FOV and increase the resolution at a given focal area such as the brain, spleen, or kidney. The collimator designed for whole body mouse imaging (5MBR05) uses 1.0 mm diameter pinholes arranged such that the outer pinholes are outwardly oriented to maximize the useful FOV.
SPECT GATE Model
As shown in Figure 3A, the SPECT GATE model consists of two pixelated detectors with their back compartment, detector housing, test bed, and collimators. Each pixelated detector consists of 72 × 72 pixels separated by 0.2 mm reflective compound. The pixels are grouped into 3 × 3 arrays of 24 crystals, with each array corresponding to a PSPMT. Moreover, only the central 68 × 68 pixels are used for generating projection images. Photon interaction within the same array is treated as being processed by the same PSPMT. Three single-pinhole collimators and one five-pinhole collimator were modeled. These are 1MHR05, 1MGP10, 1MME30, and 5MWB10. The following pinhole characteristics were modeled: acceptance angle, pinhole diameter, depth, keel size, and orientation. The acceptance angle was modeled by attaching appropriate cones at both ends of a cylinder. For multipinhole collimators, each pinhole was modeled individually. The collimators chosen for this work were based on manufacturer feedback regarding the most commonly used collimators and our own laboratory's access to collimator configurations to perform validation of the model.
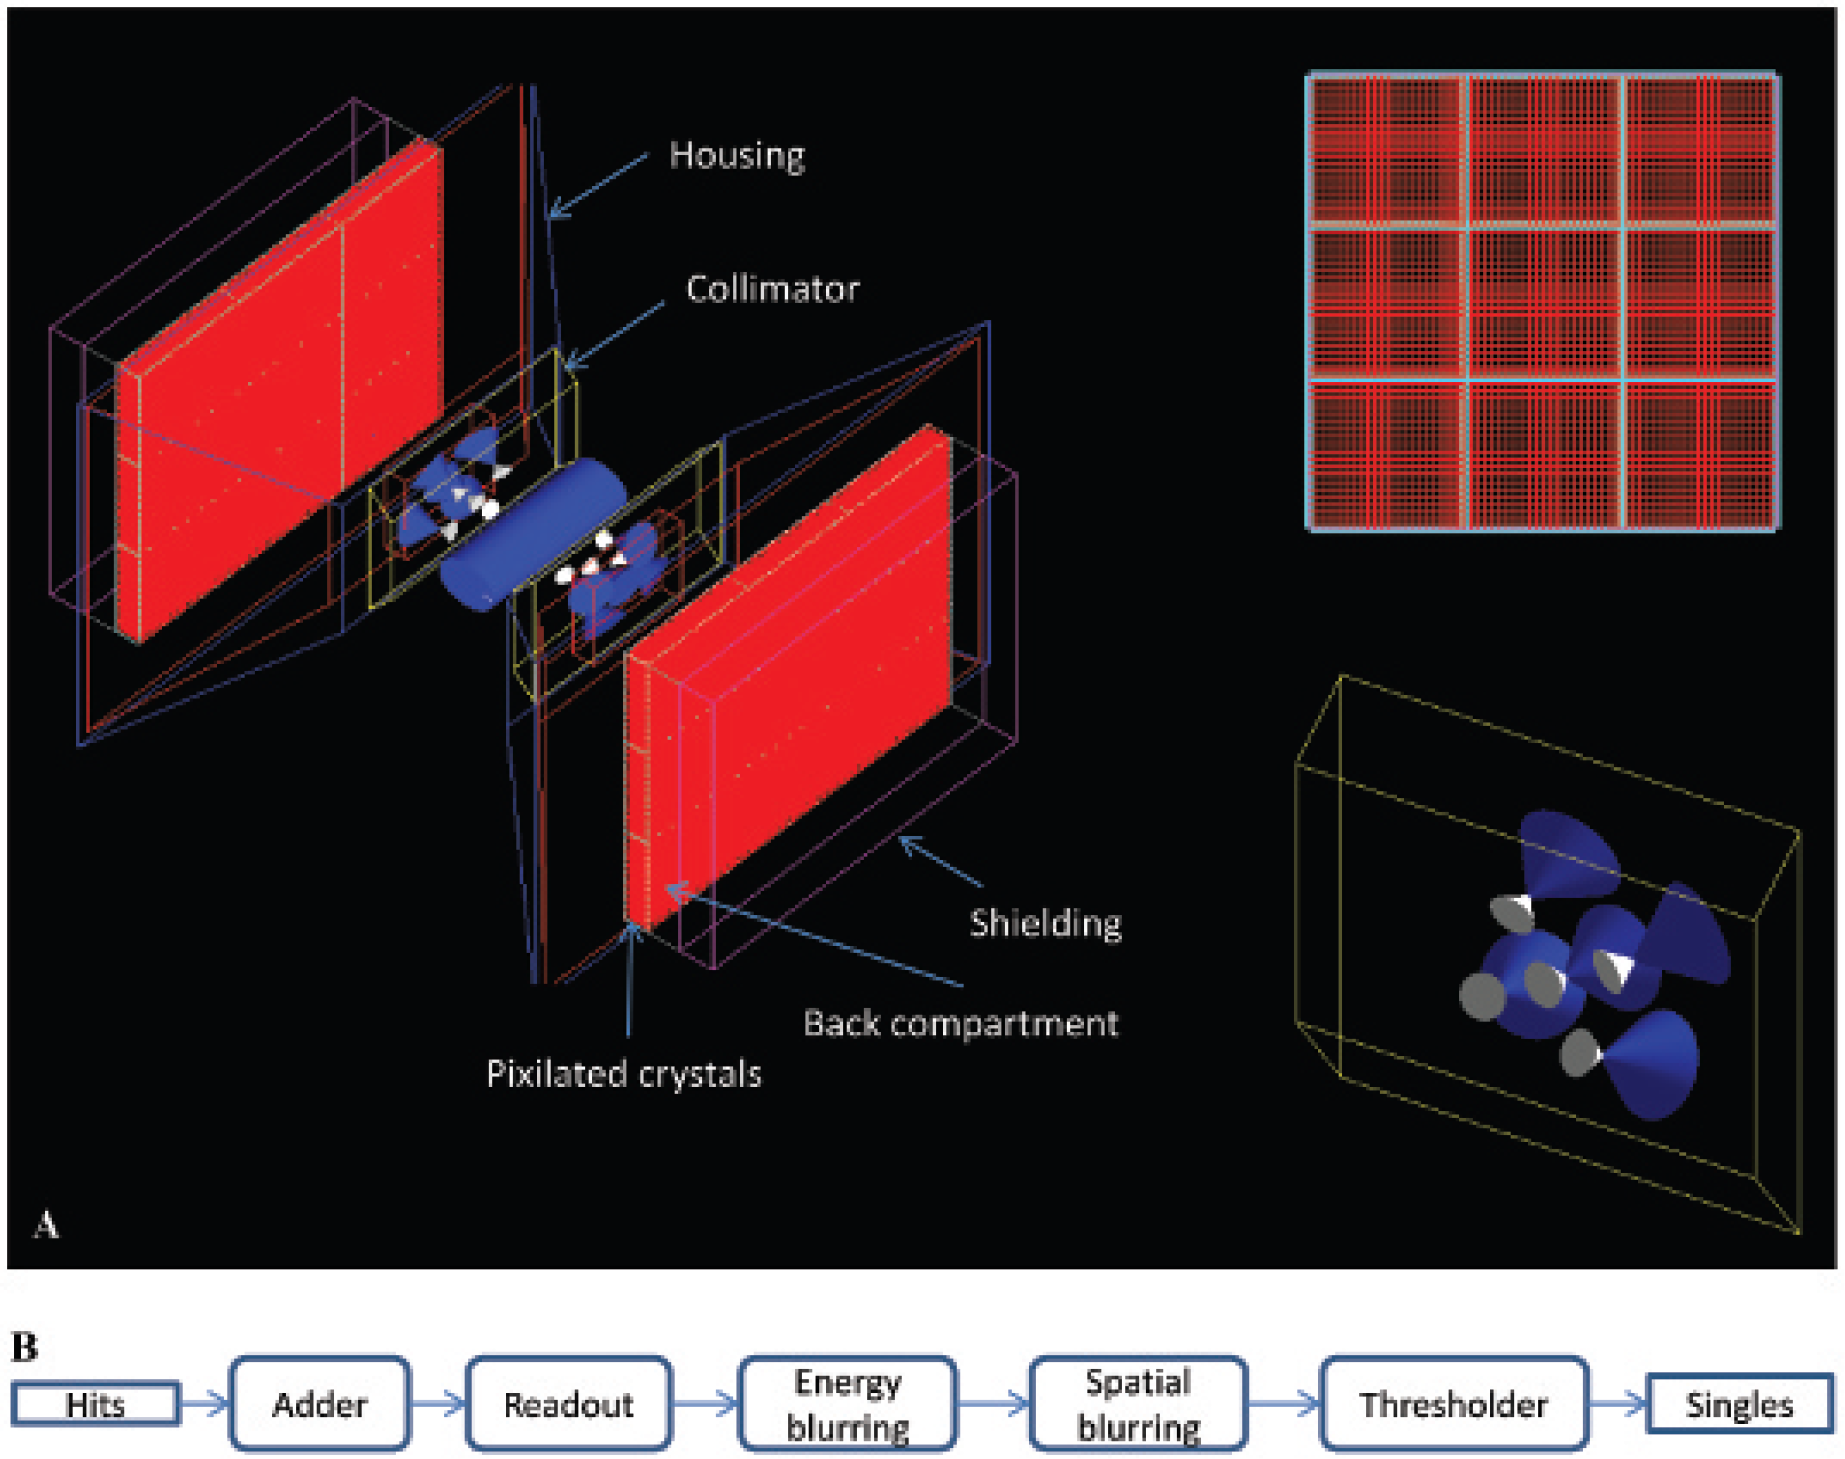
(A) SPECT model with 3 × 3 arrays of pixelated crystals and a five-pinhole collimator and (B) digitizer.
Figure 3B outlines the GATE model of the Inveon SPECT signal processing chain and detector behavior. The adder module sums up the energy deposited by a photon within the same crystal to regroup hits into a pulse. The reader module ensures that any pulse detected within the same 3 × 3 array is treated as being processed by the same PSPMT. The energy blurring and spatial blurring modules simulate system characteristics. Values for energy blurring were determined through empirical measurements of energy resolution and comparison to published manufacturer data. Spatial blurring was selected based on manufacturer specifications/recommendations of intrinsic and reconstructed image resolution. The threshold module accepts photons within a specified energy window and would be the system equivalent of histogramming the data to execute certain energy ranges postacquisition.
Calibration and Normalization Correction Map
To accurately simulate postprocessing, a calibration and normalization correction map was applied to the GATE output. The Inveon uses a robust pinhole calibration technique 8 to calibrate the system with each collimator. Calibration is performed by running a SPECT and CT scan of a cylindrical phantom with four point sources oriented to prevent excess symmetry about the phantom. This calibration routine uses the accurate physical positioning of the point sources in the CT data to tune the unknown geometry of the SPECT components in three-dimensional space. This enables a consistent and accurate geometric calibration of the SPECT components relative to the CT data. The output is processed by the IAW software to create the final calibration calculation. For our GATE simulation, a CT scan of the calibration phantom was acquired for each collimator at each radius of rotation (ROR) using the real machine. These CT images were then used to simulate a SPECT scan of the calibration phantom using our GATE model. Real CT scanning and simulated SPECT scanning of the calibration phantom are used to geometrically calibrate our GATE model in the same manner as the real unit using a proprietary manufacturer calibration algorithm. For further accuracy, a normalization correction map was acquired for each isotope and applied to the output of GATE. We have found that being able to thus process GATE SPECT data in a manner similar to actual Siemens Inveon data greatly improves the quality of the reconstructed image while simultaneously creating a model that more closely represents the typical workflows that would be used by operators of the modeled imaging platform.
SPECT Model Validation
The following features were considered when assessing the consistency between experimental and simulated data. The simulated data were compared against published empirical data from the literature.9,10
Sensitivity. The system sensitivity, defined as the number of detected events divided by the number of emitted/simulated events, was calculated by running GATE simulations with single-pinhole and multipinhole collimators. Each simulation was conducted with 200 μCi 99mTc in a uniform sphere with the activity distributed over a 250 μL (spherical radius = 3.91 mm). A 10-minute acquisition was simulated using both SPECT detectors to acquire data in a stationary position. The SPECT detectors were positioned at a 25, 30, 35, and 40 mm ROR with detector 1 located at 90° and detector 2 at 270°.
Energy spectra and energy resolution. The energy spectra of 99mTc and 57Co were simulated and compared to empirical data for consistency. For 57Co, a 200 μCi point source was used. For 99mTc, a uniform sphere with 200 μCi in 250 μL (spherical radius = 3.91 mm) of water was used. A 10-minute acquisition was simulated with both detectors acquiring data in a stationary position at 30 mm ROR for 900 seconds. The multipinhole collimator was used. The energy resolution for 99mTc and 57Co was measured by calculating the full width half maximum of the corresponding energy peaks divided by the value of the center of the photo peak.
Scatter fraction. The scatter fraction, defined as the number of scattered events divided by the number of total events, was measured using the multipinhole collimator at 30 mm ROR. A 57Co point source phantom with uniform activity of 20 μCi was scanned for 900 seconds both inside and outside a spherical water phantom of approximately 2 cm diameter. SPECT detectors were positioned at 90° and 270°, respectively, when commencing acquisition. Sixty projections were acquired, with each projection taken every 6° over 360° of gantry rotation. The scatter fraction (SF) from the GATE simulation was calculated using the following equation:

where Rtrue is the number of true coincidence events and Rscatter is the number of scatter events. Scatter fraction from the real Inveon system was determined using the basic difference method estimation from Koral. 11
Integral uniformity. The integral uniformity was measured by running a flood scan of a 200 μCi 99mTc source located at the center for 10 hours. An acquisition was simulated with both detectors acquiring data in a stationary position. Collimators and SPECT housing were removed. The SPECT detectors were positioned at 360 mm ROR, with detector 1 again located at 90° and detector 2 at 270°. The data were processed to calculate the integral uniformity by following the procedures outlined in the NU-1 2007 standards.12,13 The following low-pass filter was applied to the resulting image for the purpose of smoothing:

The integral uniformity was then calculated in the following way:uniformity = 100 × (max – min)/(max + min)

where max is the maximum count value and min is the minimum count value in the filtered flood image.
Reconstructed image signal to noise ratio. The projection images produced by GATE were reconstructed using the IAW reconstruction software. 14 The reconstructed images were compared to the one reconstructed from empirical projection data for consistency. For this study, a 200 μCi 99mTc cylinder source with uniform activity distribution was used. The signal to noise ratio was calculated by taking the ratio of the mean to standard deviation of the background corrected values in a circular region (18 mm3) drawn in the phantom and a common background area.
The cylinder phantom consisted of a standard Eppendorf tube approximately 5.08 cm long with a 1 cm diameter. An acquisition of 45 minutes was simulated with detectors located at 30 mm ROR, with detector 1 located at 90° and detector 2 at 270° at the start of simulation. Sixty projections were acquired, with each projection taken every 6° over 360° of gantry rotation.
GATE's Interfile projection output was used to record the simulated projection data. However, we discovered a bug within a spatial blurring module in GATE v6.1. If the camera head was in the YZ plane and was rotating around the Z axis, the activity source was incorrectly shifted to the right from projection to projection. To get around this problem, we developed software that creates projection images directly from the GATE ASCII format. Given that the IAW reconstruction software requires the projection images to be in a specific format, in-house software was developed to automate the conversion process. Calibration data for the GATE simulation were also calculated and given to the IAW reconstruction software along with the projection images. This experiment was repeated with single- and multipinhole collimators. Figure 4 describes the overall reconstruction process.

Reconstructing image with Inveon reconstruction software from GATE output.
CT Modality
High-Level Description
The Siemens Inveon CT subsystem is available in a wide range of x-ray sources and detector configuration and sizes, including a new low-dose configuration. 15 For the purposes of this article, the specific subsystem modeled is the standard 125 mm diagonal x-ray detector configuration with a 3,702 × 2,048 charge-coupled device array equipped with 33 μm × 33 μm pixels. For the x-ray source, we used the standard 80 W, 35 to 80 kVp tungsten anode x-ray source, which has a less than 50 μm focal spot. The active FOV is 8.4 cm × 5.5 cm. We used a 125 mm diagonal x-ray detector configuration. Data were acquired using step-and-shoot. That is, the x-ray source and detector are rotated to a specific angle whereafter data are collected for a specific period of time (exposure time). This process is repeated until projection data have been acquired for all specified view angles.
CT GATE Model
The CT GATE model was created by duplicating the geometry of the 125 mm Inveon CT detector and x-ray source. Figure 5 shows the geometry of CT GATE model and the x-ray source energy spectrum. The Siemens Inveon CT subsystem is almost identical to that of the Siemens microCAT platform for which a GATE model has been reported that simulates the x-ray spectrum. 16 We used the XOP software package 17 to generate the x-ray spectrum for our Siemens Inveon model. The bias voltage was set to 80 kVp. The resulting spectra show good agreement with those reported by Taschereau and colleagues. 16 The number of photons needed to simulate the proper flux was obtained empirically by matching the resulting dose with the published data, 15 although it was not possible to fully simulate the photon output from a typical Inveon CT protocol. The x-ray source cone angle was set to 11° to cover the aforementioned active FOV of 8.4 cm × 5.5 cm.
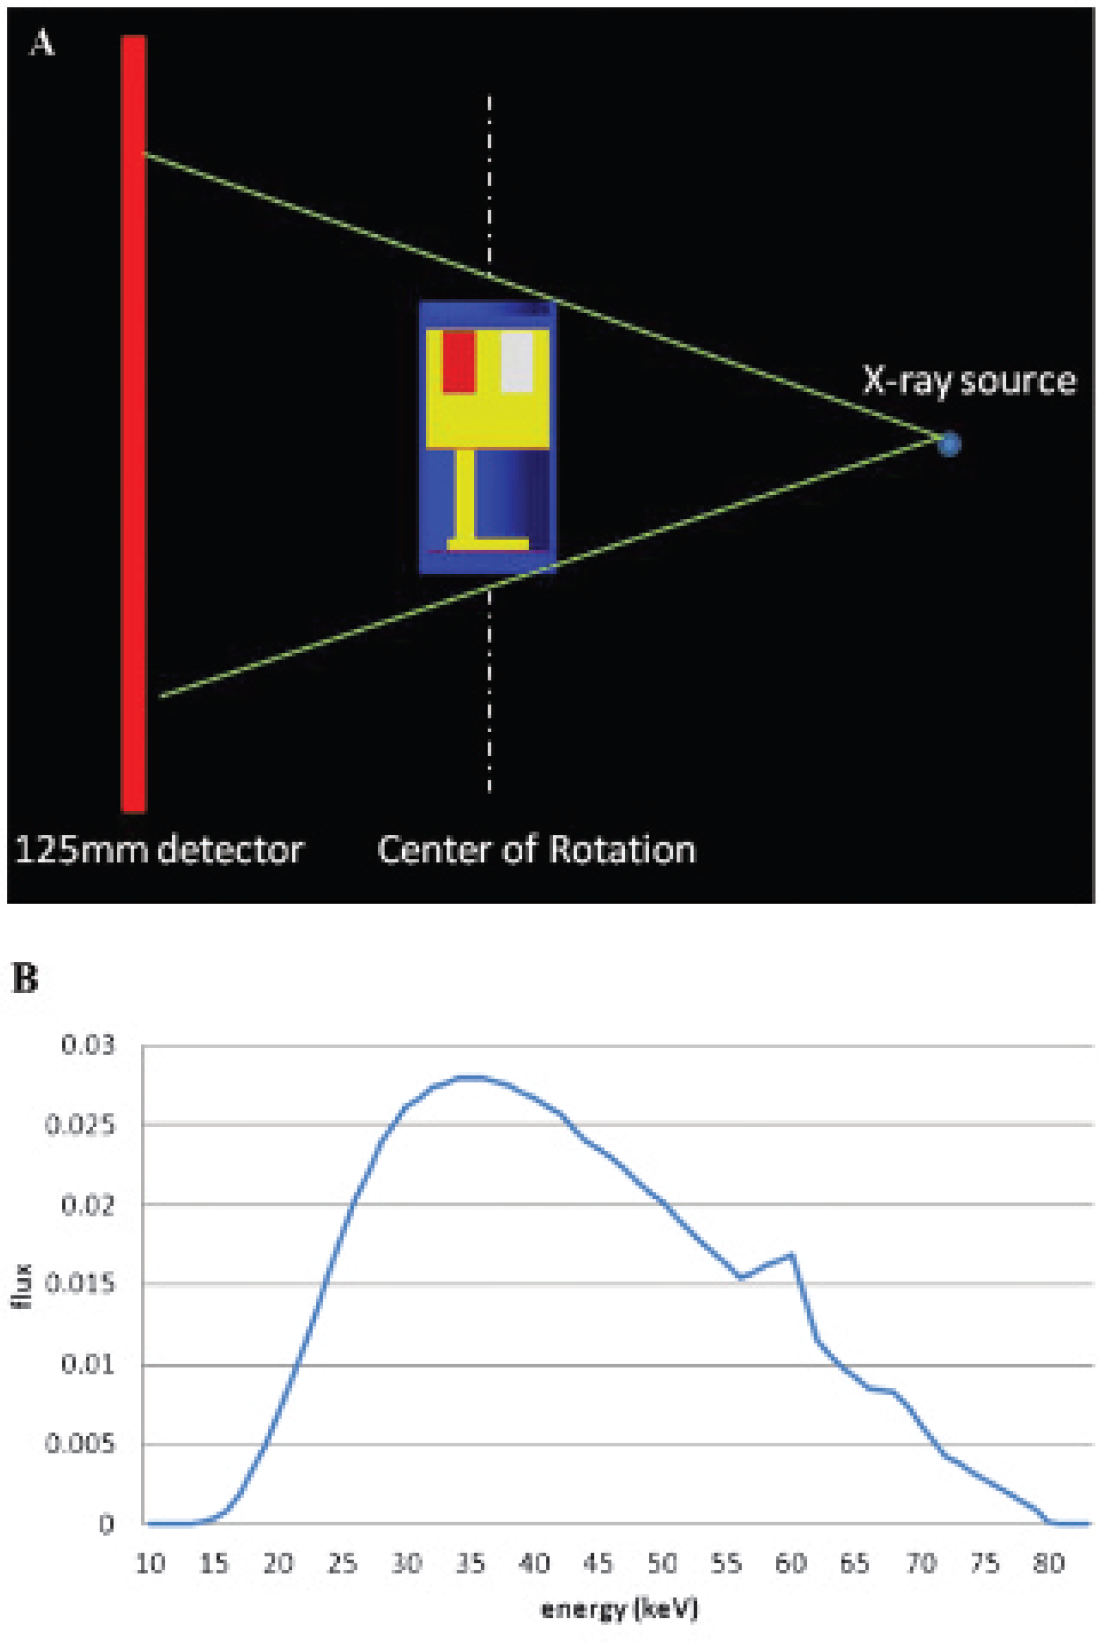
The geometry of the CT GATE model and the x-ray source energy spectrum.
Processing times for the CT module of the GATE program are significant, and some limitations of this module are discussed briefly below. The projection data acquired from the Inveon CT system used a total x-ray on-time of 81 seconds during the course of the tomographic acquisition. The projection data created from the GATE model were created by running a 16-second simulation. This simulation took approximately 4 days on our cluster of 16 machines. To achieve the full 81-second simulation required to fully match the x-ray flux output from the real Inveon CT system during the full data acquisition, approximately 20 days of dedicated simulation time would have been needed.
Validation of GATE Model for the CT Modality
The following features were considered when assessing the consistency between experimental and simulated data:
Dose. Dose is defined as the amount of energy absorbed per unit mass in the phantom on which the x-ray beam is incident. A 70 mm long solid cylinder phantom with a 25 mm diameter was used to simulate the geometry of a mouse. The test phantom was made of high-density polyethylene (0.96 g/cm3). The dose rate was measured at the center of the cylinder using a GATE dose measurement actor. This was meant to correspond to estimating the dose rate at the abdomen of a mouse. Acquisition was simulated for 16 seconds with detectors and x-ray source in stationary position. The average dose at the center of the phantom was measured and compared against published data. 15
Projection images. A CT scan of the NEMA IQ phantom was simulated and the projections were compared to empirical data for consistency. The empirical data were acquired using an exposure time of 225 ms, resulting in a total x-ray on-time of 81 seconds. The GATE simulation was based on a voxelized version of the NEMA IQ phantom acquired with a total simulated acquisition time of 16 seconds. Average dose was measured at the center of the phantom to ensure that the x-ray energy output was sufficiently high. Software was developed to construct a projection image from the GATE ROOT output file.
Results
PET Modality
Scatter Fraction and Sensitivity
Table 1 provides a comparison of simulated and empirical system sensitivity and scatter fraction. Standard deviations were calculated by running 10 simulations. For 250 to 750 keV, the simulated sensitivity was 9.1 ± 0.2%, whereas the empirical sensitivity was 9.32%. For 350 to 650 keV, the simulated sensitivity was 6.6 ± 0.3%, whereas the empirical sensitivity was 6.72%. For the mouse phantom, the simulated scatter fraction was 7.2 ± 1.1%, whereas the empirical scatter fraction was 7.8%. For the rat phantom, the simulated scatter fraction was 16.9 ± 1.2%, whereas the empirical scatter fraction was 17.2%.
Comparison of Simulated and Empirical System Sensitivity and Scatter Fraction for PET Modality

PET = positron emission tomography.
Count Rate and NEC Rates
Figure 6 shows the NEC rate as a function of total activity for the mouse phantom with an energy window of 350 to 650 keV from GATE simulation data. The peak NEC rate of 1.56 Mcps was achieved for an activity of 130 MBq. This is in agreement with a peak NEC rate value of 1.67 Mcps for published data. 8

Simulated noise equivalent count rate (NECR) versus total activity for the mouse-sized phantom.
Reconstructed Image
Figure 7 shows the reconstructed NEMA NU-4 IQ phantom in transverse and coronal views using GATE simulation output. This image was reconstructed using the FBP3D algorithm on the STIR platform. 18

Reconstructed NEMA NU-4 Image Quality Phantom in transverse and coronal views.
SPECT Modality
Sensitivity
Figure 8 provides a comparison of collimator sensitivity as a function of the ROR between our simulation results and empirical data from the literature. The two sets of results agree well with one another. For example, simulated and empirical sensitivities with a single-pinhole collimator at 30 mm ROR are 214 cps/MBq and 219 cps/MBq, respectively.

Collimator sensitivity as a function of radius of rotation.
Energy Spectra and Energy Resolution
Figure 9 shows the experimental and simulated energy spectra for a 57Co point source in air and a 99mTc uniform sphere source in air normalized to the same maximum. Both isotope spectra show good agreement between the simulation and empirical data. The energy peak is slightly misaligned because of the binning process. Table 1 compares the simulated energy resolution of 57Co and 99mTc against empirical and published data at various configurations.
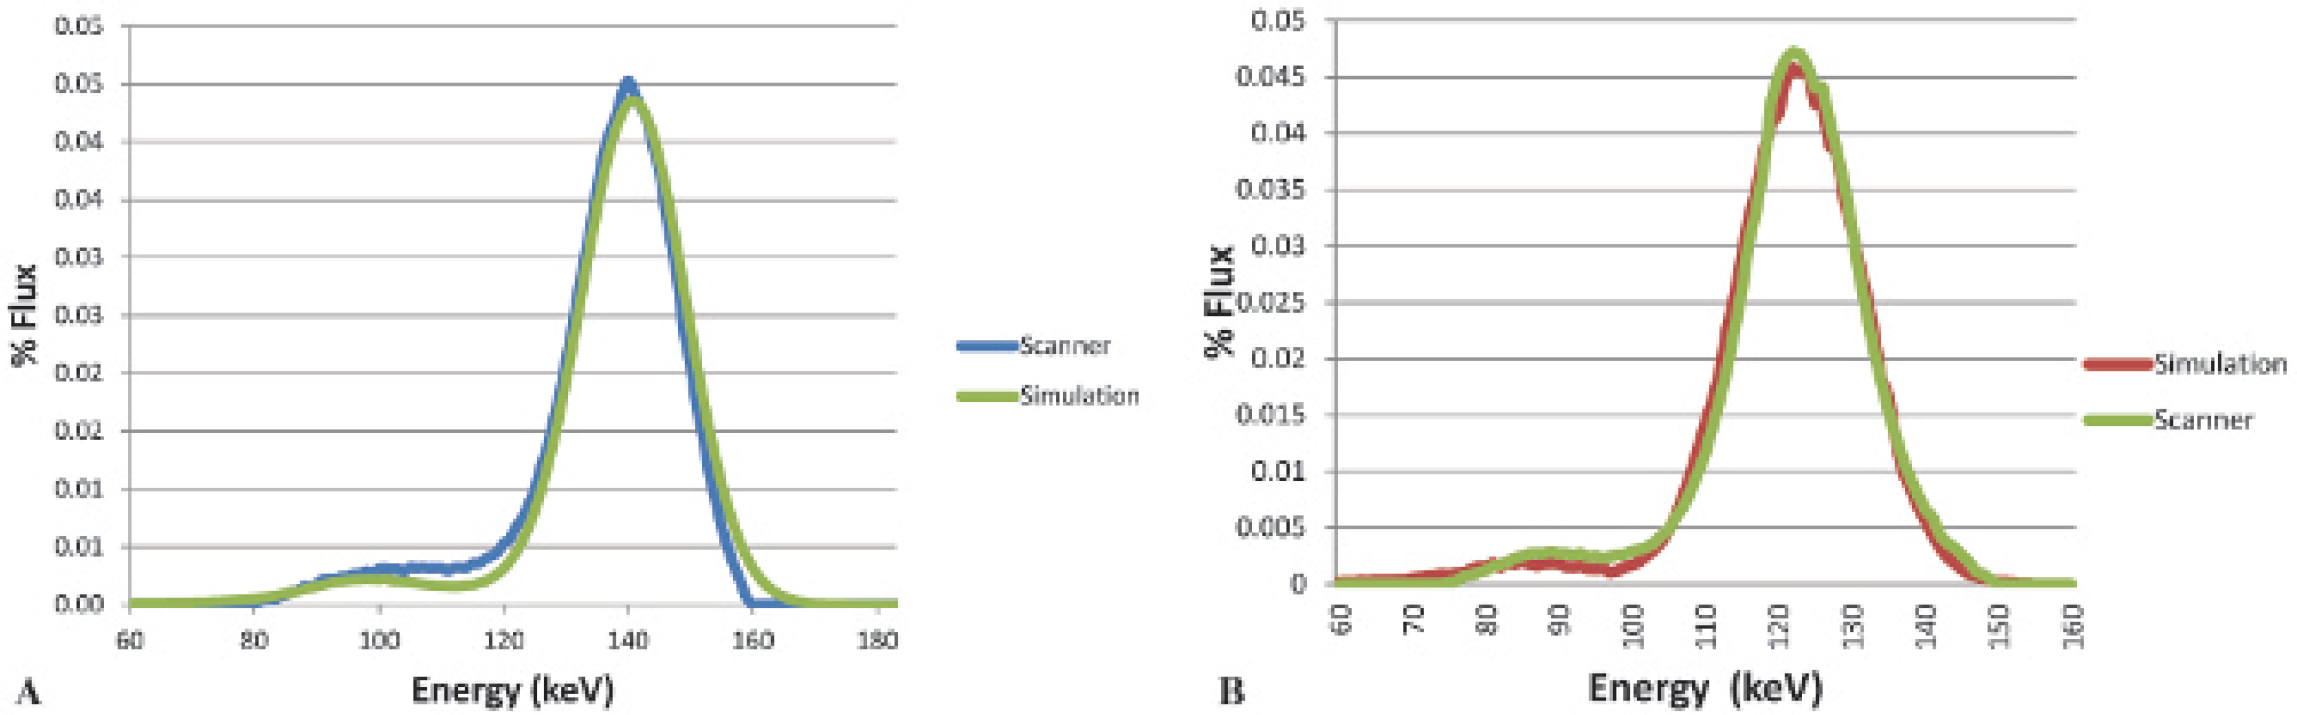
Acquired and simulated energy spectra of (A) 57Co and (B)99mTc in air.
Scatter Fraction and Integral Uniformity
Table 2 lists scatter fractions for GATE simulations and experimental measurements. Empirical scatter fraction was determined by using the difference estimation method from Koral. 11 Simulation and experimental scatter fractions differ by only 0.08%. Simulated and experimental integral uniformities differ by 1.59%; however, this is smaller than the manufacturer's requirement of 5%.
Comparison of Simulated SPECT Results with Empirical and Manufacturing Numbers

N/A = not available; ROR = radius of rotation; SNR = signal to noise ratio; SPECT = single-photon emission computed tomography.
Reconstructed Image Signal to Noise Ratio
Figure 10 provides a comparison of the reconstructed uniform cylinder source of the GATE simulation to that of empirical data. Both sets of data were reconstructed using the IAW reconstruction software. The somewhat nonuniform appearance of both images is due to the source activity being a mere 200 μCi and the low sensitivity of the 1.0 mm single-pinhole collimator. As shown in Table 1, image signal to noise ratios for the simulation and empirical data were 11.3% and 10.8%, respectively.

SPECT projection images (A) showing single and multipinhole projections of the SPECT calibration phantom (A, C) and uniform cylinder (B, D). Reconstructed uniform cylinder comparison (B) with empirical and simulation data.
CT Modality
Figure 11 shows comparable CT projection images of the NEMA NU-4 IQ phantom taken from GATE simulation (16 seconds) and the scanner (81 seconds). The average dose rate at the center of the simulation data and at the center of the phantom of the scanner is approximately matched to 0.02 mGy/s. Projection images show that the CT simulation shows an excellent representation of the Inveon system and that this model of the CT system can accurately generate projection images.

CT projection image of the NEMA NU-4 Image Quality phantom from (A) simulation with a total scan time of 16 seconds and (B) a scanner with a total x-ray on-time of 81 seconds. Dose rates were matched as closely as possible to 0.02 mGy/s.
Discussion and Conclusion
We developed GATE models for the PET, SPECT, and CT subsystems of the Siemens Inveon preclinical scanner. Model validity was assessed by comparing simulation data against both empirical and published data. The NEMA NU-4 standard was used for validating the PET model. Since a comparable standard does not yet exist for preclinical SPECT and CT, key performance characteristics were compared instead. The results show good agreement between the simulated data and the empirical and published data for all three modalities.
Future work will incorporate background noise currently not modeled. The intrinsic activity of LSO in the PET ring, for example, is not considered at present. Although it is usually low enough not to influence routine PET scanning, it could be a problem when using a weak source for imaging small animals with small ring diameters or a wide energy window.19,20 We also suspect that emissions from the intrinsic activity of LSO from 176Lu in the PET ring result in the emission of characteristic lead x-rays from interactions between the LSO emissions and the lead collimators. This appears to result in a photopeak at approximately 70 keV, which will be studied further regarding its potential effect on SPECT imaging of low-energy isotopes at small doses.
The CT modality simulation module of GATE is still somewhat of a work in progress. The x-ray source is simulated by a point source of activity rather than an x-ray tube. In this scenario, an activity level is set based on x-ray spectra and estimated dose rates from the system being modeled. This allows the creation of a point source that ideally provides equivalent counts to the real system for any given projection. In practice, this does not match perfectly as the point source setup does not take into account the finite width of the x-ray beam emitted from the tube. In addition, the intensive processing times required for this module under its current assumptions make routine simulation of common protocols difficult. Improving the CT simulation capabilities of GATE is another future research project we hope to undertake.
Footnotes
Acknowledgments
We would like to thank Dr. Jonathan Wall for providing his time and the use of his laboratory when acquiring critical data related to the validation of our new model.
Financial disclosure of authors: Dustin Osborne is also employed part-time by Siemens Medical Solutions in a limited capacity.
Financial disclosure of reviewers: None reported.