
Abstract
The formation of β-amyloid (Aβ) plaques is a critical neurodegenerative change in Alzheimer disease (AD). We designed and synthesized novel boron dipyrromethane (BODIPY)-based Aβ probes (BAPs) and evaluated their utility for near-infrared fluorescence imaging of Aβ plaques in the brain. In binding experiments in vitro, BAPs showed high affinity for synthetic Aβ aggregates (Kd = 18–149 nM). Furthermore, BAPs clearly stained Aβ plaques in sections of Tg2576 mice. In mouse brain tissue, BAPs showed sufficient uptake for optical imaging. In addition, ex vivo fluorescent staining of brain sections from Tg2576 mice after the injection of BAP-2 showed selective binding of Aβ plaques with little nonspecific binding. BAPs may be useful as a near-infrared fluorescent probe for imaging Aβ plaques.
ALZHEIMER DISEASE (AD) is a progressive neurodegenerative disorder characterized by cognitive decline, irreversible memory loss, disorientation, and language impairment. The formation of β-amyloid (Aβ) plaques has been regarded as an initial event in the pathogenesis of AD.1,2 The quantitative evaluation of Aβ plaques in the brain with noninvasive techniques including positron emission tomography (PET),3–10 single-photon emission computed tomography (SPECT),11–14 magnetic resonance imaging (MRI),15–18 and optical imaging19–30 could lead to the presymptomatic detection of AD or monitoring of the progression and effectiveness of novel treatments that are currently being investigated. In particular, PET probes such as [11C]PIB,9,10 [18F]BAY94-9172,7,8 [18F]AV-45,4,6 and [18F]AZD46943,5 have been tested clinically and demonstrated their utility. However, factors such as a time-consuming data acquisition process, expensive equipment, exposure to radioactivity, and the limited availability of radioisotopes for PET probes restrict its use.
Optical imaging has limitation of depth penetration, resolution, and clinical translation.31,32 Conversely, optical imaging with fluorescence probes is a rapid, inexpensive, and nonradioactive drug screening system for AD. Especially, in the near-infrared (NIR) range (650–900 nm), biologic samples have a low fluorescence background, producing a high signal to noise ratio. 33 Therefore, near-infrared fluorescence (NIRF) probes are suitable for imaging in vivo. In principle, a good NIRF probe for Aβ plaques should have the following properties: (1) a suitable wavelength of absorption, excitation, and emission (> 650 nm); (2) the ability to rapidly enter the brain after intravenous injection; (3) specific labeling of the Aβ plaques with rapid clearing of the unbound dye; and (4) on binding to Aβ plaques, it should significantly change its fluorescence properties (hyperchromic effect).22,26 Recently, compounds such as AOI-987, 21 NIAD-4, 22 CRANAD-2, 26 and THK-265 24 have been reported as candidate probes for the NIRF imaging of Aβ plaques. However, these compounds still have properties that need to be improved, including a short excitation wavelength, small Stokes shift, low brain uptake, and weak hyperchromic effect. As yet, no probe meets all of the necessary criteria. Optical imaging of Aβ plaques with NIRF probes may make the diagnosis of AD more convenient. Therefore, more useful NIRF probes for imaging Aβ plaques are strongly desired.
Boron dipyrromethane (BODIPY) has outstanding photophysical properties as a fluorescent scaffold, such as high photostability, a high fluorescent quantum yield, a high extinction coefficient, and pH or environmental insensitivity. Therefore, BODIPY has been used as a scaffold for fluorescent probes for various targets, candidates for solid-state solar concentrators, and materials for incorporation into electroluminescent devices.34–37 We previously reported a BODIPY-based molecular probe (BAP-1) with a dimethylamino styryl group that plays an important role in binding to Aβ aggregates. 38 BAP-1 showed good affinity for synthetic Aβ(1–42) aggregates in vitro (Kd 5 44 nM), penetrated the blood-brain barrier, and selectively labeled Aβ plaques in the mouse brain. However, BAP-1 showed shorter wavelengths of excitation/emission at 614/648 nm than are appropriate for optical imaging in vivo. Consequently, further optimization of the substituted groups in the BODIPY scaffold was needed to achieve clearer imaging of Aβ plaques in vivo.
A previous report showed that the wavelength of BODIPY derivatives could be lengthened by replacing a phenyl group with a thiophenyl or furanyl group. 35 Several reports have suggested that such a change in some Aβ-binding compounds does not affect affinity for Aβ aggregates.19,23,28,39–41 Thus, we planned to substitute the dimethylaminophenyl group in BAP-1 with a dimethylaminothiophenyl group (BAP-2), a dimethylaminofuranyl group (BAP-3), a dimethylaminophenylthiophenyl group (BAP-4), and a dimethylaminophenylfuranyl group (BAP-5) (Figure 1). In the present study, we synthesized four novel BODIPY-based Aβ probes (BAP-2–5) and evaluated their biologic potential as NIRF probes for imaging Aβ plaques.
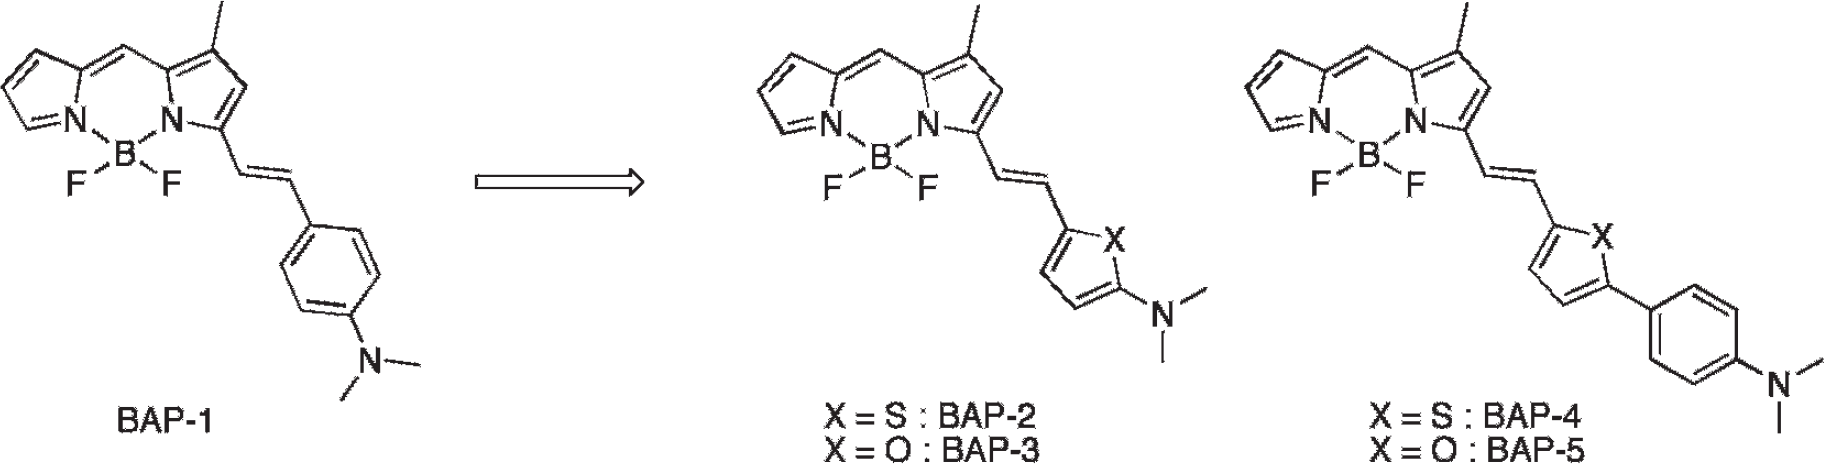
Chemical structure of BAP-1 reported previously and novel BAPs reported in this article.
Methods
General
All reagents were obtained commercially and used without further purification unless otherwise indicated. 1H nuclear magnetic resonance (NMR) and 13C NMR spectra were obtained on a JNM-LM400 (JEOL Ltd., Tokyo, Japan) spectrometer with tetramethylsilane as an internal standard. Coupling constants are reported in hertz. Multiplicity was defined by singlet (s), doublet (d), and multiplet (m). Mass spectra (MS) and high resolution mass spectra (HRMS) electron ionization (EI) were obtained on a GCMS-QP2010 Plus (Shimadzu Corp., Kyoto, Japan) or JMS-GC mate mass spectrometer (JEOL Ltd., Tokyo, Japan).
1,3-Dimethyl-4,4-difluoro-4-bora-3a,4a-diaza-s-indacene (1)
A solution of pyrrole 2-carboxyaldehyde (368 mg, 3.87 mmol) and 2,4-dimethylpyrrole (368 mg, 3.87 mmol) in CHCl3 (10 mL) was cooled to 0°C. After POCl3 (360 μL) was added with caution, the mixture was stirred at room temperature for 2 hours. BF3OEt2 (3 mL) and Et3N (3 mL) were added sequentially, and the resulting mixture was stirred at room temperature for 10 minutes. The solution was washed with H2O and dried with Na2SO4. The solvent was removed, and the residue was purified by silica gel column chromatography (hexane:ethyl acetate = 2:1) to give 308 mg of 1 (36.1%). 1H NMR (400 MHz, CDCl3) δ2.28 (s, 3H, CH3), 2.59 (s, 3H, CH3), 6.16 (s, 1H, Pyrrol-H), 6.43 (m, 1H, Pyrrol-H), 6.93 (d, J = 3.6Hz, 1H, Pyrrol-H), 7.20 (s, 1H, Pyrrol-H), 7.65 (s, 1H, Pyrrol-H). 13C NMR (100 MHz, CDCl3) δ11.3, 15.0, 116.2, 121.2, 124.8, 126.5, 132.5, 136.5, 138.9, 146.0, 163.1. MS m/z 220 (M+).
5-(Dimethylamino)thiophene-2-carbaldehyde (2)
5-Bromo-2-thiophenecarboxaldehyde (1.0 g, 5.23 mmol) was dissolved in H2O (3 mL) with dimethylaniline (1.64 mL, 15.69 mmol). The mixture was stirred under reflux for 6 hours, and then cooled to room temperature. After extraction with chloroform, the organic phase was dried over Na2SO4 and filtered. The solvent was removed, and the residue was purified by silica gel chromatography (hexane:ethyl acetate = 1:1) to give 521 mg of 2 (64.1%). 1H NMR (400 MHz, CDCl3) δ3.08 (s, 6H, N(CH3)2), 5.92 (d, J = 4.6 Hz, 1H, Thiophene-H), 7.46 (d, J = 4.1 Hz, 1H, Thiophene-H), 9.49 (s, 1H, C(O)H). 13C NMR (100 MHz, CDCl3) δ41.8, 103.2, 126.9, 140.2, 168.0, 180.0. MS m/z 155 (M+).
5-(Dimethylamino)furan-2-carbaldehyde (3)
The same reaction as described above to prepare 2 was used, and 496 mg of 3 was obtained in a 49.9% yield from 5-bromo-2-furaldehyde. 1H NMR (400 MHz, CDCl3) δ3.07 (s, 6H, N(CH3)2), 5.24 (d, J = 4.6 Hz, 1H, Furan-H), 7.20 (s, 1H, Furan-H), 8.97 (s, 1H, C(O)H). 13C NMR (100 MHz, CDCl3) δ37.9, 86.2, 126.9, 140.2, 168.0, 180.0. MS m/z 139 (M+).
4,4-Difluoro-3-{(E)-{2-(5-dimethylaminothienyl) ethenyl}}-1-methyl-4-bora-3a,4a-diaza-s-indacene (4: BAP-2)
1 (288 mg, 1.31 mmol) and 2 (203 mg, 1.31 mmol) were dissolved in toluene (10 mL) with piperidine (917 μL) and AcOH (917 μL). The mixture was stirred under reflux for 2 hours. After the mixture had cooled to room temperature, H2O was added and extracted with chloroform. The organic phase was dried over Na2SO4 and filtered. The solvent was removed, and the residue was purified by silica gel chromatography (chloroform) to give 26 mg of 4 (5.6%). 1H NMR (400 MHz, dimethyl sulfoxide [DMSO]-d6) δ2.26 (s, 3H, CH3), 3.09 (s, 6H, N(CH3)2), 6.11 (d, J = 4.1 Hz, 1H, Thiophene-H), 6.35 (s, 1H, Pyrrol-H), 6.65 (d, J = 15.9 Hz, 1H, C5CH), 6.78 (d, J = 2.7 Hz, 1H, Pyrrol-H), 6.99 (s, 1H), 7.28 (d, J = 4.1 Hz, 1H, Thiophene-H), 7.30 (s, 1H, Pyrrol-H), 7.38 (s, 1H, Pyrrol-H), 7.83 (d, J = 15.1 Hz, 1H, C5CH). 13C NMR (100 MHz, DMSO-d6) δ10.9, 41.7, 104.8, 108.0, 114.2, 117.9, 118.3, 121.1, 124.7, 131.9, 132.9, 136.8, 137.8, 138.5, 144.3, 160.0, 164.4. HRMS (EI) m/z calculated (calcd) for C18H18BF2N3S (M+) 357.1282, found 357.1284.
4,4-Difluoro-3-{(E)-{2-(5-dimethylaminofuranyl) ethenyl}}-1-methyl-4-bora-3a,4a-diaza-s-indacene (5: BAP-3)
The same reaction as described above to prepare 4 was used, and 131 mg of 5 was obtained in a 29.2% yield from 1 and 2. 1H NMR (400 MHz, DMSO-d6) δ2.29 (s, 3H, CH3), 3.11 (s, 6H, N(CH3)2), 5.69 (d, J = 3.7 Hz, 1H, Furan-H), 6.37 (s, 1H, Pyrrol-H), 6.76 (s, 1H, Pyrrol-H), 6.82 (d, J = 15.1 Hz, 1H, C=CH), 7.01 (s, 1H, Pyrrol-H), 7.11 (d, J = 3.7 Hz, 1H, Furan-H), 7.24 (s, 1H, Pyrrol-H), 7.39 to 7.42 (m, 2H, Pyrrol-H, C=CH). 13C NMR (100 MHz, DMSO-d6) δ11.1, 37.8, 90.0, 105.3, 113.8, 116.0, 118.4, 119.8, 127.0, 127.3, 132.0, 132.2, 139.1, 143.7, 144.0, 160.2, 163.3. HRMS (EI) m/z calcd for C18H18BF2N3S (M+) 341.1510, found 341.1506.
5-(4-(Dimethylamino)phenyl)thiophene-2-carbaldehyde (6)
To a solution of 5-formyl-2-thiophene boronic acid (390 mg, 2.5 mmol), 4-bromo-N,N-dimethylaniline (500 mg, 2.5 mmol), and Pd(PPh3)4 (50 mg) in dioxane (15 mL) was added in a solution of aqueous Na2CO3 (10 mL) under a nitrogen atmosphere. The mixture was stirred overnight under reflux. The reaction was quenched by the addition of H2O. Following extraction with chloroform, the combined organic extract was dried over anhydrous MgSO4 and filtered. The solvent was removed, and the residue was washed with hexane to give 258 mg of 6 (44.7%). 1H NMR (400 MHz, CD3Cl3) δ3.02 (s, 6H, N(CH3)2), 6.72 (d, J = 9.2 Hz, 2H, Phenyl-H), 7.23 (d, J = 4.1 Hz, 1H, Thiophene-H), 7.57 (d, J = 8.7 Hz, 2H, Phenyl-H), 7.68 (d, J = 4.1 Hz, 1H, Thiophene-H), 9.76 (s, 1H, C(O)H). 13C NMR (100 MHz, CDCl3) δ40.2, 112.1, 120.8, 121.5, 127.5, 138.0, 140.1, 151.1, 156.0, 182.4. MS m/z 231 (M+).
5-(4-(Dimethylamino)phenyl)furan-2-carbaldehyde (7)
The same reaction as described above to prepare 6 was used, and 131 mg of 5 was obtained in a 49.3% yield from 4-bromo-N,N-dimethylaniline and 5-formyl-2-furan boronic acid. 1H NMR (400 MHz, CDCl3) δ3.04 (s, 6H, N(CH3)2), 6.63 (d, J = 3.6 Hz, 1H, Furan-H), 6.73 (d, J = 8.8 Hz, 2H, Phenyl-H), 7.29 (d, J = 3.6 Hz, 1H, Furan-H), 7.71 (d, J = 8.8 Hz, 2H, Phenyl-H), 9.54 (s, 1H, C(O)H). 13C NMR (100 MHz, CDCl3) δ40.1, 104.9, 111.8, 116.7, 126.7, 128.5, 131.9, 151.1, 161.1, 176.2. MS m/z 215 (M+).
4,4-Difluoro-3-{(E)-{2-[5-(4-dimethylaminophenyl) thienyl]ethenyl}}-1-methyl-4-bora-3a,4a-diaza-s-indacene (8: BAP-4)
The same reaction as described above to prepare 2 was used, and 21.5 mg of 8 was obtained in a 10.9% yield from 1 and 6. 1H NMR (400 MHz, DMSO-d6) δ2.33 (s, 3H, CH3), 2.98 (s, 6H, N(CH3)2), 6.49–6.50 (m, 1H, Pyrrol-H), 6.76 (d, J = 9.2 Hz, 2H, Phenyl-H), 7.04 (d, J = 4.1 Hz, 1H, Thiophene-H), 7.06 to 7.11 (m, 2H, C5CH, Pyrrol-H), 7.38–7.41 (m, 2H), 7.59 (d, J = 9.2 Hz, 2H, Phenyl-H), 7.65 (s, 1H, Pyrrol-H), 7.69 (s, 1H, Pyrrol-H), 7.96 (d, J = 16.0 Hz, 1H, C5CH). 13C NMR (100 MHz, DMSO-d6) δ11.2, 112.3, 114.8, 116.1, 118.0, 120.5, 122.6, 123.0, 125.3, 126.8, 132.8, 134.1, 134.5, 137.4, 137.8, 137.9, 145.2, 148.9, 150.6, 158.3. HRMS (EI) m/z calcd for C18H18BF2N3S (M+) 433.1595, found 433.1591.
4,4-Difluoro-3-{(E)-{2-[5-(4-dimethylaminophenyl) furanyl]ethenyl}}-1-methyl-4-bora-3a,4a-diaza-s-indacene (9: BAP-5)
The same reaction as described above to prepare 2 was used, and 73 mg of 9 was obtained in a 38.9% yield from 1 and 3. 1H NMR (400 MHz, CDCl3) δ2.31 (s, 3H, CH3), 3.03 (s, 6H, N(CH3)2), 6.44 (m, 1H, Pyrrol-H), 6.59 (d, J = 3.6 Hz, 1H, Furan-H), 6.70 (s, 1H, Pyrrol-H), 6.70 to 6.76 (m, 3H, Phenyl-H, Furan-H), 6.86 (d, J = 3.2 Hz, 1H, Pyrrol-H), 7.08 (s, 1H, Pyrrol-H), 7.15 (d, J = 15.6 Hz, 1H, C=CH), 7.50 (d, J = 15.6 Hz, 1H, C=CH), 7.65 (s, 1H, Pyrrol-H), 7.68 (d, J = 8.8, 2H, Phenyl-H). 13C NMR (100 MHz, DMSO-d6) δ11.2, 106.8, 112.2, 113.0, 115.8, 116.7, 118.0, 119.8, 122.4, 124.8, 125.5, 127.0, 132.7, 136.9, 138.1, 145.1, 150.2, 150.6, 157.7, 158.5. HRMS (EI) m/z calcd for C18H18BF2N3S (M+) 417.1823, found 417.1827.
Fluorescence Measurement Using Aβ(1–42) and Bovine Serum Albumin
A solid form of Aβ(1–42) was purchased from Peptide Institute (Osaka, Japan). Aggregation was carried out by gently dissolving the peptide (0.25 mg/mL) in phosphate-buffered saline (PBS) (pH 7.4). The solution was incubated at 37°C for 42 hours with gentle and constant shaking. A mixture (10% EtOH) containing BAPs (10 μM) and Aβ(1–42) aggregates (0, 5, and 10 μM) or bovine serum albumin (BSA) (45 mg/mL) was incubated at room temperature for 30 minutes. After incubation, fluorescence emission spectra of BAP-2, BAP-3, BAP-4, and BAP-5 were collected with excitation at 656, 671, 643, and 654 nm (Infinite M200PRO, TECAN).
Measurement of the Constant for Binding of Aβ Aggregates In Vitro
A mixture (100 μL of 10% EtOH) containing BAP-2, BAP-3, BAP-4, and BAP-5 (final concentration 0–3.75 μM) and Aβ(1–42) aggregates (final concentration 2.2 μM) was incubated at room temperature for 30 minutes. Fluorescence intensity at 707 nm for BAP-2, 729 nm for BAP-3, 705 nm for BAP-4, and 709 nm for BAP-5 was recorded (excitation: 656, 671, 643, and 654 nm, respectively). The Kd binding curve was generated by Prism 4.0 software.
In Vitro Fluorescent Staining of Mouse Brain Sections
The experiments with animals were conducted in accordance with our institutional guidelines and approved by the Kyoto University Animal Care Committee. A Tg2576 transgenic mouse (female, 28 months old) was used as the AD model. After the animal was sacrificed by decapitation, the brain was removed and sliced into serial sections 10 μm thick. Each slide was incubated with a 50% EtOH solution (100 μM) of BAP-2, BAP-3, BAP-4, and BAP-5 for 10 minutes. For blocking experiments, the brain sections were incubated with BAP-2 (10 μM) in the presence of AV-45 (100 μM). The sections were washed in 50% EtOH for 1 minute two times and examined using a microscope (BIOREVO BZ-9000, Keyence Corp., Osaka, Japan) equipped with a Cy5 for BAP-2, a Cy5.5 for BAP-3 and BAP-4, and a BAP-5 filter set. Thereafter, the serial sections were also stained with thioflavin S, a pathologic dye commonly used for staining Aβ plaques in the brain, and examined using a microscope equipped with a GFP filter set.
Ex Vivo Imaging of Brains from Normal Mice
A mixed solution consisting of 20% DMSO and 80% propylene glycol (100 μL) of BAP-2, BAP-4, and BAP-5 (500 μM) was injected intravenously directly into the tail of ddY mice (5 weeks old). The mice (n = 4–5 for each time point) were sacrificed at 2, 10, 30, and 60 minutes postinjection. The brain was removed and weighed, and fluorescence images of brains were acquired with an IVIS Spectrum imaging system (Caliper Life Sciences Inc., Hopkinton, MA) with a 0.1-second exposure (f-stop = 2) and a customized filter set (excitation, 640 nm; emission, 700 nm). The fluorescence intensity in each region of interest covering an entire tissue was expressed as p/s/cm2/sr after the subtraction of background signals obtained in a region of interest set over an area without any tissue.
Ex Vivo Imaging of a Brain Slice from Tg2576 Mouse
A 25-month-old Tg2576 mouse and a 23-month-old wild-type mouse were intravenously injected with 100 μL of BAP-2 (500 μM, 20% DMSO, 80% propylene glycol). After 2 hours, the mice were sacrificed and the brain was removed. Fluorescence images of the brain were acquired with an IVIS Spectrum imaging system with a 0.1-second exposure (f-stop = 2) and a customized filter set (excitation, 640 nm; emission, 700 nm). Thereafter, the brain was frozen in powdered dry ice. The frozen blocks were sliced into serial sections, 20 μm thick, and examined using a microscope equipped with a Cy5 filter set. After being immersed in 50% EtOH for 15 minutes, the same sections were stained with thioflavin S and observed with a GFP filter set.
Results and Discussion
Chemistry
The synthesis of the BAPs (BAP-2, BAP-3, BAP-4, and BAP-5) is outlined in Figure 2. The formation of the BODIPY backbone (1) was accomplished by a previously reported method. 38 The dimethylamino derivatives 2 and 3 were produced by a one-pot process. 42 6 and 7 were synthesized by the Suzuki coupling reaction of 4-bromo-N,N-dimethylaniline with 5-formyl-2-thiophene boronic acid and 5-formyl-2-furan boronic acid. 4, 5, 8, and 9 (BAP-2, BAP-3, BAP-4, and BAP-5) were successfully prepared by the condensation of 1 and aldehyde derivatives in the presence of piperidine and acetic acid (5.6%, 29.2%, 10.9%, and 38.9% yields, respectively).

Synthetic route for BAPs.a aReagents: (a) CHCl3, POCl3, BF3OEt2, Et3N; (b) H2O, dimethylamine; (c) toluene, 1, piperidine, AcOH; (d) dioxane, Pd(PPh3)4, Na2SO3.
Fluorescence Properties
First, we evaluated fluorescent properties. The BAPs exhibited absorption, excitation, and emission wavelengths of 623 to 665 nm, 636 to 663 nm, and 704 to 723 nm, respectively, with a good quantum yield (4.3–11.4%) in CHCl3 (Table 1 and Figure 3). These results suggest that the new BODIPY derivatives have better properties than BAP-1, indicating that they may enable clearer Aβ imaging. Furthermore, in a solution containing Aβ aggregates, their fluorescence intensity increased with the concentration of the aggregates, indicating affinity for Aβ aggregates (Figure 4). Conversely, we found no significant change in fluorescence during the incubation with BSA, indicating that there is little interaction between BAPs and BSA. Although BAPs had very high quantum yields, they demonstrated weak fluorescence spectra. We think that the major reason for the weak signal is the difference of solvent. To evaluate the affinity for Aβ aggregates, we measured the apparent binding constant (Kd) by conducting a saturation assay (Table 2). The Kd values estimated for BAP-2, BAP-3, BAP-4, and BAP-5 were 55, 149, 27, and 18 nM, respectively, suggesting high affinity for Aβ(1–42) aggregates. These values were in the same range as the Kd of BAP-1 (44.1 nM), reported previously. 38 Furthermore, compared to the other Aβ probes reported previously, their affinity was higher than that of AOI-987 (Kd = 220 nM) 21 and similar to that of CRANAD-2 (Kd = 38.9 nM) 26 and THK-265 (Kd = 97 nM). 24
Fluorescence Characterization of BAPs*
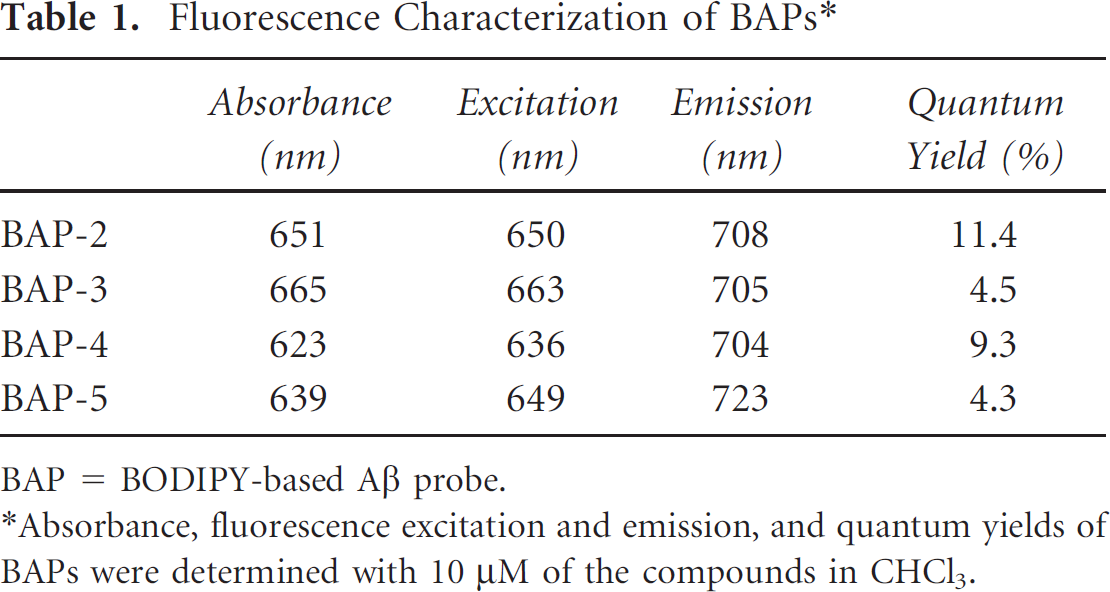
BAP = BODIPY-based Aβ probe.
Absorbance, fluorescence excitation and emission, and quantum yields of BAPs were determined with 10 μM of the compounds in CHCl3.
Apparent Binding Constant (Kd) of BAP-2, BAP-3, BAP-4, and BAP-5

BAP = BODIPY-based Aβ probe.
Values are the mean ± standard error of the mean for two independent experiments done in triplicate.

Excitation (blue line) and emission (red line) spectra of BAP-2 (A), BAP-3 (B), BAP-4 (C), and BAP-5 (D).

Fluorescence intensity of BAPs on interaction with Aβ(1–42) aggregates and BSA. A, B, C, and D show the fluorescent spectra of BAP-2, BAP-3, BAP-4, and BAP-5, respectively.
Neuropathologic Staining of Mouse Brain Sections
To confirm the affinity of BAPs for Aβ plaques in the mouse brain, neuropathologic fluorescent staining with BAP-2, BAP-3, BAP-4, and BAP-5 was carried out using brain sections from Tg2576 mice (Figure 5). Tg2576 mice are specifically engineered to overproduce Aβ plaques in the brain. Therefore, they have been frequently used to evaluate the specific binding of Aβ plaques in experiments in vitro and in vivo.5,12,14,43 BAP-2, BAP-3, BAP-4, and BAP-5 clearly stained the plaques, as reflected by the high affinity for Aβ aggregates in in vitro binding assays. The staining pattern was consistent with that observed with thioflavin S, a dye commonly used to stain Aβ plaques. The results suggest that these compounds show specific binding to Aβ plaques in the mouse brain. Furthermore, the fluorescent staining with BAP-2 (see Figure 5A) could be blocked to a large extent with an excess of the cold AV-45 (see Figure 5I), confirming the specific binding of BAP-2 to Aβ plaques.

Neuropathologic staining of BAP-2, BAP-3, BAP-4, and BAP-5 (A, C, E, and G) in 10 μm sections from Tg2576 mice. Labeled plaques were confirmed by staining of the adjacent sections with thioflavin S (B, D, F, and H). Blocking of specific staining was performed with excess of cold AV-45 (100 μM) (I).
Biodistribution Experiments
To test the uptake into and washout from the brain, we determined the fluorescence intensity in the brain after the injection of BAP-2, BAP-4, and BAP-5 into a normal mouse except BAP-3, which showed lower binding to Aβ aggregates than any other probe (Figure 6). Given that BAPs emit weak fluorescence even when they do not bind to Aβ plaques, they showed a fluorescence signal even in the brains of normal mice. All three compounds penetrated the blood-brain barrier. Notably, BAP-2 showed high initial uptake at 2 minutes postinjection, and thereafter, the fluorescence that accumulated in the brain was rapidly eliminated. Conversely, BAP-4 and BAP-5 persisted in the brain. Given that normal brain tissue has no Aβ plaques to trap the agent, washout from the brain should be fast, providing a higher signal to noise ratio in the AD brain. These results suggest that BAP-2 has the most highly desirable properties for Aβ imaging probes among the BAPs in this report. Consequently, we selected BAP-2 for further characterization in vivo.
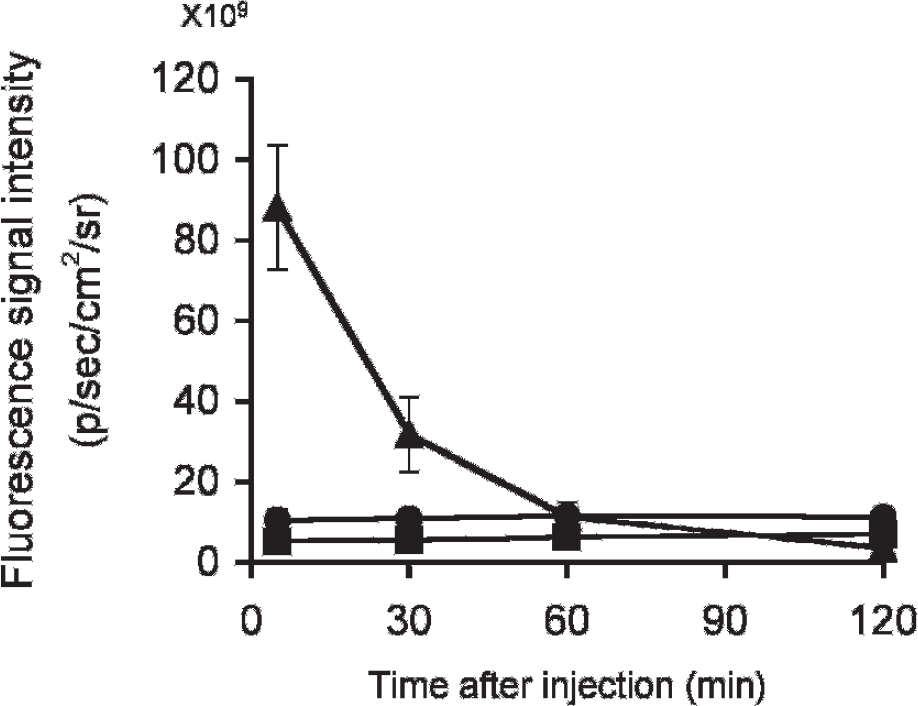
Fluorescence intensity after injection of (▴) BAP-2, (▪) BAP-4, and (•) BAP-5 into ddY mice with the IVIS Spectrum.
Ex Vivo Imaging of Tg2576 Mouse Brain and Wild-Type Mouse Brain
To evaluate the potential of BAP-2 in living brain tissue, we carried out experiments ex vivo using a Tg2576 mouse (25-month-old female) and a wild-type mouse (23-month-old female). The fluorescence in whole brains removed at 2 hours postinjection of BAP-2 was much higher in the Tg2576 mouse than in the wild-type mouse (Figure 7). To confirm the presence of BAP-2, we prepared frozen sections from both brains and observed them with a fluorescence microscope. The brain sections from the Tg2576 mouse showed distinctive staining of Aβ plaques by BAP-2, whereas those from the wild-type mouse showed no such staining (Figure 8). Aβ plaques were confirmed to be present by staining the sections with thioflavin S. The results suggest that BAP-2 penetrated the blood-brain barrier and selectively labeled the Aβ plaques in the mouse brain, as reflected by the biodistribution experiments and in vitro binding assays. We carried out in vivo imaging experiments using Tg2576 mice and age-matched controls. The absorbance, excitation, and emission wavelengths of BAP-2 were suitable for NIRF imaging; however, we could not find a significant difference in fluorescence intensity between the two groups because BAP-2 showed higher accumulation in the scalp than in the brain in both groups. This may be attributable to the marked binding of BAP-2 to lipids in the scalp because it is well known that some BODIPY derivatives can serve as a lipid-staining agent. 44 This also indicates that in vivo imaging is feasible using new NIR compounds with a low affinity for lipids. Therefore, appropriate structural modifications of BODIPY derivatives may lead to the development of more useful probes for the in vivo imaging of Aβ plaques in the brain. Furthermore, if we can obtain three-dimensional images with fluorescence imaging systems such as IVIS Spectrum CT, the problem observed in in vivo imaging with BAP-2 will be resolved. As we mentioned at the beginning, in principle, a good NIRF probe for Aβ plaques should have the following properties: (1) a suitable wavelength of absorption, excitation, and emission (> 650 nm); (2) the ability to rapidly enter the brain after intravenous injection; (3) specific labeling of the Aβ plaques with rapid clearing of the unbound dye; and (4) on binding to Aβ plaques, it should significantly change its fluorescence properties. BAP-2 fulfilled these prerequisites as an in vivo optical imaging probe targeting Aβ plaques, whereas few reported probes have satisfied these criteria.

Comparison of the fluorescence intensity in the brain after injection of BAP-2 into a Tg2576 mouse (A) and a wild-type mouse (B).

Ex vivo fluorescence observation of brain sections from a Tg2576 mouse (A) and a wild-type mouse (B) after injection of BAP-2. The presence of Aβ plaques in the section from Tg2576 mouse was confirmed with thioflavin S (C).
Conclusion
We successfully designed and synthesized novel BAPs for NIRF imaging in vivo. In binding experiments in vitro, BAP-2, BAP-3, BAP-4, and BAP-5 showed high affinity for Aβ aggregates. These compounds clearly stained Aβ plaques in the mouse brain, reflecting their affinity for Aβ aggregates in vitro. In biodistribution experiments using normal mice, BAP-2, BAP-4, and BAP-5 displayed good uptake into the brain. In addition, ex vivo fluorescent staining of brain sections from Tg2576 mice after the injection of BAP-2 showed selective binding of Aβ plaques with little nonspecific binding. These findings suggest that further optimization of BAPs leads to the development of NIRF imaging probes for the detection of Aβ plaques and the drug screening for AD.
Footnotes
Acknowledgment
Financial disclosure of authors: This research was granted by the Japan Society for the Promotion of Science (JSPS) through the Funding Program for Next Generation World-Leading Researchers (NEXT Program), initiated by the Council for Science and Technology Policy (CSTP) and the JSPS Research Fellowships for Young Scientists.
Financial disclosure of reviewers: None reported.