
Abstract
It has been known for a long time that the melanin pigments present in normal skin, hair, and most of malignant melanomas can be detected by electron paramagnetic resonance (EPR) spectrometry. In this study, we used EPR imaging as a tool to map the concentration of melanin inside ex vivo human pigmented and nonpigmented melanomas and correlated this cartography with anatomopathology. We obtained accurate mappings of the melanin inside pigmented human melanoma samples. The signal intensity observed on the EPR images correlated with the concentration of melanin within the tumors, visible on the histologic sections. In contrast, no EPR signal coming from melanin was observed from nonpigmented melanomas, therefore demonstrating the absence of EPR-detectable pigments inside these particular cases of skin cancer and the importance of pigmentation for further EPR imaging studies on melanoma.
MALIGNANT MELANOMA is a tumor characterized by the uncontrolled proliferation of melanocytes, mainly in skin but also in eyes and very rarely in several other locations, such as the oral cavity, esophagus, or rectum. Melanocytes get their name from the dark pigment produced within these cells: melanin (from the Greek melas meaning “dark”); the name is generally attributed to the German chemist Berzelius. 1 Therefore, melanomas generally reveal a strong pigmentation linked to a high concentration of melanin present inside the tumor melanocytes.2,3 Nevertheless, 2 to 8% of melanomas diagnosed contain a very low concentration or absence of melanin and are called nonpigmented or amelanotic. 4
It has been known since the the mid-1950s that melanin, due to the presence of stable free semiquinone-type radicals within its structure, can be detected using the electron paramagnetic resonance (EPR) method, 5 a technique similar to nuclear magnetic resonance in which electron spins are detected instead of nuclear spins. 6 The results of Commoner and colleagues 5 were confirmed a few years later by Mason and colleagues, who observed that melanin from different origins provided very similar EPR signals. 7 Works especially dedicated to the study of melanin demonstrated that EPR signals of the two major types of melanin, eumelanin and pheomelanin, were slightly different and that the amplitude of these EPR signals could be used to quantify the proportion of the two pigments inside biologic samples, including malignant melanoma. 8 This principle was further confirmed by comparison with high-performance liquid chromatography, 9 and the ability to use the EPR method to quantify melanin on the grounds of the amplitude of its spectrum was demonstrated.10,11 Furthermore, we recently found a correlation between the EPR signal of melanin coming from experimental melanomas and the growth stage of the tumors. 12 As a complement to these results, the limit of detection of melanin and melanoma tissue measurable with our EPR method and device was assessed. The method was proven to be sensitive as a quantity of 2 μg of eumelanin could already be detected.
In addition to these studies, numerous other studies focused on proving that paraffin-embedded melanomas, 13 frozen melanomas,14,15 and in situ melanomas 16 can provide a detectable EPR signal. In the same way, the first images representing the mapping of melanin pigments were obtained inside ex vivo human 17 and in vivo experimental melanoma 18 by using the molecular EPR imaging technique.19,20
Recently, we investigated the ability to detect and map by EPR imaging the melanin pigments present inside human ex vivo melanomas at various growth stages, from T1 to T4 according to the American Joint Committee on Cancer (2009). 21 The main objective of this previous work was to determine the level of accuracy and the detection limit of EPR imaging when applied to melanin-containing samples such as human melanoma. As expected, the EPR signal was more intense in higher-grade (T4 and T3) than in lower-grade (T2 and T1) tumors, and the possibility for EPR to obtain quality images was related to the signal to noise ratio (SNR) of the spectra obtained from the samples. 22
To date, the ability of EPR spectroscopy and imaging to classify melanomas according to the quantity and quality (eu- or pheomelanin) of their pigmentation has not been investigated. In the present study, we compared high-grade pigmented and nonpigmented human melanomas by EPR spectrometry and imaging to prove the importance of pigmentation for visualization of tumors by EPR imaging. The resulting images were compared to histologic sections to confirm the presence or absence of pigments inside the samples with the purpose of establishing (or not) a correlation between high-pigmented areas on histologic sections and high-intensity areas on EPR images. Moreover, the analysis of the EPR spectra obtained from every sample allowed us to determine the presence or absence of eu- and pheomelanin within pigmented and nonpigmented samples. This study should therefore shed light on the ability of EPR imaging to help in the characterization of the pigmentation and assessment of the size of human melanomas.
Materials and Methods
All experiments were approved by the local ethics committee (N/ref. 2010/12AVR/120 – No. B40320108558).
Melanoma Samples
Six paraffin-embedded human melanoma samples were provided by the Department of Histopathology, Royal Surrey County Hospital, Guildford, or the Oncology and Experimental Surgery and Laboratory from Bordet Institute, Universite Libre de Bruxelles. Before excision, they were located in the axilla, the groin, or the chest wall of patients, males and females, with ages ranging from 53 to 85 years. The samples were classified as highly pigmented (n = 3) or nonpigmented (n = 3) on the basis of the histologic findings.
A 500 μm thick slice was cut from each melanoma. Each of the six slices was then cut into two or three parts, considering the size of the slice. The division of the samples into two or three parts was necessary due to the small size of the X-band EPR cavity used for the EPR imaging measurement (see below). Measurements of the dimensions of each part were achieved using a caliper. Each part was then placed into a quartz tube and measured separately.
EPR Measurements
All spectra and images were recorded at room temperature on a Bruker E540 Elexsys system (Bruker Biospin, GmBh, Rheinstetten, Germany) equipped with a Super High Sensitivity Probe (Bruker Biospin) (10 mm diameter, 30 mm long) operating in X-band mode at approximately 9.5 GHz and 100 kHz modulation frequency. Parameters were determined to provide the best SNR, with no distortion of the signal shape, and to keep a more proportional acquisition time than in previous studies, 22 considering the higher field of view required for larger samples. For images, the following parameters were used: microwave power: 3.2 mW; modulation amplitude: 0.25 mT; conversion time: 10.24 ms; time constant: 5.12 ms; field of view: 23 mm; sweep width: 182 G; number of points: 1,024; number of scans: 5; sweep time: 10.49 s; gradient field: 450 mT/m; number of projections: 29; pixel size: 0.6 mm; total acquisition time: 32.5 min. The spectra were acquired in the same conditions, in the absence of gradient field. Two-dimensional images were reconstructed on a 128 × 128 matrix by filtered backprojection using a Shepp-Logan filter. Before reconstruction, each projection was deconvoluted using fast Fourier transform with the measured zero-gradient spectrum to improve image resolution. To reduce noise amplification and avoid possible division by zero at high frequencies, a low-pass filter was used. The deconvolution parameters, including the maximum cutoff frequency and the width of the window in the Fourier space, were set up after viewing the shape of all projections. Data were smoothed using a gaussian filter. Spectral deconvolution and filtered backprojection were performed using the Xepr software package (Bruker). The dimensions of the samples on EPR images were measured using a dedicated application in the Bruker Elexsys software. For each image, a reference spectrum was obtained at the same parameters so that the SNR could be measured.
Reconstruction of the complete images of the samples was performed by connecting the image of each part with the image(s) of the contiguous part(s) and adjusting the superior and inferior limits of the different images for adequate positioning. The intensity scale of each partial image was previously balanced with the scale of the other images coming from the same sample. The general shape of the images and the distribution of intensity within the images were finally set against their respective melanoma samples and the pigmentation distribution visible on histologic sections.
The values on the intensity scales of the EPR images are arbitrary units because they depend on both the free radical concentration and the parameters chosen.
Histology
For each sample, a 5 μm thick section, contiguous to the 500 μm thick section used for EPR, was processed for histology (hematoxylin-eosin staining). The histologic sections were then scanned with a Zeiss Mirax microscope.
Results
The three parts composing each of the pigmented samples (P1, P2, and P3) were first measured using EPR spectrometry and imaging. P1, P2, and P3 are shown in Figure 1A, Figure 2A, and Figure 3A, respectively. Their respective EPR images, reconstructed from the partial images, are presented in Figure 1B, Figure 2B, and Figure 3B. The histologic sections are presented in Figure 1C, Figure 2C, and Figure 3C. The white lines indicate the way the samples were cut before the measurements.
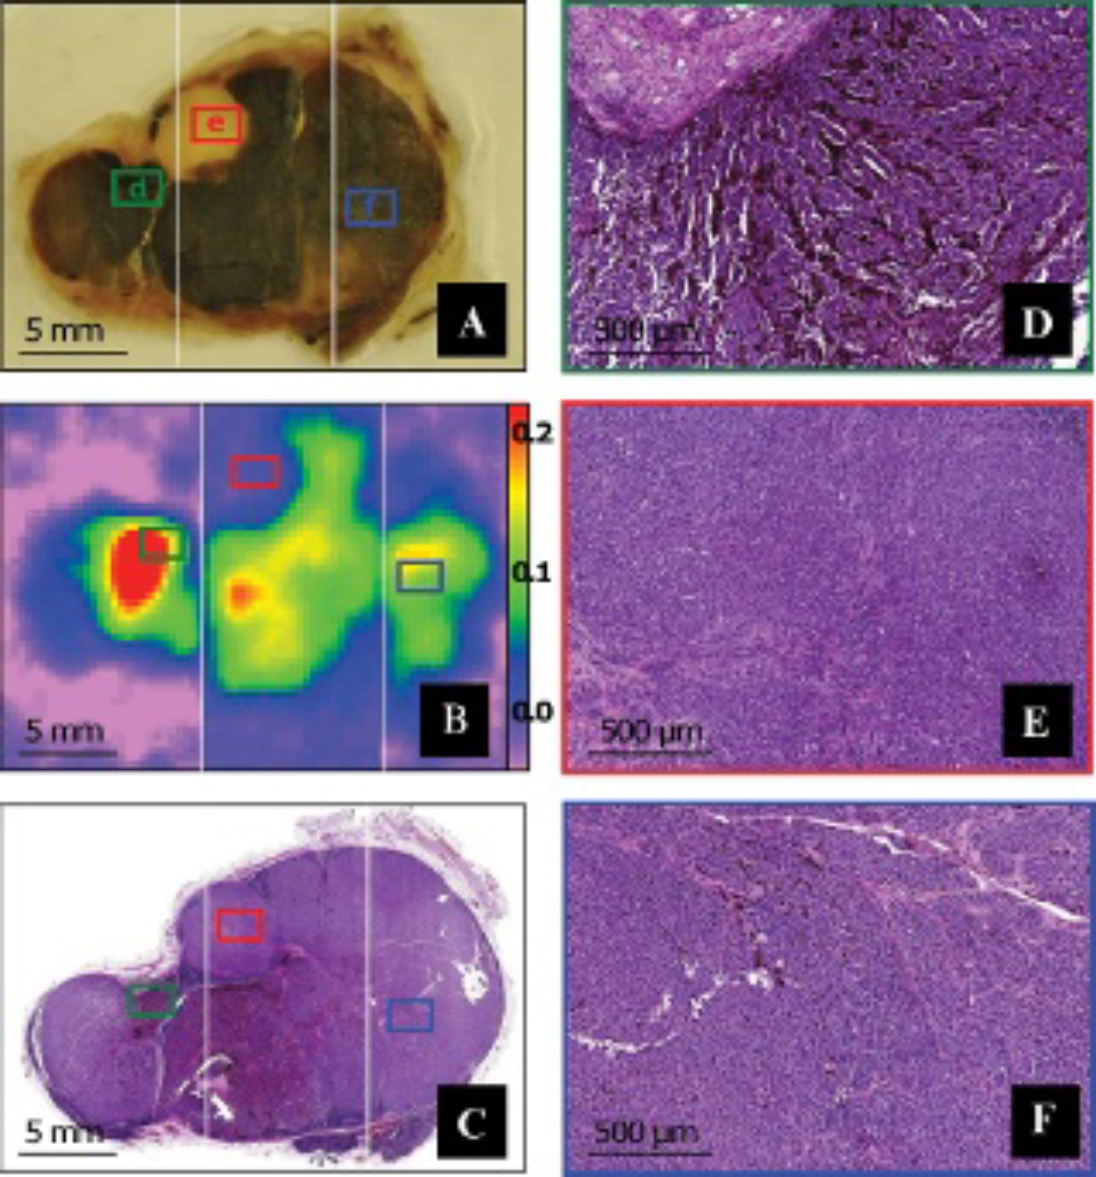
Pigmented human melanoma sample P1. The 500 μm thick slice of this sample was cut into three parts following the white lines drawn on the figure (A). The three parts were measured by electron paramagnetic resonance (EPR) imaging and the images were joined to reconstruct the total image of the sample (B). A 5 μm thick histologic section adjoining the sample was cut (C) and used to correlate the pigmentation to the EPR intensity, especially on three selected areas: a highly pigmented area (D), a nonpigmented area (E), and a moderately pigmented area (F).

Pigmented human melanoma sample P2. The 500 μm thick slice of this sample was cut into three parts following the white lines drawn on the figure (A). The three parts were measured by electron paramagnetic resonance (EPR) imaging and the images were joined to reconstruct the total image of the sample (B). A 5 μm thick histologic section adjoining the sample was cut (C) and used to correlate the pigmentation to the EPR intensity, especially on two selected areas: a highly pigmented area (D) and a nonpigmented area (E).

Pigmented human melanoma sample P3. The 500 μm thick slice of this sample was cut into three parts following the white lines drawn on the figure (A). The three parts were measured by electron paramagnetic resonance (EPR) imaging and the images were joined to reconstruct the total image of the sample (B). A 5 μm thick histologic section adjoining the sample was cut (C) and used to correlate the pigmentation to the EPR intensity, especially on two selected areas: a highly pigmented area (D) and an area positioned on the frontier between a pigmented part and a nonpigmented part of the tumor (E).
Globally, each part of the pigmented samples allowed the successful acquisition of an EPR image. All EPR images closely reflected the shape and size of their respective samples. Accurate measurements of the dimensions showed a mean difference of 1.15% between the samples and their respective images. For the three samples, the EPR intensity in a given area was unambiguously correlated to the presence or absence of melanin pigments. To illustrate this observation, three different areas were selected on sample P1 on the basis of the concentration of melanin visible on the histologic section. A highly pigmented area was found on the left part of the sample and is presented in Figure 1D. A totally nonpigmented area was found in the upper side of the middle part and is presented in Figure 1E. Finally, a moderately pigmented area was taken from the right part of the sample and is presented in Figure 1F. On the EPR image, these three areas were linked to three areas with highly different intensities, the nonpigmented area being impossible to distinguish from the background and the highly pigmented area exhibiting the strongest intensity. In the same way, two areas were selected from sample P2 (Figure 2, D and E) and two more from sample P3 (Figure 3, D and E). Comparison between the presence or absence of melanin within these four supplementary areas and the EPR intensities measured on the images was successful as well. Whereas nonpigmented areas, such as those shown in Figure 2E and the left part of Figure 3E, provided a low or null EPR signal, highly pigmented areas, such as those shown in Figure 2D, Figure 3D, and the right part of Figure 3E, exhibited a strong EPR signal.
The different parts composing the three nonpigmented melanoma samples (NP1, NP2, and NP3) were then measured. Histologic sections performed on these samples are shown in Figure 4, A, B, and C, along with a focus on random areas demonstrating the absence of melanin pigments within the tissues (Figure 4, D, E, and F). It was impossible to acquire an EPR image of these samples because, in EPR spectrometry, they provided no signal or one that was too weak. As an illustration of this absence of distinct signal, the EPR spectra coming from each sample (obtained after summing the spectra of all parts of a sample) are shown in Figure 4G, along with the spectrum of the less intense sample among the pigmented samples (P3, gray spectrum), serving as a reference. The SNR of the spectrum of P3 was measured at 33, whereas it ranged from 0 to 2 for the three non- or low-pigmented melanomas.

Nonpigmented human melanoma samples NP1, NP2, and NP3. The 500 μm thick samples (not shown) used for electron paramagnetic resonance (EPR) were cut into two or three main parts following the white lines visible on the histologic sections (A, B, and C, respectively). The 5 μm thick histologic sections were cut contiguously to the 500 μm thick slice used for EPR measurements and demonstrated the absence of melanin pigments, as shown in the magnifications presented in D, E, and F. No EPR image could be successfully acquired from the nonpigmented samples because the signal to noise ratio was too low (< 2), as shown in G. The spectra coming from NP1 (green), NP2 (blue), and NP3 (pink) are presented with, as a reference, the spectrum of sample P3 (gray).
Discussion
Our study highlights the importance of the presence of melanin pigment for the detection and characterization of melanoma by EPR spectrometry and imaging. Indeed, nonpigmented tumors or nonpigmented areas inside melanomas (as characterized by histology) were invisible on EPR images. In contrast, areas determined by microscopy as highly pigmented provided more intense EPR signal that was easily discernible from the background. It must be noted that sample NP3, which exhibited the highest EPR signal (the pink spectrum on Figure 4G) among the three nonpigmented tumors, was shown to contain a very small amount of melanin in its peripheral area. This was, however, insufficient to allow the acquisition of an EPR image. These results confirmed results obtained in a previous study in which pigmented (B16F10 melanoma) and nonpigmented (KHT sarcoma) experimental tumors were measured by EPR spectrometry. 12
Our pigmented samples displayed EPR signals characterized by a different eumelanin to pheomelanin ratio. According to the method described by Sealy and colleagues, 8 this ratio provided an estimation of the ratio between the concentration in eumelanin and the concentration in pheomelanin. It was calculated at 0.80, 2.50, and 0.55 for samples P1, P2, and P3, respectively. Although the generally accepted theory states that eumelanin is the main pigment present in malignant melanomas due to the overexpression of the tyrosinase gene, the key gene in eumelanogenesis,23,24 our results demonstrate that pheomelanin might be present in a variable concentration from one human sample to another, which was already observed in other studies.25,26
Conversely, melanomas that are roughly called “nonpigmented” in the field of dermatology often contain a small quantity of melanin pigments. 27 These pigments have never been characterized as eu- or pheomelanin. However, the presence of pheomelanin seems to be the most plausible. Indeed, although the causes of hypomelanosis remain obscure, it was demonstrated for different experimental models that this phenomenon could be associated with mutations on different key genes of melanogenesis that lead to the downregulation of the tyrosinase activity,28–30 with, as a consequence, a strong or total decrease in eumelanogenesis. 31
In contrast, pheomelanogenesis does not require high tyrosinase activity to occur. Indeed, it was demonstrated that the downregulation of tyrosinase resulted in increased pheomelanogenesis.28,32 However, our study did not allow us to confirm this hypothesis because the three nonpigmented samples measured exhibited neither the eumelanin nor the pheomelanin typical signal. These samples were consequently found to be totally amelanotic, as confirmed by anatomopathology.
Finally, the quality of EPR images obtained from pigmented samples in our study was never achieved before. Although a minor bias could have been introduced during the positioning of the partial images as no reference mark was used, the shape and dimensions of the samples were accurately met on the images, with a mean difference below 2% of the sample size. Compared to previous EPR imaging results obtained on human samples at different invasion stages, 22 the images obtained in our study are clearer, the dimensions correspond better, and the distribution of melanin is reflected more accurately. This better quality was undoubtedly linked to the higher concentration of melanin inside the tumors. Indeed, although the samples were chosen randomly among the different growth stages without considering the pigmentation in the previous study—late-stage melanomas were, however, significantly more pigmented than early-stage tumors—they were explicitly selected on that criterion.
Conclusion
The importance of pigmentation for EPR measurement was unambiguously demonstrated in our study. Moreover, EPR images accurately reflected the distribution of melanin pigments within melanoma samples. These results are very encouraging for further studies. Technical limitations preclude for the moment the use of this technique with ex vivo samples. 22 However, the possibility to use this technique for melanoma characterization in vivo 18 or in the clinic33,34 exists, and it seems evident that EPR spectrometry and imaging may play a role in the field of melanoma research in the future.
Footnotes
Acknowledgment
Financial disclosure of authors: This work was supported by grants from the Belgian National Fund for Scientific Research, Televie, Fonds Joseph Maisin, Actions de Recherches Concertées-Communauté Française de Belgique-ARC 09 /14-020, and Fondation contre le cancer.
Financial disclosure of reviewers: None reported.