
Abstract
Transplantation of neural stem cells (NSCs) has been proposed as a treatment for Parkinson disease (PD). The aim of this study was to monitor the viability of transplanted NSCs expressing the enhanced luciferase gene in a mouse model of PD in vivo. The PD animal model was induced by unilateral injection of 6-hydroxydopamine (6-OHDA). The behavioral test using apomorphine-induced rotation and positron emission tomography with [18F]N-(3-fluoropropyl)-2′-carbomethoxy-3′-(4-iodophenyl)nortropane ([18F]FP-CIT) were conducted. HB1.F3 cells transduced with an enhanced firefly luciferase retroviral vector (F3-effLuc cells) were transplanted into the right striatum. In vivo bioluminescence imaging was repeated for 2 weeks. Four weeks after transplantation, [18F]FP-CIT PET and the rotation test were repeated. All 6-OHDA-injected mice showed markedly decreased [18F]FP-CIT uptake in the right striatum. Transplanted F3-effLuc cells were visualized on the right side of the brain in all mice by bioluminescence imaging. The bioluminescence intensity of the transplanted F3-effLuc cells gradually decreased until it was undetectable by 10 days. The behavioral test showed that stem cell transplantation attenuated the motor symptoms of PD. No significant change was found in [18F]FP-CIT imaging after cell transplantation. We successfully established an in vivo bioluminescence imaging system for the detection of transplanted NSCs in a mouse model of PD. NSC transplantation induced behavioral improvement in PD model mice.
PARKINSON DISEASE (PD) is one of the most common neurodegenerative disorders and is caused by extensive loss of dopaminergic neurons in the substantia nigra. 1 PD is characterized by general motor symptoms such as rigidity, tremor, and bradykinesia. Current treatment options for PD include levodopa, enzyme inhibitors, and deep brain stimulation, all of which provide symptomatic relief but not reversal of disease progression.2–4
Cell-based therapy, which is thought to have the ability to help in recovery from brain injury, has been proposed as a long-term treatment for PD. In early work on cell-based therapy, fetal ventral mesencephalic (VM) dopaminergic neurons were introduced into the striatum as an experimental treatment. 5 Clinical trials have shown mixed effects with side effects, including off-therapy dyskinesia.6–9 Problems with availability and difficulties in standardizing the VM cells emphasized the need for new sources of cell-based therapy. Such potential new sources of cell-based therapy include embryonic stem cells,10,11 neural stem cells (NSCs), 12 and induced pluripotent stem cells. 13 These cells can be obtained in large amounts from sources in vitro; they also have the potential to generate neuronal cells and have elicited variable degrees of functional recovery in animal experiments.10–13
Transplantation of NSCs is usually favored in terms of a lower risk of tumor formation. 2 The HB1.F3 cell line is a stable and well-established human fetus-derived immortal NSC line that is generated from the human fetal telencephalon (at 15 weeks' gestation) using a retroviral vector encoding v-myc and has the potential to differentiate into cells of neuronal and glial lineages. 14 By transplantation of the cells, behavioral improvements have been reported in rodent and primate models of PD.15,16 Also, the cells showed the ability to differentiate into dopaminergic neuron in vivo. 16 Thus, we used HB1.F3 cells for treatment of a PD model in the present study.
Monitoring of transplanted cells is crucial for optimizing cell-based therapy in PD models. In previous studies of stem cells in PD models, transplanted cells were monitored ex vivo using immunohistochemistry after serially sacrificing animals.10–13,15 However, ex vivo monitoring has several critical limitations for monitoring transplanted stem cells. First, large numbers of animals must be sacrificed in each experiment, and laborious procedures have to be repeated at each time point. Second, animals sacrificed at each time point represent neither the whole treatment group nor the final outcome of stem cell treatment. Third, estimation of the precise survival duration of transplanted cells is impossible. Finally, the number of transplanted cells cannot be quantified.
To accurately determine the characteristics of transplanted stem cells in a PD model, the survival duration and/or distribution of transplanted stem cells need to be evaluated. Thus, imaging techniques capable of measuring the viability of transplanted stem cells in individual animals are required. In vivo imaging techniques such as positron emission tomography (PET), magnetic resonance imaging (MRI), fluorescence, and bioluminescence imaging (BLI) enable repeated measurements in a single animal as opposed to serial sacrifice of a large quantity of animals. However, the half-lives of most of the radioisotopes for PET imaging are shorter than a few hours or a few days at most (11C: 20 minutes; 68Ga: 68 minutes; 18F: 110 minutes; 64Cu: 12.7 hours; 124I: 4.2 days); thus, PET is not suitable for long-term monitoring of transplanted stem cells. Also, MRI cannot distinguish living cells from dead cells, and fluorescence imaging suffers from nonspecific autofluorescence. 17 Fluorescence dye with a near-infrared (NIR) window and fluorescence molecular tomography (FMT) can overcome an autofluorescence problem. Also, FMT could be a robust tool for quantification of optical signal. However, a relative lack of fluorescence protein with a NIR window to label the cell intrinsically is a remaining limitation for long-term observation of transplanted cells.18,19 Free of such limitations, BLI has been shown to be a robust tool for in vivo tracking of viable transplanted cells in recent experiments.20,21 Moreover, bioluminescence techniques enable real-time imaging, which facilitates the comparison of remaining cell numbers at specific time points and a more precise assessment of the duration of transplanted cell survival. Recently, an enhanced version of firefly luciferase was engineered using codon optimization for more sensitive detection of transplanted stem cells. 22 Thus, in vivo BLI with enhanced firefly luciferase can be a superior tool for evaluating transplanted cells in PD models.
Here we present an in vivo BLI system for the analysis of transplanted NSCs (HB1.F3) transduced with enhanced firefly luciferase (effLuc) and examined the survival duration of transplanted NSCs in a PD mouse model.
Materials and Methods
Animals and Experimental Design
Eight-week-old male C57Bl/6 mice (weight 20–30 g) were used according to the approved guidelines of the Institutional Animal Care and Use Committee of Seoul National University College of Medicine. The PD model was induced in 12 mice, and 3 mice were used as a control group. The PD model was validated by the apomorphine-induced rotation test and [18F]N-(3-fluoropropyl)-2′-carbomethoxy-3′-(4-iodophenyl)nortropane ([18F]FP-CIT) PET, known as dopamine transporter imaging. 23 After 4 weeks, seven PD mice and three control mice were treated with HB1.F3 cells transduced with an enhanced firefly luciferase retroviral vector (described below). The five remaining PD mice received sham (dead cell injection) treatment. In vivo BLI was repeated daily until the signal was no longer detectable. At the end of each experiment, mice underwent [18F]FP-CIT PET scanning and the apomorphine-induced rotation test, after which the mice were sacrificed (4 weeks after cell transplantation) and brain sections were prepared for immunohistochemical analysis. Additionally, three PD mice were sacrificed 4 days after cell transplantation to compare histologic findings to those 4 weeks after cell transplantation.
Preparation of Enhanced Firefly Luciferase-Transduced NSCs
Cells of HB1.F3, a human fetal telencephalon (at 15 weeks' gestation) -derived immortal NSC line, 14 were used for transplantation. For BLI, HB1.F3 cells were cotransfected with a retrovirus-mediated enhanced firefly luciferase (effLuc) vector (F3-effLuc), 22 gag-pol plasmid, and envelope plasmid using Lipofectamine Plus reagent (Invitrogen, CA). The effLuc construct (Figure 1A) was kindly provided by Dr. Brian Ravinovich (MD Anderson Cancer Center, Houston, TX). After 48 hours, the medium containing retroviruses was collected and filtered using 0.2 μm pore syringe filtration. For retroviral transduction, retroviruses were packaged using the Retro-X packaging system (BD Biosciences, NJ), and HB1.F3 cells were infected with retrovial supernatant in the presence of polybrene (Sigma-Aldrich Co., MO). Infected CD90.1-positive cells were collected by magnetic antibody cell sorting (Miltenyi Biotech Ltd., UK) using monoclonal anti-90.1 microbeads. CD90.1 is a reporter gene of effLuc vector. 20 F3-effluc cells were washed using fluorescence-activated cell sorting (FACS) buffer (phosphate-buffered saline [PBS] solution containing 5% fetal bovine serum [FBS]) using the phycoerythrin-labeled monoclonal anti CD90.1. The collected F3-effLuc cells after high centrifugation were resuspended with FACS buffer, and these cells were incubated for 30 minutes on ice. Cells were rinsed two times in FACS buffer and prepared in 0.4 mL FACS buffer. The purity of CD90.1-positive cells was identified by FACS (BD Immunocytometry System, CA) analysis.
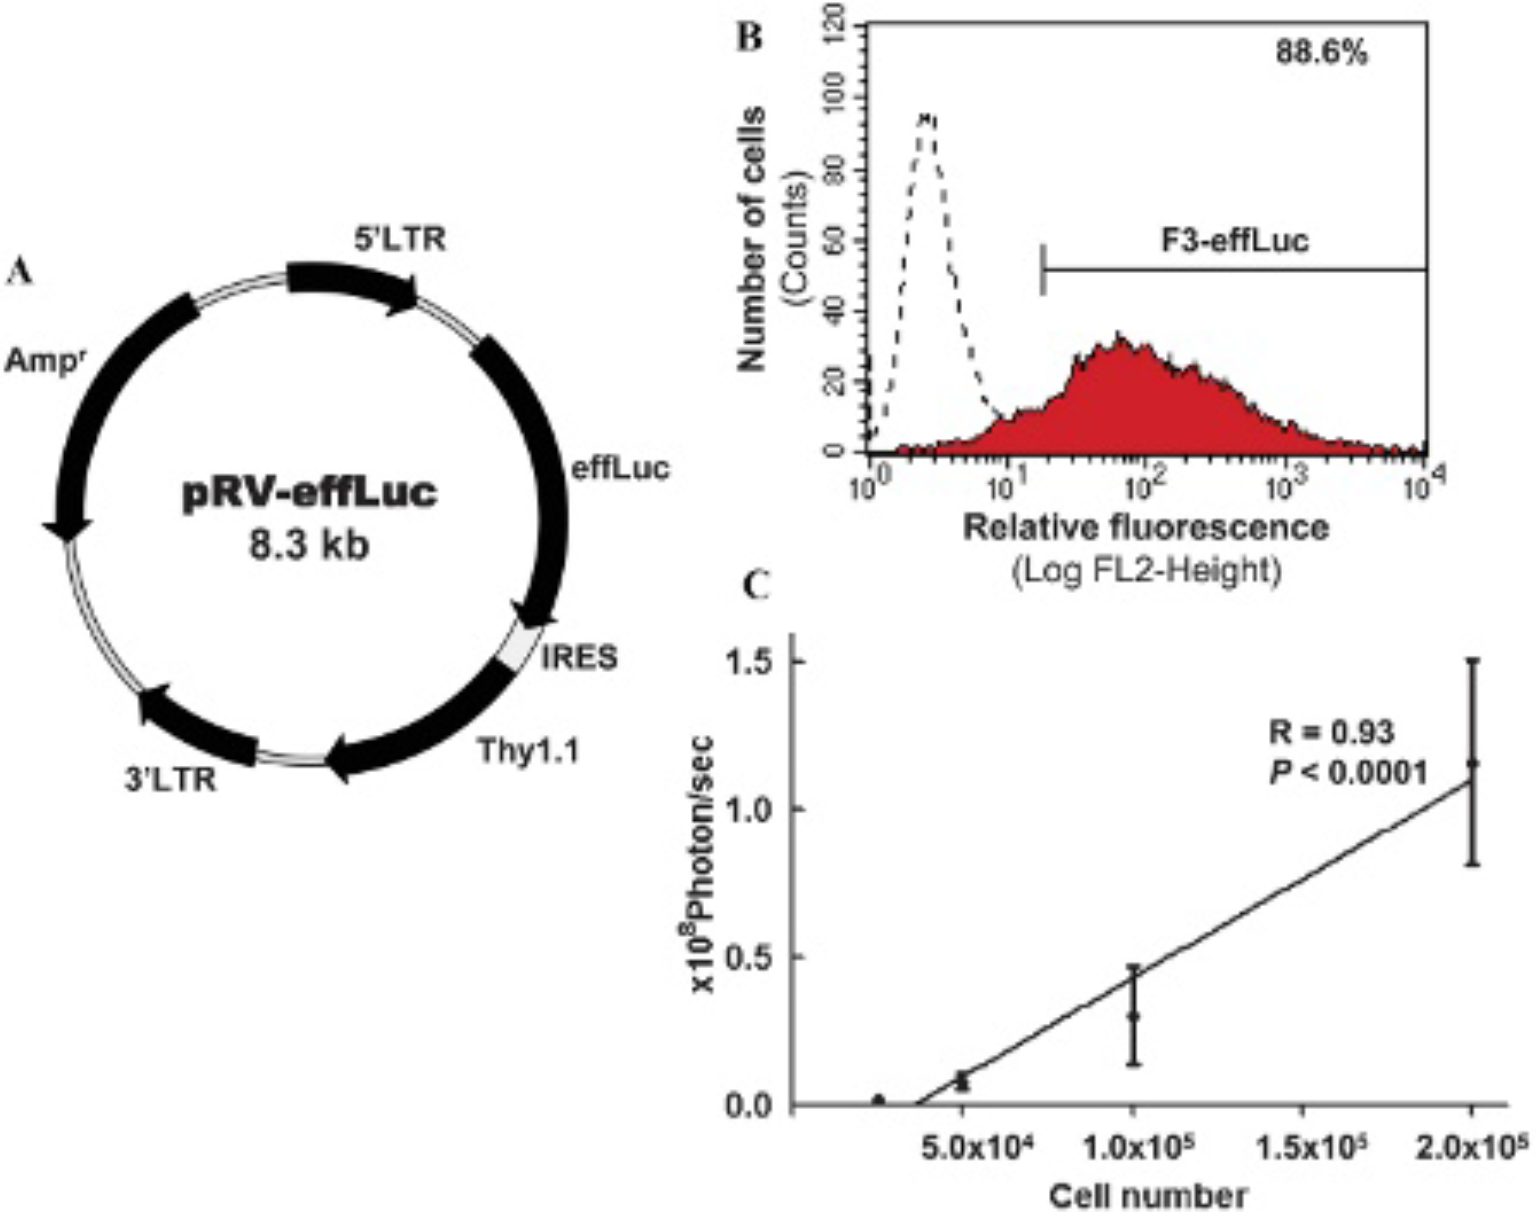
Representation of effLuc vector and identification and in vitro correlation analysis of F3-effLuc cells. A, Schematic illustration of the retroviral vector containing effLuc reporter gene and Thy1.1. The DNA construct of the retroviral vector included the codon-optimized effLuc gene and Thy1.1 (a specific marker) linked with an internal ribosomal entry site (IRES) under the control of a cytomegalovirus (CMV) promoter. The ampicillin resistance gene as a selectable marker is also contained in the pRV-effLuc retroviral vector. B, CD90.1-positive cells were identified by FACS analysis as 88.6%. C, Linear correlation between effLuc-transduced HB1.F3 cell numbers and bioluminescent intensity in vitro (r = .93, p < .0001).
Measurement of Luciferase Activity In Vitro
The cultured F3-effLuc cells were rinsed twice with PBS and treated with 4 mL trypsin-ethylenediaminetetraacetic acid (EDTA) in T75 flasks for 3 minutes in an incubator set at 37°C. To stop trypsin-EDTA activity, detached F3-effLuc cells were washed with serum-containing Dulbecco's Modified Eagle's Medium and PBS. Suspended F3-effLuc cells (3 × 10⁵) were serially diluted with PBS onto a 24-well plate. A D-luciferin substrate (50 μL at 3 μg/μL; Caliper Life Sciences, MA) was added to the F3-effLuc cells, and the solution was gently mixed. In vitro luciferase activity was monitored using a luminometer (TR717; Applied Biosystems, CA) with a 20-second exposure time.
Induction of PD Model
6-Hydroxydopamine (6-OHDA) was prepared at a concentration of 3 μg/mL saline in 0.2% ascorbic acid. Two microliters of 6-OHDA was injected into the right striatum (n = 12), at a rate of 0.5 μL/min, using a Hamilton syringe (26 gauge) and a stereotaxic apparatus (David Kopf, CA), as described by Iancu and colleagues. 24 Mice were anesthetized by intraperitoneal injection of Equithesin (3 mL/kg). To prevent oxidation of 6-OHDA before injection, 6-OHDA was stored in a dark and cool place. Injections were administered in the right striatum (antero-posterior [AP] 0.4 mm, mediolateral [ML] 1.8 mm, dorsoventral [DV] 3.5 mm from bregma).24,25 Control mice (n = 3) were injected with equal volumes of PBS at the same coordination.
Stem Cell Transplantation
Four weeks after 6-OHDA injection, effLuc-transduced HB1.F3 cells (4 × 10⁵ cells/2.5 μL of PBS) were stereotaxically transplanted into the right striatum at a rate of 0.5 μL/min using a stereotaxic apparatus (David Kopf, CA) (PD group, n = 7; control group, n = 3). Before transplantation, F3-effLuc cells were tagged with DiI (CellTracker CM-DiI, Invitrogen). The transplantation was performed at the following coordinates: AP 0.4 mm, ML 1.8 mm, and DV 3.5 mm from bregma. The sham-treated group (n = 5) received sham injections of the same number of dead effLuc-transduced HB1.F3 cells. Cells were killed by a freeze-thaw cycle regimen and were injected at the same coordinates. 26
Behavioral Analysis (Apomorphine-Induced Rotation Test)
Behavioral tests were conducted in all mice 3 to 4 weeks postlesion (before the cell/sham treatment) and again 4 weeks posttreatment. After injection of apomorphine (subcutaneously, 0.5 mg/kg), the rotational movement of animals was observed for 40 minutes. Ipsilateral and contralateral turns were measured by a rotation-measuring device. The results were expressed as contralateral net turns/minute (contralateral net turns = nonlesion side turns = lesion side turns).
[18F]FP-CIT Small-Animal PET Scanning
Small-animal PET scanning using [18F]FP-CIT (purchased from Asian Medical Center, Seoul, Korea) was done 3 to 4 weeks postlesion, before the cell/sham treatment, and performed again 4 weeks posttreatment. [18F]FP-CIT (1.11 MBq/10 g body weight) was injected through the tail vein under isoflurane anesthesia. Preliminary dynamic analysis showed a plateau of striatum-specific activity from 30 to 90 minutes after injection (data not shown). Thus, we acquired static images for 30 minutes starting 30 minutes after injection. During PET scans, animals were kept under isoflurane anesthesia. Acquired images were reconstructed using an ordered subset expectation maximization (OSEM) algorithm. The binding potential (BP) of the bilateral striatum was calculated using the PMOD program (PMOD Technologies Ltd., Switzerland) with the cerebellum as a reference tissue. The results were expressed as the ratio of lesion side to the nonlesion side BP of the striatum.
The Xenogen-IVIS 100 cooled charge-coupled device (CCD) optical macroscopic imaging system (SC BioScience, Japan) was used for BLI. Mice were given an intraperitoneal injection of D-luciferin (150 mg/kg), and images were acquired for 5 minutes beginning 10 minutes after administration. The mice were not anesthetized before the injection of D-luciferin and following 8 minutes and then were anesthetized 2 minutes before the imaging and during the imaging. Medium binning was used. All images were analyzed with Igor (WaveMetrics, OR) and Living Image (Xenogen, CA) software, and optical signal intensity was expressed as photon flux. To quantify the optical signal, we defined regions of interest (ROI) over the transplanted area and examined all values with the same size and shape of ROI. Bioluminescence activity was quantified in units of photons per second per square centimeter per steradian (photons/s/cm2/sr).
Tissue Preparation and Immunohistochemistry
Four days and 4 weeks posttransplantation, animals were deeply anesthetized and transcardially perfused with 4% paraformaldehyde (PFA). Brains were removed, fixed with 4% PFA solution in PBS (USB Co., OH) for 24 hours at room temperature, and embedded in paraffin. Coronal sections (4 μm) of the region covering the striatum and substantia nigra were dewaxed in xylene, and endogenous peroxidase activity was blocked using 0.5% H2O2 in methanol for 30 minutes. Sections were then washed in PBS and blocked with normal goat serum or normal horse serum for 30 minutes at room temperature.
The tissue sections were incubated with a 1:800 dilution of goat antiluciferase (Millipore Co., MA), 1:500 dilution of rabbit antityrosine-hydroxylase (Millipore Co.), and 1:200 dilution of mouse antinestin (Santa Cruz Biotechnology Inc., CA). Slides were incubated with primary antibodies overnight at 4°C before being washed in PBS and incubated with fluorescent secondary antibodies (Alexa Fluor 488, 555, and 594, antirabbit, antimouse, antigoat, respectively; Invitrogen) for 1 hour at room temperature. The tissue sections were treated with mounting solution (Vector Laboratories Inc., CA) containing 4′,6-diamidino-2-phenylindole (DAPI, Invitrogen, CA). Terminal deoxynucleotidyl transferase dUTP nick end labeling (TUNEL) assay was done using an Apoptosis detection kit (ApopTag Peroxidase In Situ, Millipore, MA).
Statistical Analysis
Statistical analysis was performed using MedCalc for Windows (MedCalc Software, Belgium), and p < .05 was considered statistically significant. Correlation analysis was done between F3-effLuc cell numbers and bioluminescent intensities in vitro. One-way analysis of variance (ANOVA), followed by post hoc testing, was performed among contralateral net turns/minute of control and sham-treated and cell-treated PD groups before transplantation and the same three groups 4 weeks after intervention. Unpaired Student t-tests were done to evaluate differences between the two data sets, which were as follows: (1) bioluminescence activity of the cell-treated PD group and the control group; (2) contralateral net turns/minute before transplantation and 4 weeks after cell transplantation in each group (control, sham-treated PD, and cell-treated PD groups); (3) ratios of BP in PD and control groups; (4) ratios of BP before transplantation and 4 weeks after cell transplantation in the PD group.
Results
In Vitro Luciferase Activity of effLuc-Transduced HB1.F3 Cells
HB1.F3 cells stably expressing effLuc (F3-effLuc) were established via retroviral transduction. Sorted CD90.1-positive cells were verified by FACS. Luciferase-positive cells were shown as 88.6% (Figure 1B). To check the signal intensity of luciferase in F3-effLuc cells, a CCD-based macroscopic detector was used to detect the in vitro luminescence intensity of various cell numbers (2.5 × 10⁴ to 2 × 10⁵) in the presence of D-luciferin. All data were collected in triplicate. With a cell number of 2.5 × 10⁴, 2.03 × 10⁶ ± 0.77 × 10⁶ (mean ± SD) photons were detected per second. The luciferase intensity of F3-effLuc cells was linearly correlated with cell number (r = .93, p < .0001; Figure 1C).
In Vivo Visualization and Repeated Monitoring of Viable Transplanted F3-effLuc Cells in Individual Mice
Transplanted F3-effLuc cells were successfully visualized on the brain in all mice by BLI through the intact skull and scalp. Measurement of bioluminescence signals was conducted in an F3-effLuc-transplanted PD animal model (n = 7) and control mice (n = 3). Bioluminescence activities were highly variable on the day after transplantation (highest, 3.1 × 10⁴ photons/s/cm2/sr; lowest, 9.1 × 10³ photons/s/cm2/sr; mean ± SD, 1.9 × 10⁴ ± 8.6 × 10³ photons/s/cm2/sr) but showed similar trends of survival in both groups. The bioluminescence activity of the transplanted F3-effLuc cells gradually decreased to background level on day 10 and showed no significant difference between two groups at every time point (Figure 2). Bioluminescence activity was not detected in sham-treated mice.

In vivo bioluminescence imaging and monitoring of transplanted F3-effLuc cells. A, Representative in vivo images of transplanted F3-effLuc cells. Focal luminescence activity is visualized at the animal brain and gradually decreased. B, Serial monitoring of transplanted F3-effLuc cells in cell-treated Parkinson disease (PD) mice (n = 7) and in control mice (n = 3). The mean of luminescence activity of transplanted F3-effLuc cells gradually decreased to ground level by day 10. No significant difference was found between the PD and the control group. Sham = sham (dead cell injection) -treated PD mice (n = 5).
Functional Recovery by F3-effLuc Transplantation in a PD Mouse Model
All mice that received the 6-OHDA injections in the right striatum (n = 12) showed significant side-biased rotational movement after apomorphine injection. Contralateral net turns/minute of PD model groups for cell treatment (n = 7) and sham treatment (n = 5) were 2.63 ± 0.74 and 2.65 ± 0.96, respectively. Contralateral net turns/minute of the control group (n = 3) were 0.14 ± 0.16, which is lower than those of the PD model groups (one-way ANOVA, F = 13.4, p = .003, post hoc tests, p < .05). Four weeks postintervention, the contralateral net turns/minute of the two PD groups were still significantly higher than those of the control group; however, the cell-treated PD model showed significantly lower contralateral net turns/minute than the sham-treated PD group (1.24 ± 0.50, 2.34 ± 0.36, 0.15 ± 0.20, ANOVA, F = 21.8, p = .001, post hoc tests, p < .05, p < .05). Contralateral net turns/minute in the cell-treated PD group were 2.63 ± 0.74 and fell to 1.24 ± 0.50 4 weeks after F3-effLuc transplantation (p = .012). However, there was no significant change in the apomorphine test results of the control group (n = 3, from 0.14 ± 0.16 to 0.15 ± 0.20) and the sham-treated PD group (n = 5, from 2.65 ± 0.96 to 2.34 ± 0.36) after interventions (Figure 3).
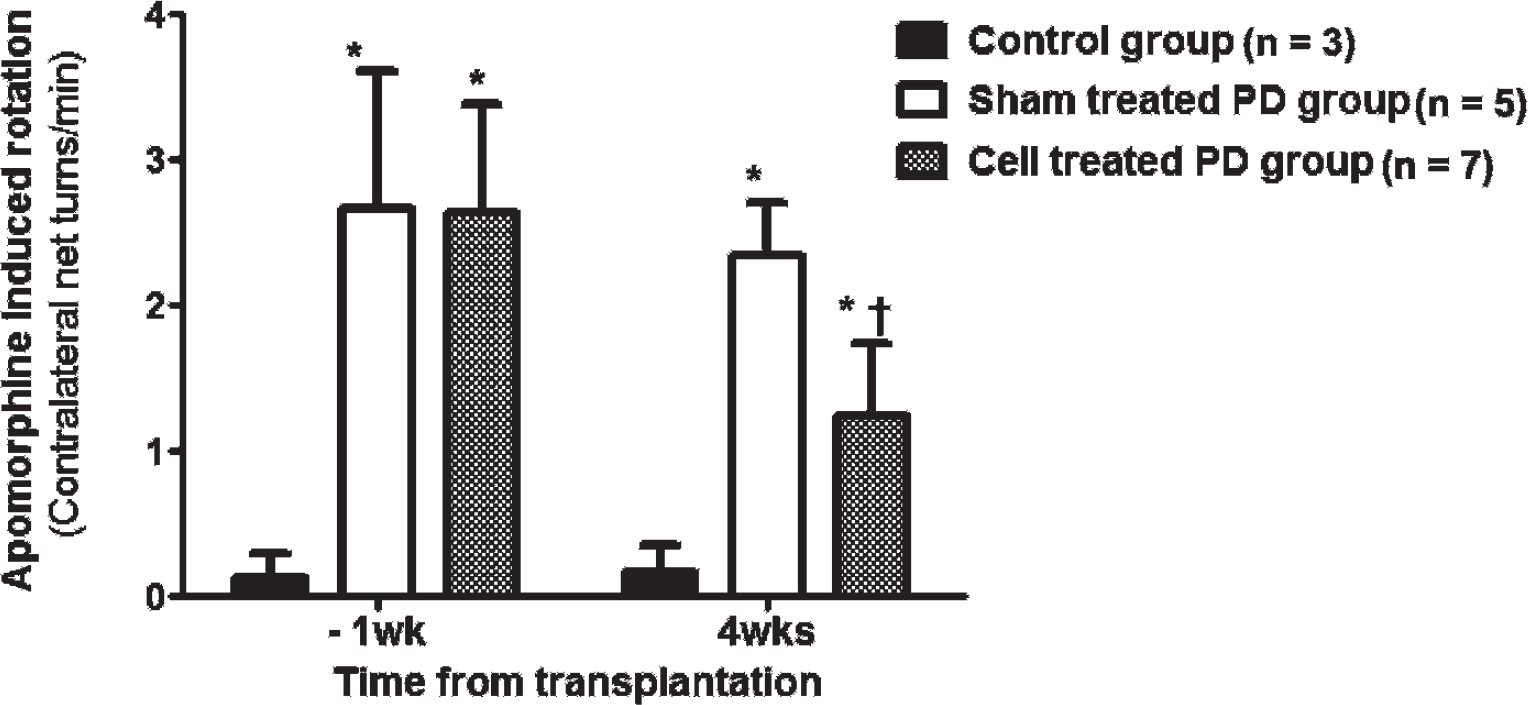
Behavioral analysis in control, sham–treated, and cell-treated Parkinson disease (PD) groups before transplantation and 4 weeks after intervention. Two groups of the PD model showed significant side-biased rotational behavior in the apomorphine-induced rotation test compared to control mice before transplantation and 4 weeks after intervention (one-way ANOVA followed by post hoc tests, *p < .05). Four weeks after F3-effLuc transplantation, the cell-treated PD group (n = 7) showed significant behavioral improvement (†p < .05) than before the transplantation. The sham-treated PD group (n = 5) and the control group (n = 3) showed no significant behavioral changes after treatment. 1wk = within 1 week before F3-effLuc cell transplantation; 4wks = 4 weeks after F3-effLuc cell transplantation.
Significantly Reduced [18F]FP-CIT Binding in Postlesional Striatum but No Such Improvement after Cell Transplantation
The bilateral striatum was symmetrically visualized by [18F]FP-CIT scanning in the control group. Markedly decreased binding of [18F]FP-CIT was seen in the right striatum of all PD mice (Figure 4A). The calculated BP was significantly decreased in the right striatum compared to the intact left side. The ratio of bilateral striatal BP in the PD group was significantly lower than that in the control group (0.23 ± 0.02 and 0.86 ± 0.03, respectively) (Figure 4B). There was no significant improvement in striatal BP ratio after F3-effLuc cell transplantation in the PD group (from 0.23 ± 0.02 to 0.25 ± 0.07).

Dopamine transporter imaging and quantification using [18F]FP-CIT PET/CT in control and Parkinson disease (PD) groups. A, [18F]FP-CIT PET/CT fusion image of a control mouse (left row) showed symmetrical activity in the bilateral striatum, and the PD model (right row) showed minimal activity in the right striatal area. B, Binding potential (BP) ratio of the control group (n = 3) and postlesional striatum in the PD model (n = 7) (before transplantation, 4 weeks after F3-effLuc cell transplantation). The BP ratio of the PD model group was significantly lower than that in the control group and unchanged 4 weeks after transplantation. The color scale indicates the standardized uptake value (SUV). 1wk = within 1 week before F3-effLuc cell transplantation; 4wks = 4 weeks after F3-effLuc cell transplantation.
Examination of Transplanted F3-effLuc Cells 4 Days and 4 Weeks after Transplantation at a Microscopic Level
The transplanted F3-effLuc cell mass was observed in sections of the right striatum on hematoxylin-eosin stain both 4 days and 4 weeks after transplantation. On day 4, a high density of cells was found in the right striatum (Figure 5, A and B), whereas marked hyalinization in the transplanted site and a small number of viable cells were noted 4 weeks after transplantation (Figure 5, C and D). Transplanted cells were well visualized by DiI positivity on day 4 (Figure 5E), and only a small fraction of the DiI-positive transplanted cells remained 4 weeks after transplantation (Figure 5F). TUNEL stain was positive in transplanted cells on day 4 (Figure 5G) but negative 4 weeks after transplantation (Figure 5H). Apoptosis-mediated cell death occurred from the early phase of transplantation and stabilized after most of the cells were dead. A small fraction of the remaining cells exhibited specific immunostain for luciferase (Figure 6, A to C). A DiI-positive cell mass was identified beneath the right external capsule (Figure 6, B to D). Tyrosine hydroxylase (Th)-positive cells were not found in the transplanted cell mass 4 weeks after tranplantation. Instead, the cells were positive for nestin, which is an NSC marker (Figure 6, E and F).
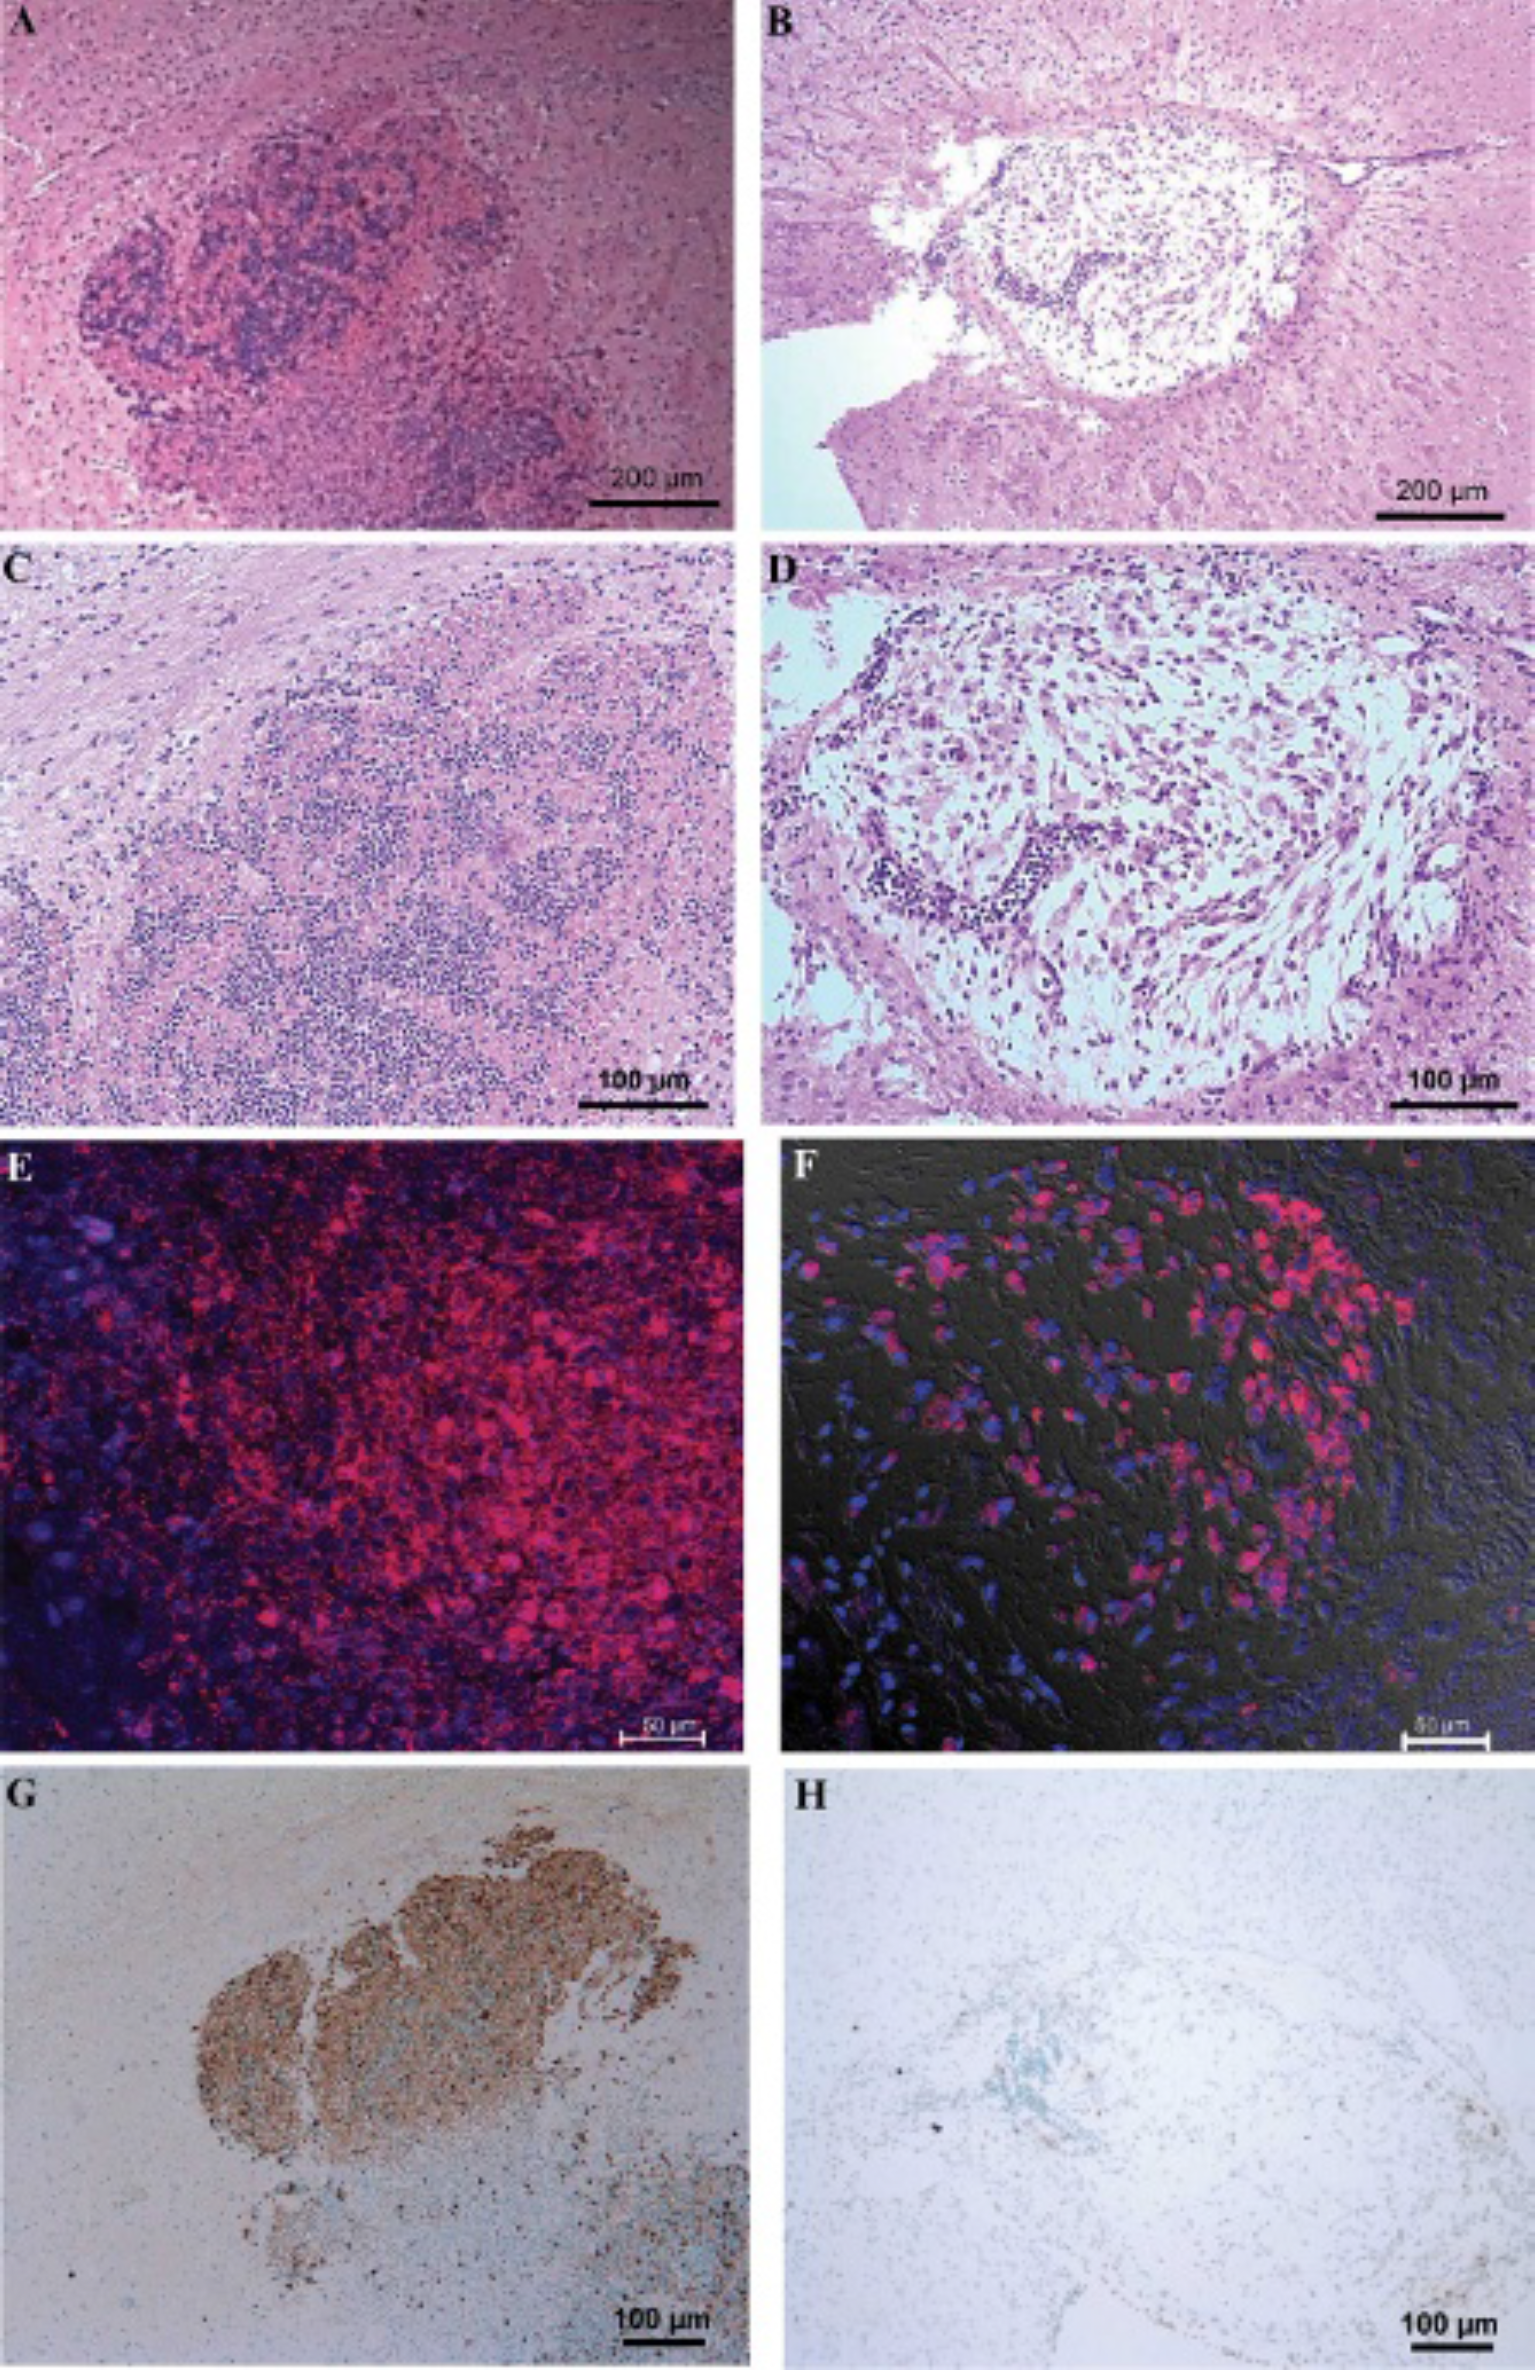
Difference of transplanted F3-effLuc cells between 4 days and 4 weeks after transplantation, assessed by hematoxylin-eosin, TUNEL, and DiI imaging. On hematoxylin-eosin-stained sections, high cellular density was noted 4 days after transplantation (A, B). However, more than half of the cells were hyalinized 4 weeks after transplantation (C, D). Also, a high density of DiI-positive cells (pink) was found 4 days after transplantation (E). DiI-positive cells (pink) were decreased but remained in the transplanted F3-effLuc cell mass 4 weeks after transplantation (F). TUNEL assay showed positivity (brown) in the transplanted cells 4 days after transplantation (G). Conversely, no TUNEL-positive cell was found 4 weeks after transplantation (H). Nuclei were counterstained by DAPI (blue, E, F), and methyl green (light blue, G, H).

Immunohistochemical characteristics of transplanted F3-effLuc cells. A, Antiluciferase (green) and, B, DiI-positive (pink) cells were found in the transplanted F3-effLuc cell mass (C, merged image). D, A transplanted cell mass (white dotted line) was located beneath the right external capsule (red dotted line). DiI-positive cells were shown inside the cell mass (pink). E, T-helper-positive cells were not found in the transplanted cell mass, F, but the cells were positive for nestin (red). Nuclei were visualized by DAPI staining (blue A–F).
Discussion
Stem cell-based therapy is thought to be a prospective strategy for long-term treatment of PD. This treatment, however, has to overcome several issues before clinical translation, and identification of the most effective and safe sources of cells is one of the most important. The ideal stem cell for the therapy must have two key characteristics: long-term survival in the host tissue and the ability to differentiate into mature dopaminergic neurons. In addition, standardization of protocols is important for cell-based therapy. In vivo monitoring of the viable cell fraction of transplanted cells is crucial for identifying the most effective stem cell source and optimizing stem cell-based therapy.
We showed that transplanted F3-effLuc cells in a PD model can be clearly detected in the brain and analyzed the time course of survival of transplanted HB1.F3 cells in the same PD model. Luminescence activity of transplanted F3-effLuc gradually decreased and disappeared by day 10. This result indicates that transplanted F3-effLuc cells spontaneously regress in the injured striatum in the PD model, most likely due to inflammation or rejection. Spontaneous regression of transplanted stem cells is consistently observed in previous studies of stem cell transplantation in animal models, which are a spinal cord injury model with NSCs, 27 a cerebral ischemia model with neural progenitor cells,21,28 and a myocardial infarction model with adipose tissue-derived stem cells. 20 Yasuhara and colleagues reported that rejection after transplantation of HB1.F3 cells occurred despite immunosuppression with a cyclosporine regimen, 15 and we also observed that there was no significant difference in cell survival with an immunosuppression regimen or without immunosuppression (data not shown). Thus, we did not use an immunosuppression regimen in the present study.
To the best of our knowledge, the present study is the first to establish an in vivo monitoring system of transplanted stem cells in a PD mouse model. effLuc-transduced human NSCs (F3-effLuc) were noninvasively visualized and repeatedly compared by BLI, despite the presence of dark hair in C57bl/6 mice and an intact skull. Although dark hair could be a barrier for optical imaging, we decided to use the C57bl/6 mouse for the experiment because this strain is known to be the most sensitive to neurotoxin and is used most widely for the neurotoxin-induced PD mouse model. 29
We tentatively concluded that bioluminescence activity could reflect the amount of transplanted F3-effLuc cell survival after excluding several possible confounding factors as follows. First, the NSCs could have migrated to other places in the brain, resulting in decreased bioluminescence activity. However, we could not find any DiI-positive cells in other places outside the transplanted site in all sections of brain 4 weeks after transplantation. Second, hypoxic condition can cause decreased bioluminescence activity despite a large number of viable cells because oxygen is required to produce light by luciferase. However, hypoxia is not reported in a 6-OHDA model of PD; moreover, we did not observe any difference in the bioluminescence activity of transplanted cells between the PD model and the control group. Third, restoration of the blood-brain barrier (BBB) after transplantation can affect bioluminescence activity because of alteration of diffusion efficiency of D-luciferin into the brain. However, D-luciferin can easily cross the BBB, 30 so the influence of the BBB state may be minimal. Moreover, we did not observe bioluminescence activity in prolonged BLI up to 40 minutes after D-luciferin injection when there was no bioluminescence activity in the first 15 minutes. Lastly, the level of luciferase expression of transplanted F3-effLuc cells could have been changed in the brain context. However, DiI-stained transplanted F3-effLuc cells 4 weeks after transplantation were markedly decreased when compared to those on day 4, which is in accordance with a decrement of in vivo bioluminescence activity. However, to exclude the possibility of confounding due to alteration of luciferase expression, further study is warranted; that is, correlation analysis between the antiluciferase-positive cell number in the brain section and in vivo bioluminescence activity at the same time point.
In the present study, the PD model was validated using dopamine transporter imaging and a behavioral test. When 6-OHDA is injected into the striatum, dopaminergic neurons take up 6-OHDA presynaptically via the dopamine transporters, and retrograde degeneration of nigro-striatal neurons occurs as a result. 31 After unilateral depletion of dopaminergic neurons, dopamine transporter (DAT) in the striatum is depleted, and motor function in the contralateral limb is altered. These changes were stably induced in our PD model; we documented DAT depletion by [ 18 F]FP-CIT and retardation of contralateral motor function by the apomorphine-induced rotation test.
F3-effLuc cell transplantation in the PD model led to improvements in the results of the behavioral test. Similarly, transplantation of the cells occurred functional recovery in previous studies. Transplantation of the cell line with transduction of tyrosine hydroxylase showed functional improvement in a rat model of PD. 32 Moreover, transplanted HB1.F3 cells without any supporting factor or genetic modification also provided functional repair in a rat model of PD through the secretion of trophic factors and neuronal differentiation. 15 In primates, transplanted HB1.F3 cells not only exert functional recovery but also differentiate into dopaminergic neurons. 16
Our immunohistochemistry data showed that transplanted F3-effLuc cells were present 4 weeks posttransplantation, although bioluminescence signals emitted from F3-effLuc cells were not found in PD mice. This discrepancy might be due to the limited sensitivity of in vivo BLI because BLI also suffers from an attenuation problem, although BLI with effLuc is better than other bioluminescence or fluorescence imaging.17,22 Thus, we performed an additional experiment to identify the lower limit of cell number to be detected by our system. BLI was performed 3 hours after transplantation of F3-effLuc cells in the right striatum of C57Bl/6 mice with the number of 5 × 10², 103, and 2 × 10³. The signal was detected from the cell number of 2 × 10³, which was not detected with the cell number of 1 × 10³ (Figure S1A, online version only). Accordingly, we could speculate that less than 2 × 10³ F3-effLuc cells (0.5% of transplanted) survived at the end of our experiment. The survival rate in our experiment is relevant because less than 1% of HB1.F3 cells survived 4 weeks after transplantation in the previous report. 15 This estimation may have a limitation because a rat model of PD was used in Yasuhara and colleagues' research, not a mouse model. We did additional BLI after shaving the head area and found that the sensitivity increased (Figure S1, B and C, online vision only). This result is in accordance with the result of Deroose and colleagues. 33 Th-positive cells were not found in the transplanted cell mass. This result is in accordance with a previous report by Yasuhara and colleagues, who found that HB1.F3 cells did not differentiate into dopaminergic neurons in vivo until 4 weeks after transplantation. 15 However, considering that dopaminergic differentiation of HB1.F3 cells was reported in another study 4 months after transplantation in a primate PD model, 16 Th-positive cells might not have been found due to the short duration of observation after transplantation in the present study.
In accordance with the negative Th immunostaining result of the present study, the PD mouse model with F3-effLuc cell transplantation showed no evidence of recovery of dopaminergic neurons on DAT imaging. However, functional recovery was observed by behavioral analysis. Thus, behavioral improvement might be caused by other factors, such as trophic or protective activity 16 recruited by transplanted NSCs rather than recovery of dopaminergic neurons. Further studies, such as F3-effLuc cell medium analysis of trophic factors or microarray study of host cells after F3-effLuc transplantation, are warranted to clarify the mechanism.
Conclusion
Transplantation of F3-effLuc cells into 6-OHDA-lesioned mice led to improvement of functional outcomes. Transplanted F3-effLuc cells were successfully monitored by an in vivo BLI system. This system enables longitudinal assessment of transplanted cells in individual PD mice without sacrifice of animals or any invasive procedures. This system will be a valuable tool in the optimization of stem cell treatments for PD.
Footnotes
Acknowledgments
Financial disclosure of authors: This work was supported by the Nano-Biotechnology Project (Regenomics, 20100002086), Brain Research Center of the 21st Century Frontier Research Program (2009K001257), World Class University project of the Ministry of Education & Science Technology (MEST), National Research Foundation (R31-2008-000-10103-0), and a National Research Foundation of Korea grant (2011-0019044) funded by the Korean government (MEST). This study was supported by a grant (kiom-2010-2) from the Inter-Institutional Collaboration Research Program provided by the Korea Research Council of Fundamental Science & Technology (KRCF), Korea.
Financial disclosure of reviewers: None reported.