
Abstract
Therapy monitoring of glioma after stereotactic iodine-125 brachytherapy (SBT) remains challenging because posttherapeutic changes in magnetic resonance imaging can mimic tumor progression. We evaluated the prognostic value of serial [18F]fluoroethyltyrosine (FET)-positron emission tomographic (PET) scans for therapy monitoring of high-grade glioma (HGG) after SBT. Thirty-three patients with recurrent HGG were included. Serial FET-PET scans were performed prior to therapeutic intervention and at 3-month intervals during the first year after SBT. FET-PET evaluation was performed by both conventional data analysis and kinetic analysis. Prognostic factors were obtained from proportional hazard models. Median local progression-free survival (LPFS) was 11.1 months. Maximal standardized background uptake value (SUVmax/BG) and biologic tumor volume (BTV) differentiated accurately between therapeutic effects and local tumor progression at the 6-month and subsequent examinations. Increasing uptake kinetics at baseline (p < .05) and during follow-up (p < .01) were stringently associated with a longer LPFS. Early increase in FET uptake after SBT is not unequivocally associated with tumor progression; it might be induced by reactive changes and could easily lead to a misclassification of the tumor status (pseudoprogression). Six months after SBT (or later), however, increased SUVmax/BG and BTV values are associated with a worse prognosis. Multivariate analysis stresses the prognostic importance of dynamic studies.
THE DEVELOPMENT AND EVALUATION of treatment strategies for patients with a high-grade glioma recurrence after previously applied multimodal treatment regimens (including surgery, external beam radiation, and chemotherapy) is of the utmost interest. 1 For selected patients with small, circumscribed (diameter ≤ 4 cm), and eloquently located recurrent tumors not accessible for gross total tumor resection, stereotactic iodine-125 brachytherapy (SBT) has been reported to be an attractive and minimally invasive treatment modality. 2 The aim of SBT is to devitalize a well-defined treatment volume and to avoid damage of the surrounding tissue. The evaluation of treatment response, however, is extremely challenging; imaging changes induced by SBT can seriously confound differential diagnosis between tumor progression and more benign treatment-related lesions: after SBT, usually an enhanced ring formation on magnetic resonance imaging (MRI) develops gradually from the center to the periphery of the treatment volume and then slowly resolves over time. The inner zone of this so-called “triple ring” formation represents necrotized tumor, which is surrounded by a small rim of tissue with increased permeability; the outer zone refers to treatment-induced edema. 3 Given that treatment-induced disturbances of the blood-brain barrier can last up to 24 months after implantation and might significantly exceed the initial tumor/treatment volume, it becomes clear that any valid distinction between a tumor recurrence and benign treatment-induced imaging changes appears elusive using standard MRI protocols.4–6
Molecular imaging techniques using radiolabeled amino acids have been shown to be highly useful to distinguish between the benign side effects of the therapy and tumor recurrence in multimodally treated glioma patients.7–13 Recently, specificity and sensitivity values in the range of 92% and 100%, respectively, have been reported. 13 However, the prognostic and diagnostic impact of serial positron emission tomography (PET) imaging with [18F]fluoroethyltyrosine (FET) in patients harboring malignant glioma recurrences treated with SBT has not been elucidated so far. For clarification, the current study was conducted.
Methods and Materials
Patient Selection Criteria
Patients with a biopsy-proven circumscribed malignant glioma recurrence after multimodal treatment with a maximum diameter ≤ 4 cm and a Karnofsky Performance Scale (KPS) score of at least 70 were considered eligible for this study. SBT was not indicated in tumors of the brainstem and in those involving the corpus callosum. Serial FET-PET scan evaluation was done before treatment and 3, 6, 9, and 12 months after implantation. At corresponding time intervals, conventional MRI evaluation (including T1 [native and gadolinium enhanced] and T2 sequences) was performed. Adjuvant treatment after SBT consisted of alkylating chemotherapeutic agents such as temozolomide or procarbazine + lomustine + vincristine. Further therapies (resurgery, irradiation, or bevacizumab chemotherapy) were indicated only in case of further tumor progression. A time frame of 6 years was chosen to achieve comparability of the monitoring technique and to include at least 30 patients.
Biopsy and 125I implantation Technique
The technique of multimodal imaging–guided stereotactic biopsy technique and consecutive seed implantation were extensively described previously.14–16 A modified Riechert-Mundinger stereotactic frame and a multiplanar planning workstation (@Target 1.19, BrainLAB, Feldkirchen, Germany) were used. Coregistration of computed tomography (CT), MRI (including T1- and T2-weighted sequences, and magnetic resonance angiography), and FET-PET data served for three-dimensional visualization (i-plan stereotaxy, BrainLAB) of the tumor and simulation of the “best” trajectory, including metabolically active areas. Via a small skin incision and a 2 mm bore hole, a serial biopsy was taken. The intraoperative histopathologic diagnosis was made by an attending experienced neuropathologist based on smear preparation analysis. Seed implantation was performed immediately after the biopsy procedure only when the intraoperative diagnosis confirmed the presence of vital tumor cells. In those patients with inconclusive intraoperative findings, SBT was done usually 1 week later after verification of a tumor recurrence by examination of the paraffin-embedded tumor tissue.
For SBT, exclusively low-activity (≤ 740 MBq) temporary 125I seeds were used; the applied reference dose (mean), which was calculated to the outer boundary of the tumor, was in the range of 50 Gy. In case of larger tumor volumes, tumor dose was adjusted accordingly. The dose rate was low (< 20 cGy/h (detailed treatment characteristics are shown in the supplementary data in Table S1, online version only). After the 125I seed (length 4.5 mm), encapsulated in the tip of a Teflon catheter, was stereotactically implanted (via a 2 mm burr hole for each catheter), the catheter was cut to the appropriate length and secured at the burr hole with a hemoclip. The correct position of the seeds was verified by postoperative CT scan evaluation, which was fused with the preoperative localized CT scan to control the seed positions. Patients received steroids on the day of the surgical procedure and on 3 following days. Any complication associated with the stereotactic surgical procedure was classified as morbidity.
FET-PET Image Acquisition and Assessment
For standardized metabolic conditions, patients fasted for a minimum of 6 hours prior to the PET scan. The PET data were acquired with a Siemens ECAT EXACT HR+ PET scanner (CTI/Siemens, Knoxville, TN). After a 15-minute transmission scan (68Ge sources), approximately 180 MBq of [18F]FET was injected intravenously. Dynamic acquisition was performed from 0 to 40 minutes postinjection (128 × 128 matrix, three-dimensional acquisition). Images were reconstructed by filtered back-projection using a Hann filter and were corrected for scatter and attenuation. For further evaluation, data were transferred to a HERMES work station (Hermes Medical Solutions, Stockholm, Sweden).
For quantitative evaluation, the maximal FET uptake (maximal standardized uptake value [SUVmax]) was depicted in the tumor/in the seed-implanted area and corrected for the mean background uptake (SUVmax/BG) in a large domain of the healthy contralateral hemisphere.
Evaluation of dynamic PET data was assessed as described previously. 17 In brief, a region of interest analysis (ROI) was performed to extract time-activity curves (TACs) for each slice with suspicious FET uptake. For this purpose, 90% isocontour threshold ROI were defined on a summed image (10–30 min postinjection) and applied to the dynamic PET data.
Volumetric assessment of increased FET uptake (SUVmax/BG ≥ 1.8) was performed by means of a semiautomatic threshold-based calculation of a volume of interest (VOI). This procedure was performed for the evaluation of the pretherapeutic biologic tumor volume (BTV) and for the posttherapeutic increased FET uptake, including all areas surrounding the implanted seed.
FET-PET monitoring criteria were tumor volume, changes in SUVmax/BG, and the kinetics of tracer uptake. When FET use was equivalent to normal brain tissue uptake or only low uptake with a diffuse pattern was seen, which is thus not characteristic of high-grade tumor tissue, patients were considered to be locally tumor free. Evaluation of the PET scans was performed by two experienced nuclear medicine specialists (N.L.J. and C.F.).
MRI Acquisition
MRI was performed on 1.5 or 3.0 T scanners. The standardized sequence protocol comprised an axial T2-weighted sequence and three-dimensional T1-weighted sequences before and after administration of intravenous contrast agent. Evaluation of the MRI scans was performed independently by an experienced neuroradiologist (J.L.).
Patient Evaluation
Clinical, MRI, and FET-PET evaluations were performed either at regular 3-month intervals or when progression was suspected due to increasing contrast enhancement on MRI. Patients presenting with new neurologic symptoms, worsening as indicated by KPS score, an increase in administered steroid medication, and changes in tumor size on conventional MRI were considered to be suffering from progressive disease. Progressive disease was termed local when the tumor reappeared on the same site as the original tumor or when tumor tissue enlarged in patients who never were completely tumor free. This study focused on local progression as the paramount aim was to evaluate the local disease status by means of FET-PET.
Statistical Analysis
The reference point of the current study was the date of the SBT procedure; the date of the last follow-up was December 2010. The primary end point was local tumor progression.
For statistical calculation, SPSS for Windows version 17.0 (SPSS Inc, Chicago, IL) was used. Survival (calculated from the date of SBT) and local progression-free survival (LPFS) after SBT were calculated with the Kaplan-Meier method. The prognostic influence of SUVmax/BG values, kinetics, and tumor volume, as well as other patient-, tumor-, and treatment-related factors, on time to progression was tested using univariate/multivariate proportional hazard models. To evaluate significant differences in the distribution of kinetic patterns and the presence or absence of viable tumor tissue, the chi-square test was used. Furthermore, the negative predictive value of absence of viable tumor tissue after PET criteria for local tumor progression after SBT was calculated. Absence of tumor tissue was also included as a factor with a presumptive influence on LPFS in univariate and multivariate analyses.
Results
Patient Characteristics
In the current series, 33 patients with histologically confirmed recurrent high-grade gliomas (World Health Organization [WHO] III or IV) treated with SBT between 2004 and 2009 were included. (Patient characteristics are shown in Table S2, online version only.) At the time of SBT, 20 patients suffered from WHO grade III gliomas (15 anaplastic astrocytomas, 4 anaplastic oligoastrocytomas, 1 anaplastic oligodendroglioma) and 13 patients suffered from grade IV gliomas. The median follow-up was 17.1 months. At the time of closure of the study, 16 of 33 patients experienced local tumor progression. A distant tumor recurrence occurred in 12 of 33 patients. Overall, 15 of 33 patients (45%) had died due to either local or distant tumor progression. Local tumor progression or recurrence was proven by stereotactic rebiopsy in 9 patients. The remaining 7 patients did not undergo histologic reevaluation because of progressive clinical deterioration, which was judged as local tumor recurrence or progression under consideration of MRI and PET follow-up data. Median survival after SBT was 27.3 months. The median time to local tumor progression was 11.1 months. Contrast enhancement was present on all MRI scans of each patient before treatment and throughout the entire observation period. Neither diminishment nor increase in contrast-enhancing tumor volume on conventional MRI was correlated with the instantaneous disease course. In this patient cohort, no surgical procedure-related morbidity or mortality was observed. There were no symptomatic radiogenic complications, and none of the patients received high-dose steroids until further progression of the tumor.
Univariate Models
PET Evaluation at Baseline and 3 Months after SBT
Univariate analysis revealed no prognostic influence of SUVmax/BG and BTV on LPFS at baseline and 3 months after implantation. In patients without local tumor progression, the mean SUVmax/BG and BTV at baseline was 2.8 and 3.3 mL, respectively; the corresponding values for patients exhibiting tumor progression were 2.9 and 4.3 mL (Table 1). The differences were statistically not significant (p = .8). Three months after implantation, the majority (10 of 17) of patients without signs of local tumor progression presented with decreased FET uptake. Three patients, however, showed a considerably increased uptake (Figure 1); conversely, four patients, who presented with a decreased FET uptake, exhibited an early local tumor progression within the first year after SBT. Those patients with discordant PET and clinical outcome measurements did not differ from others in terms of other patient- and tumor-related factors such as age, tumor volume, and tumor histology. The mean SUVmax/BG 3 months after implantation was identical (2.5) in those with and without tumor progression during the follow-up period. Even though volumetric analysis 3 months after implantation indicated larger uptake volumes in those with tumor progression (6.0 mL vs 2.7 mL), no prognostic influence of the BTV was seen (p > .05).
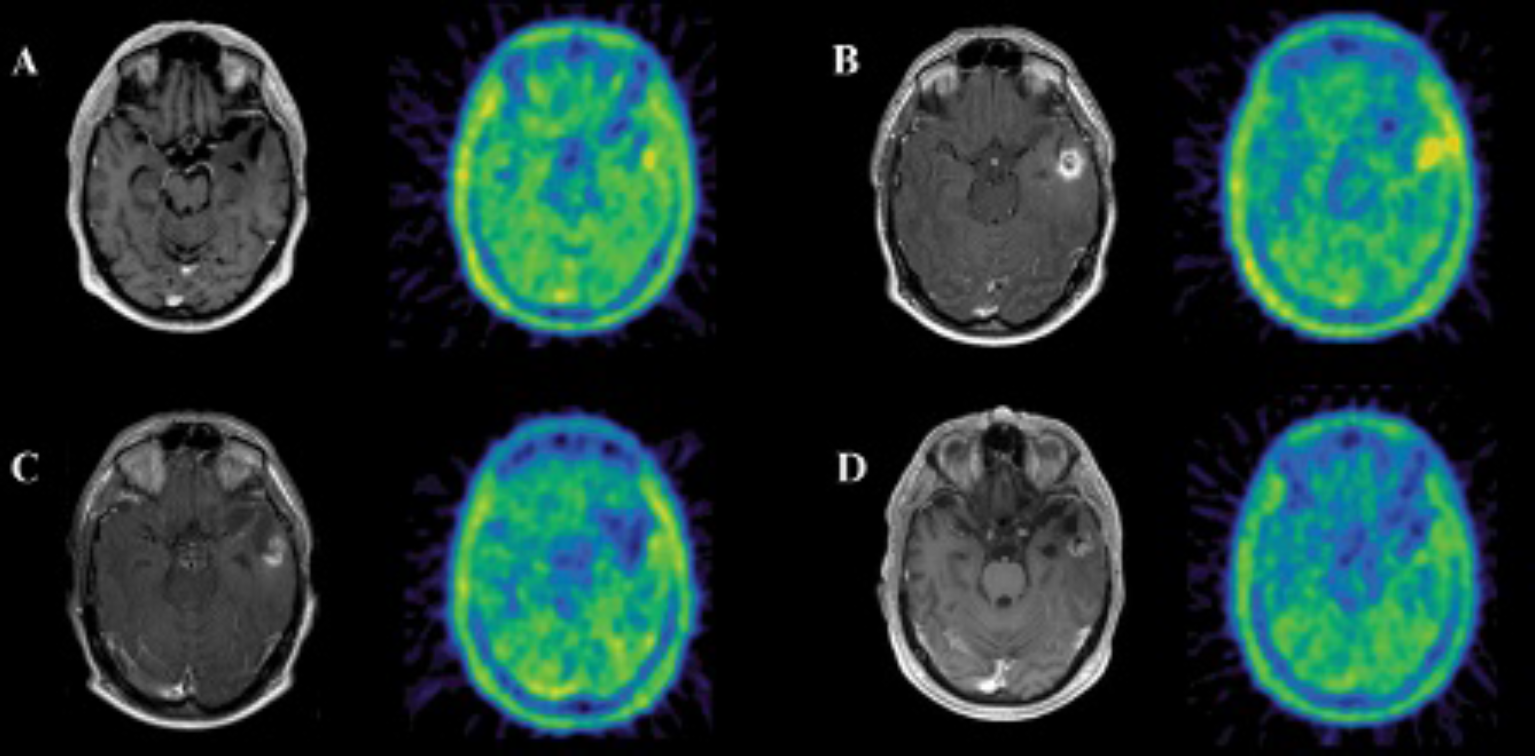
Transversal contrast-enhanced T1-weighted magnetic resonance and coregistered FET-PET images of patient 26 prior to stereotactic brachytherapy (SBT) (A) and 3 months (B), 6 months (C), and 14 months (D) after SBT are shown. Three months after SBT of recurrent high-grade glioma in the left temporal cortex, a ring-enhancing lesion and increased FET uptake were detected (B). Follow-up examination (C, D), however, revealed decreasing FET uptake.
Mean SUVmax/BG and Tumor Volume (mL) ± Standard Error at Corresponding Follow-up Time Points in Patients Presenting with and without Local Tumor Progression during the Study

FET-PET= [18F]fluoroethyltyrosine (FET)-positron emission tomographic (PET) scans; SBT = stereotactic brachytherapy; SUVmax/BG = maximal standardized background uptake value.
p < .05.
p < .01.
No or diffuse uptake pattern 3 months after SBT gained prognostic influence on LPFS (p < .01). This finding was seen in eight patients, who were judged to be tumor free according to PET criteria. Here, seven of eight patients did not show local recurrence during the follow-up period; one patient, however, experienced tumor recurrence 12 months after SBT.
PET Evaluation 6 Months after SBT
Six months after SBT, absence of or a diffuse pattern of FET uptake, BTV, and SUVmax/BG values gained prognostic influence. The median uptake volume was 2.1 mL in those without local tumor progression and 14.0 mL in patients with tumor progression (p < .01). Additionally, the SUVmax/BG was significantly higher in those exhibiting tumor progression (3.0 vs 2.2; p < .05; see Table 1).
Similar to the results of the 3-month examination, patients considered tumor free according to PET criteria did not present with local progression except the above-mentioned patient.
PET Evaluation > 6 Months after SBT
PET scans at 9 to 12 months after SBT reproduced the results of the 6-month evaluation. Those patients presenting with local tumor progression during follow-up showed significantly increased SUVmax/BG (2.9 vs 2.2; p < .05) and BTV (15.6 mL vs 1.8 mL; p < .01) compared to those without local progression (see Table 1).
Again, patients exhibiting no or a diffuse uptake pattern around the seed-implanted area in these PET examinations did not experience local tumor progression. Overall, absence of tumor tissue according to PET criteria was positively associated with longer LPFS (p < .01). The negative predictive value of this parameter for an LPFS during follow-up was 92%. Individual SUVmax/BG and BTV values for each patient are presented in Table 2.
SUVmax/BG and Biologic Tumor Volume Values of Patients during Follow-up with Respective Outcome Measurements

PD = progressive disease; PFS = progression-free survival; SBT= stereotactic brachytherapy; SUVmax/BG = maximal standardized background uptake value.
Alive.
Dead.
Uptake Kinetics Analysis
Nine of 33 histologically proven recurrent high-grade glioma exhibited increasing uptake kinetics in the baseline PET, independent of the WHO grading; in the remaining 24 patients, an early peak followed by decreasing uptake kinetics was found. Patients with increasing uptake values in the initial scan had a better disease course after SBT compared to those with decreasing kinetics (p < .05; Figure 2). Here, only three of nine patients presented with local tumor progression (one patient 5 months after SBT, two patients 10 months after SBT), whereas the remaining six patients did not show any local progression during the follow-up period. Whenever increasing uptake kinetics was observed in the follow-up investigations, patients showed favorable outcome concerning LPFS (p < .01). Furthermore, uptake kinetics changed from decreasing to increasing TAC throughout the study period in five patients, and none of them experienced local tumor progression during follow-up (Figure 3).

Kaplan-Meier estimates of local progression-free survival (LPFS) stratified by uptake kinetics. Patients with increasing kinetics prior to stereotactic brachytherapy (SBT) exhibited a significantly longer time to local tumor progression (p < .05).
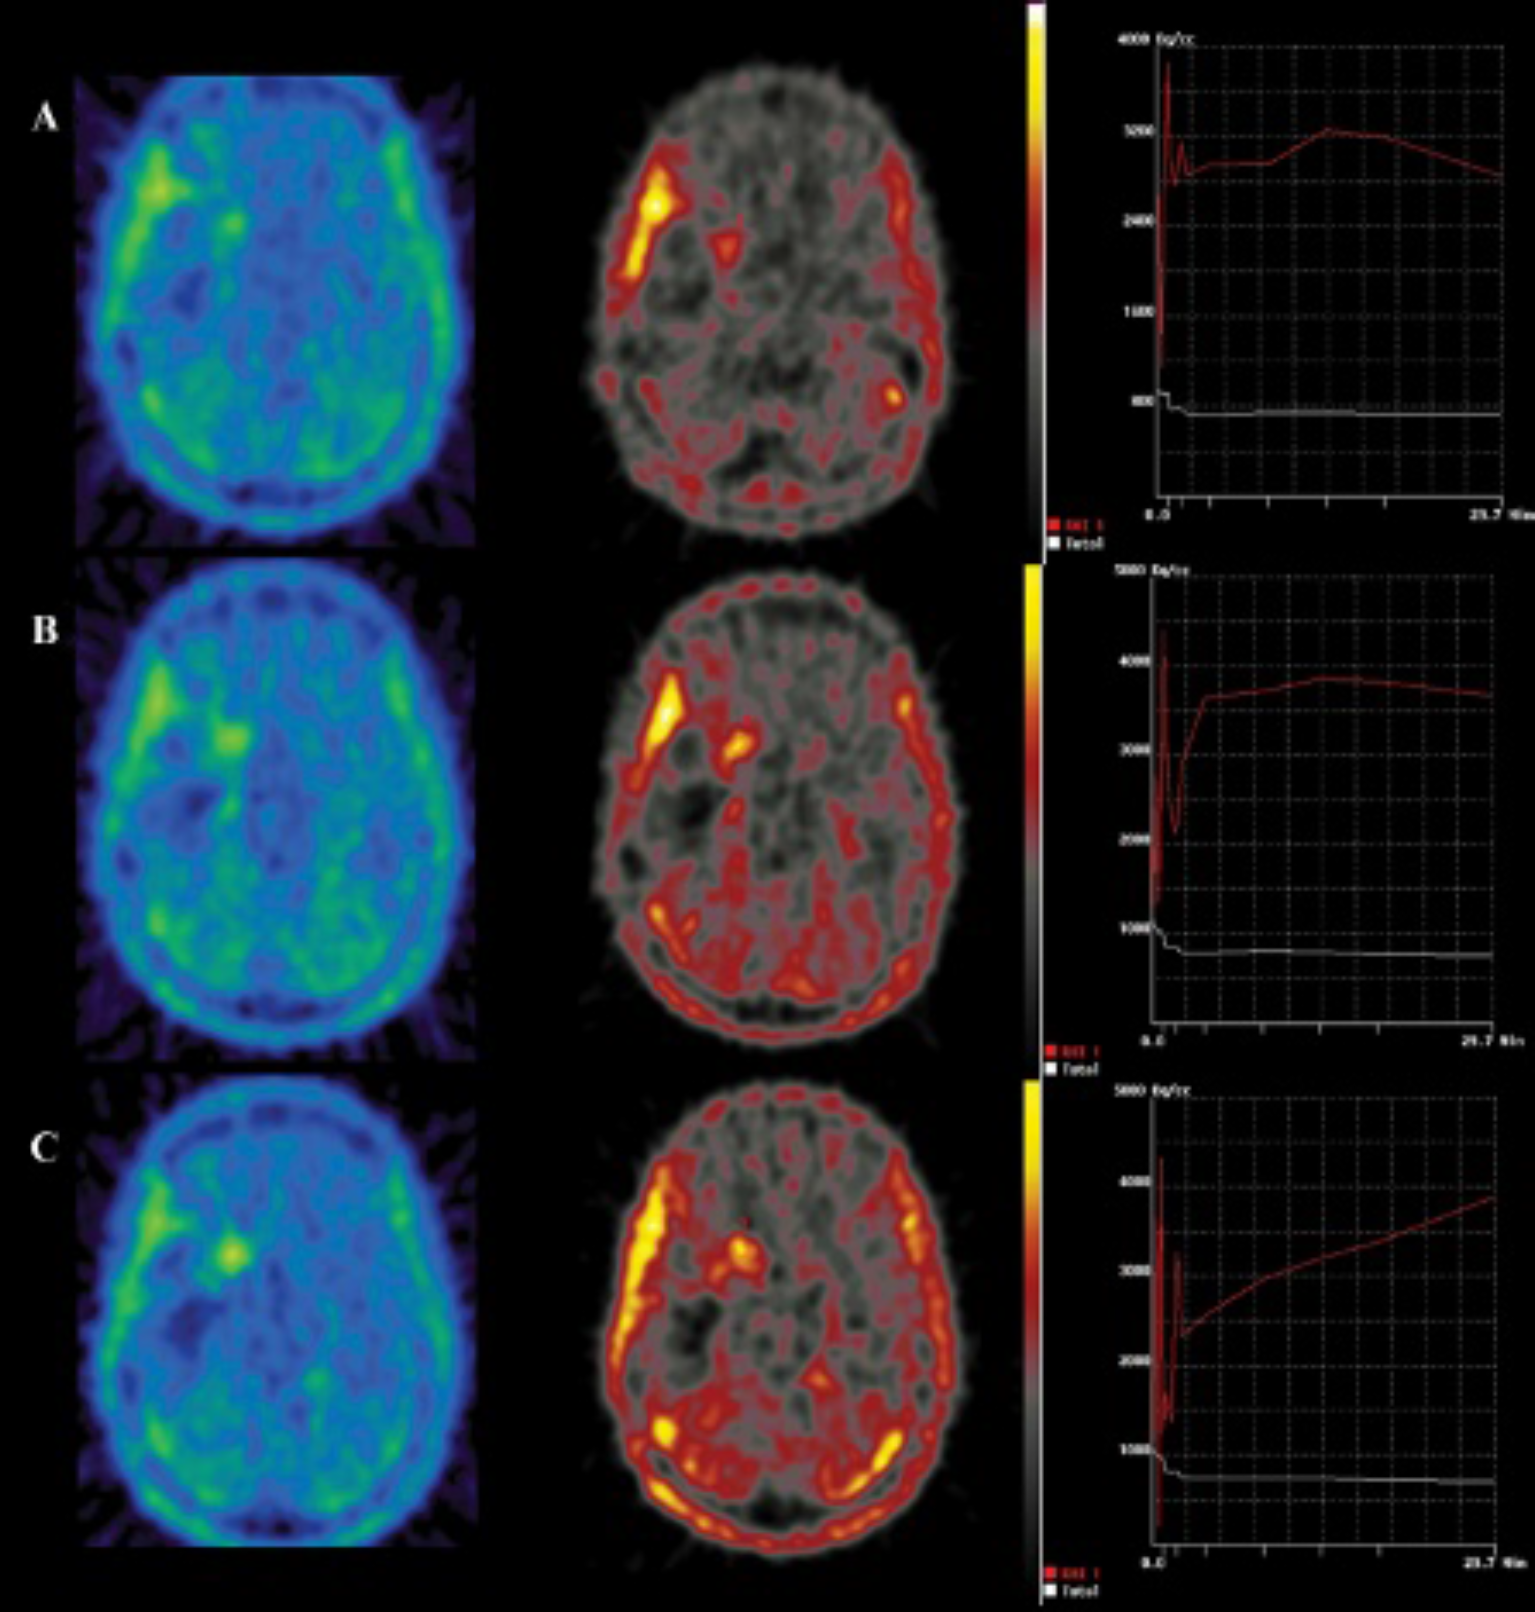
Example of changing uptake kinetics. Prior to stereotactic brachytherapy (SBT) (A), the glioblastoma multiforme shows a typical aggressive uptake kinetic (early peak followed by decreasing uptake). Posttherapeutic time-activity curve showed a less pronounced decrease 3 months after SBT (B) and increasing uptake kinetics 6 months after SBT (C). This phenomenon was associated with better outcome.
Clinical and Treatment-Related Parameters
Histology, age at the time of SBT, tumor grading, irradiation parameters (volume, number of seeds, activity), and time to additional adjuvant therapies were not statistically significant for LPFS.
Multivariate Models
Multivariate regression analysis was performed by means of stepwise factor inclusion. Factors that had proven to be significant in the univariate analysis were included in the multivariate analysis. After adjustment for the effects of other variables, the following parameters were part of the “best model” analysis: kinetics at baseline, 3 months, and 6 months and the factor “absence of tumor tissue.” The last two parameters (kinetics at 6 months and absence of tumor tissue) reached statistical significance in this model (p < .05).
Discussion
Low–dose rate 125I SBT is considered a safe and attractive salvage therapy option for selected patients with recurrent circumscribed and small-sized high-grade glioma not suitable for open tumor resection. 18 The evaluation of the disease status after SBT, however, is challenged by pronounced treatment-induced changes of tumor physiology and the evolution of corresponding imaging changes that could be easily misinterpreted as tumor progression (pseudoprogression). A long-lasting temporary increase (up to 2 years) in capillary permeability (in the vicinity of the therapeutic intratumoral radionecrosis) accompanied by variable degrees of vasogenic edema and concomitantly reduced regional cerebral blood flow have been shown to occur19–21; correspondingly, gadolinium-enhanced follow-up MRI indicates the evolution of so-called triple ring formations as early as 3 months after SBT, which usually increase slowly from the center of the implanted radioactive sources to the periphery and might exceed even the initial tumor volume during the first year after implantation.3,22 Molecular imaging with PET using radiolabeled amino acid analogues, particularly [methyl-11C]-L-methionine (MET) and FET, might help overcome the limitations of morphologic imaging methods as the assessment of BTV based on MET-PET and FET-PET is considered to improve the definition of the tumor borders and tumor volume. A MET-PET study showed that in 74% of patients with high-grade glioma, pathologic amino acid uptake was found outside the abnormal contrast enhancement revealed by MRI, whereas in 100% of the patients, the hyperintensity region on T2-weighted MRI extended beyond the MET enhancement area. 23 This might hold true for FET because the potential of FET-PET to delineate the tumor extent of gliomas appears to be equal to that of MET-PET. 24 Radiation planning studies revealed that planning volumes based on MRI and FET-PET differed in the majority of patients, 25 resulting in larger target volumes when including FET-PET information. 26 In addition, PET using radiolabeled amino acid analogues has been shown to be extremely useful to distinguish between tumor progression and treatment-induced “benign” lesions after multimodal treatment, 27 where pathologic contrast enhancement on MRI is caused by a breakdown of the blood-brain barrier as a result of aggressive therapy. As mentioned above, especially after SBT, it is nearly impossible to discern viable tumor cells from post-SBT changes by means of MRI alone. Even though MET-PET and FET-PET are considered to reflect active tumor tissue in many settings, no systematic evaluation of patients undergoing high-dose irradiation such as SBT has been performed so far. For clarification, the current study was conducted using a stringently applied FET-PET evaluation protocol.
The study results were not biased by perioperative complications and/or the effects of space-occupying radionecrotic lesions demanding long-lasting applications of steroids. The latter has been described to be often necessary after high–dose rate 125I SBT (40-50 cGy/h) of glioblastomas. 28 This approach, however, should not be confused with the treatment strategy of this study: the applied dose rate was low, there were no perioperative complications, and no symptomatic space-occupying radiogenic lesions occurred. Steroids were applied only perioperatively according to the study protocol and at the time of tumor progression. Median progression-free survival was surprisingly long (median 11.1 months) and not influenced by tumor histology, tumor grade, tumor size, patients' age, and time to additional adjuvant therapy after SBT. Treatment parameters of SBT were comparable for all patients.
We demonstrate here that PET examinations at 6 months after SBT or later gained the strongest prognostic influence in terms of the SUVmax/BG, the BTV (see Kaplan-Meier plots in Figure 4; for an example, see Figure 5), and the uptake kinetics. Patients with an “absence of tumor tissue” according to FET-PET criteria, lower SUVmax/BG values, smaller BTV, and/or increasing uptake kinetics exhibited a significantly longer LPFS in one-variable models. However, although statistically significant, the interpretation of the absolute values can remain challenging in the individual patient, especially when the values are somewhere between the mean values of the patients with and without tumor progression.

Kaplan-Meier estimates of local progression-free survival (LPFS) after stereotactic brachytherapy (SBT) stratified by maximal standardized background uptake value (SUVmax/BG ≥ 2.8 vs SUVmax/BG > 2.8) (A) prior to SBT, (B) 3 months after SBT, (C) 6 months after SBT, and (D) 9 to 12 months after SBT. No significant differences in LPFS are found at baseline and 3 months after SBT (p > .05) but 6 months after SBT and later (p < .05).

Increasing FET uptake volume on FET-PET 6 months after stereotactic brachytherapy (SBT) (B) when compared to pretherapeutic FET-PET examination (A) suggests progressive disease. Corresponding MRI examinations prior to (A) and 6 months after SBT (conducted 6 days prior to PET scan) (B) did not reveal significant changes and therefore did not depict the tumor progression, which finally was confirmed by additionally performed PET-based stereotactic biopsy.
Multivariate models identified absence of tumor tissue and increasing uptake kinetics at this time point as the most important favorable prognostic factors. Increasing uptake kinetics at baseline and 3 months after implantation also gained prognostic influence univariately, but these findings were not as powerful as those obtained 6 months after implantation.
Another remarkable finding of this study was that an early increase in FET uptake 3 months after implantation does not per se indicate tumor progression. Even though FET uptake has already decreased in the majority of treatment responders (10 of 17) at this time point, a considerable uptake increase was seen in 3 of this responder group. Conversely, a decrease in FET uptake was associated with relatively early tumor progression in another four patients of this series. As a consequence of these heterogeneous findings, SUVmax/BG and BTV did not gain prognostic influence in the early posttreatment time interval. No association was seen between phenomena of pseudoprogression or regression with early relapse and other patient- and tumor-related factors such as age, tumor volume, and tumor histology. Whereas the observed regression with early relapse might be based on so far unresolved mechanisms of tumor biology with rapid tumor regrowth after SBT, the phenomenon of pseudoprogression in the early FET-PET might be explained by SBT-induced disturbances of the blood-brain barrier and/or SBT-related initiation of reactive processes. Experimental data on the uptake of FET in cerebral radiation injury 29 suggest that FET uptake might partially be explained by a breakdown in the blood-brain barrier. This was confirmed in another FET-PET follow-up study after intracavitary radioimmunotherapy (RIT). Here, after RIT, a homogeneous uptake surrounding the resection cavity with correlating contrast enhancement was found in all patients. 12 Therefore, it is tempting to assume that disturbances of the blood-brain barrier with subsequently increased permeability have mainly contributed to the early increased FET uptake. However, given that our MRI findings and experimental and clinical data demonstrate a long-lasting disruption of the blood-brain barrier after SBT, other factors have to be considered for the explanation of this unspecifically early increased FET uptake.
Hence, we believe that the initially increased FET uptake at 3 months might be caused by other treatment-induced processes. In the initial phase after radio- and chemotherapy, transiently increased turnover of glucose has been observed on fluorodeoxyglucose (FDG)-PET scans and has been related to inflammatory processes with infiltration of macrophages.30,31 In contrast to FDG, however, animal studies have shown that the uptake of FET, which was shown to be mediated by the type L amino acid carrier, 32 was not exhibited in macrophages and inflammatory cells, promising higher specificity for the detection of tumor cells. 33 Thus, other inflammatory cellular components than macrophages must be involved in the FET uptake process after SBT. Experimental data have shown that treatment-induced circumscribed therapeutic radionecroses after SBT are surrounded by reactive glia and temporarily by fibrinoid necrosis of endothelial cells. These effects have been shown to occur early after irradiation, whereas progressive resorption of necrotic tissue by macrophages dominates the later phase after SBT.20,21 Accordingly, more or less activation of both microglia and astrocytes in the early phase after SBT might be the key factor for increased FET uptake for a considerable number of patients. It remains a matter of uncertainty whether activation of astrocytes or microglia had either occurred earlier (< 3 months) or later (between 3 and 6 months) or was just less pronounced in those treatment responders without pseudoprogression. Our hypothesis on increased early FET uptake is supported by previously published data on FET uptake in other processes involving microglia activation and reactive astrocytosis such as intracerebral demyelinating lesions and brain abscesses. 34 In the latter, diffuse increased FET uptake correlated with the area of reactive astrocytosis as demonstrated by glial fibrilary acidic protein staining.35,36 Furthermore, increased FET uptake has been found in early postischemic lesions, which come with microglial activation and reactive astrocytosis as well.35,37
More detailed histologic analyses of early posttherapeutic changes after SBT are warranted for a better comprehension of the underlying mechanism.
Increasing uptake kinetics does not exclude malignant tumor progression after multimodal treatment. Previous reports on FET-PET uptake kinetics have demonstrated high sensitivity and specificity values for tumor grading of both de novo and recurrent gliomas. Over time, increasing counts were seen in low-grade gliomas and decreasing counts in high-grade gliomas. 17 In the current study, 9 of 33 histologically proven recurrent high-grade gliomas exhibited increasing uptake kinetics at baseline evaluation, which somewhat contradicts previous findings. It is important to note, however, that a highly selected patient subpopulation was addressed harboring circumscribed and relatively small tumors and that all of these patients already experienced extensive multimodal treatment. The latter in particular might have caused therapy-related “benign” intratumoral tissue changes (ie, necrosis, gliosis), which might in part explain changes in uptake dynamics from decreasing to increasing TAC. Previous findings showed that one-third of patients, who had been treated with radiotherapy and subsequently underwent stereotactic biopsy to differentiate tumor recurrence from radiation necrosis, exhibited a mixture of both tumor tissue and radiation necrosis. 38 We assume that patients with increasing TAC were those with a higher posttherapeutic to viable tumor tissue ratio compared to those with decreasing TAC. As a consequence of this finding, any analysis of uptake kinetics should be done cautiously in high-grade glioma patients after multimodal treatment and should be supplemented by histologic evaluation.
Notwithstanding these limitations, TAC measured at baseline and during the follow-up period continued to be a powerful prognostic factor. Patients showing increasing uptake kinetics before or after SBT had a significantly longer LPFS than those with decreasing uptake values; additionally, those patients in whom uptake kinetics changed from decreasing to increasing values after SBT presented with favorable outcome and vice versa. Here, the same explanation as mentioned above can be applied: with decreasing tumor burden in favor of therapy-induced tissue changes, reflected by changes in tracer kinetics, the disease course ameliorates. Thus, evaluation of uptake kinetics might allow a prediction of therapy response and patients' outcome.
Conclusion
An early increase in FET uptake 3 months after high-dose irradiation might be associated with pseudoprogression in a considerable number of patients; it could be induced by benign treatment-related reactive changes (such as reactive astrocytosis and/or microglia activation) and should be interpreted cautiously. In contrast, increased FET uptake (SUVmax/BG and BTV) at the 6-month time interval after SBT or later indicates tumor progression or worse prognosis with high accuracy. Multivariately, the most powerful predictors for local disease control were the absence of viable tumor tissue according to PET criteria and increasing uptake kinetics 6 months after treatment. Dynamic studies should therefore be considered a valuable supplement to the standard method.
Footnotes
Acknowledgment
Financial disclosure of authors and reviewers: None reported.