
Abstract
The efficient cell-mediated immune response clears cells expressing deoxyribonucleic acid (DNA) immunogens, but there are no methods to monitor this in vivo. We hypothesized that immune-mediated clearance can be monitored in vivo if DNA immunogens are coexpressed with reporter(s). To test this, we designed genes encoding human immunodeficiency virus 1 (HIV-1) reverse transcriptase (RT) fused via its N- or C-terminus to 30–amino acid-long Gly-Ala-repeat of Epstein-Barr virus nuclear antigen 1 or via the N-terminus to the transport signal of invariant chain/Ii or inserted between the cytoplasmic and luminal domains of lysosome-associated membrane protein I (LAMP). DNA immunogens mixed with luciferase gene were injected into BALB/c mice with subsequent electroporation. Reporter expression seen as luminescence was monitored by in vivo imaging. When luminescence faded, mice were sacrificed, and their splenocytes were stimulated with RT-derived antigens. Fading of luminescence correlated with the RT-specific secretion of interferon-γ and interleukin-2. Both immune and in vivo imaging techniques concordantly demonstrated an enhanced immunogenicity of RT-LAMP and of the N-terminal Gly-Ala-RT fusion genes. In vivo imaging performed as an animal-sparing method to estimate the overall performance of DNA immunogens, predicting it early in the experiment. So far, in vivo imaging cannot be a substitute for conventional immune assays, but it is supplementary to them. Further experiments are needed to identify which arms of cellular immune response in vivo imaging monitors best.
GENETIC VACCINES, such as naked deoxyribonucleic acid (DNA) or recombinant viral vectors, represent a straightforward way to synthesize a selected microbial antigen and get it correctly folded and processed within the vaccine recipient to further induce a desired immune response. Genetic vaccines have been successfully applied in various animal models,1,2 including large species such as horses and dogs.3–8 In the early decades of gene immunogen development, the potency of DNA immunogens was assessed in groups of animals immunized by different doses, routes, and schedules to find a combination that would induce the desired immune response. In rodents, too few immune cells could be isolated from blood samples. Consequently, to obtain enough splenocytes for a comprehensive set of immune assays, animals had to be sacrificed at each time point. Matters were improved by the introduction of molecular reporters, such as β-galactosidase, or green fluorescent protein, which could at least document the efficacy of gene delivery.9,10 However, this still required invasive monitoring of tissues from gene inoculation sites. In vivo imaging, first used to analyze the expression of bacterial genes in living mice, 11 represented an attractive, noninvasive way to evaluate the expression (and, hence, the delivery) of gene immunogens in live animals. 12 With in vivo imaging, it was possible to monitor the in vivo expression of immunogens either labeled or coadministered with the reporters, the most sensitive coming from the luciferase (Luc) family.11,13–16 This technique allowed quantification of gene transfer and expression in various tissues and organs of mice, rats, hamsters, and guinea pigs.17,18 In vivo luminescence highly correlated to in vitro measurements of the reporter activity in the transfected tissues and was perfect for the optimization of gene vaccine delivery.18–20
It was noted that when reporters were introduced alone, their expression at the sites of injection continued for a long time, which depended on the life span of the expressing cells and the promoter activity.21–23 Injection of the Luc gene leads to the local Luc expression, which reaches its maximum 7 to 10 days after gene administration20,24 and lasts for more than 60 days (5-19 months).22,25 However, if the reporter gene was administered together with another gene/gene immunogen, the initially strong Luc expression weakened rapidly, whereas little weakening was observed if the reporter was administered with a noncoding DNA. 22 In case of nontoxic gene products, it was assumed that the disappearance of luminescence (referred to here as fading) reflects the immune clearance of cells coexpressing immunogen and reporter.19,22,26 The effect was observed for different gene-based vaccines, plasmid as well as viral.19,22,26–29 This suggested the possibility of using the in vivo imaging technique to assess the integral (mostly cellular) immunogenic performance of genes. However, the immune correlates of luminescence fading had to be specified before the method could be used in practice.
We applied the in vivo imaging technique to characterize a panel of DNA immunogens based on human immunodeficiency virus 1 (HIV-1) reverse transcriptase (RT). First, we confirmed the applicability of an in vivo imaging system (IVIS) for monitoring immunogenicity on the example of previously described gene immunogens: a weakly immunogenic wild-type RT gene and a strongly immunogenic gene encoding drug-resistant RT inserted between the luminal and transmembrane cytoplasmic domains of lysosome-associated membrane protein I (RT1.14-LAMP). 30 Next, we applied in vivo imaging in parallel to the conventional immune assays to characterize the performance of novel gene chimeras in which RT was fused to the lysosome transport signal of invariant chain (Ii)31–33 or to the Gly-Ala repeat (GAR) of Epstein-Barr virus nuclear antigen 1 (EBNA-1).34–37 The GAR region is involved in the inhibition of proteasomal processing of EBNA-1 and of the chimeric GAR-carrying proteins.34–37 Consequently, the presence of the GAR domain hinders the development of a cytotoxic T lymphocyte (CTL) response to GAR carriers. 38 However, it also predisposes them to improved recognition by CD4+ T cells.39,40 This inspired an attempt to use GAR as a signal influencing antigen processing and presentation. For these chimeras, too, fading of luminescence correlated with the induction of cellular immune response. For gene immunogens, the in vivo imaging could adequately describe the immunization outcome or cumulative effects of different, mostly cellular, components of the immune response (integral immunogenicity) within the first 15 days from gene inoculation.
Materials and Methods
Proteins and Peptides
RT genes of HIV-1 HXB2 (RT; Gene Bank accession number AAB50259) and of HIV-1 MN isolated from patient J14562 treated with lamivudine, stavudine, saquinavir, and ritonavir (RT1.14)41,42 were recloned into a two-cistronic vector as described 43 to generate vectors for bacterial expression named pET-2c-RT and pET-2c-RT1.14. Proteins were expressed in Escherichia coli and purified by affinity chromatography as previously described. 44 The immune assays employed peptides representing amino acids 375 to 389 (ITTESIVIWGKTPKF) and amino acids 528 to 543 (KEKVYLAWVPAHKGIG) of RT: peptide GFQSMYTFV, representing the immunodominant H2-Kd restricted epitope of luciferase, 45 and control peptides YPYDVPDYA from influenza virus, PASAYQVRN from human hepatitis C virus (HCV), TTAVPWNAS from gp160 protein of HIV-1, and VMPPGATTALTDHWPI from human β3-adrenergic receptor. Peptides were purchased from GL Biochem Ltd (Shanghai, China) and ProImmune Ltd (Oxford, UK). In T-cell tests, control and RT peptides were pooled in equimolar amounts. RT peptides were also tested individually.
DNA Immunogens
Plasmids for eukaryotic expression of firefly luciferase (pVax-Luc), wild-type RT (pCMVRT), RT, and RT1.14 fused to lysosome-associated membrane protein I (pKCMVRT-LAMP and pKCMVRT1.14-LAMP) have been described previously.22,41,42 Coding sequences for a 30–amino acid long GAR of EBNA-1 and the first 30 amino acids of human invariant chain (Ii) were assembled using synthetic oligonucleotides (Sigma, St. Louis, MO, or Sintol, Moscow, Russian Federation; Table S1 available in the online version only). The gene encoding RT-Ngar was generated by inserting DNA encoding GAR (GAR-W25; see Table S1) into the RT gene after the codon for W25. For this, pCMVRT was cleaved with MscI (Fermentas, Lithuania) and blunt-end ligated with GA-W25, yielding pCMVRT-GA30-N. For inserting GAR into the C-terminus of RT, the RT coding sequence was amplified with Pfu polymerase (Fermentas) from primers carrying cleavage sites SalI/BsiWI (RT-SalI-BsiWI-F) and BamHI/EcoRI with deleted stop codon (RT-delStop-BamHI-EcoRI-R; see Table S1). The amplified RT encoding sequence lacking the stop codon was cloned into the vector plasmid pKCMV 46 cleaved with SalI and EcoRI (Fermentas). The resulting plasmid was digested with BamHI and EcoRI to insert DNA encoding GAR (GAR-C; see Table S1). Ligation generated plasmid pKCMVRT-GA30-C, which carried the chimeric gene of RT-Cgar with a reconstructed stop codon.
Synthetic Oligonucleotides Used in the Design of Reverse Transcripase Gene Chimeras

Ii encoding DNA (Ii DNA) was generated by polymerase chain reaction with Pfu polymerase, using as a template three ligated oligonucleotides, Ii_1-45, Ii_46-90, and Ii-mid, and primers Ii-F and Ii-R (see Table S1). The RT gene was amplified with Pfu polymerase, using primers carrying cleavage sites SalI/BsiWI and BamHI/EcoRI (RT-SalI-BsiWI-F and RT-BamHI-EcoRI-R, respectively; see Table S1). The amplified RT encoding sequence was cloned into SalI/EcoRI-cleaved pKCMV, generating pKCMVRT. This plasmid digested with SalI and BsiWI was ligated to Ii DNA to yield pKCMVRT-Ii.
Eukaryotic Expression of RT Chimeras
HEK293 cells were cultured in Dulbecco's Modified Eagle's Medium (DMEM) supplemented with 10% fetal bovine serum (FBS) (both from Invitrogen Corporation, Carlsbad, CA). Cells were transfected using Lipofectamine-LTX (Invitrogen) according to the manufacturer's instructions. Cells were lysed 48 hours posttransfection and analyzed by Western blot as previously described. 47 Expression of RT chimeras was detected using polyclonal rabbit anti-RT serum.
DNA Immunization of Mice
BALB/c (H-2d) mice (females, 8 weeks old) were purchased from Charles River Laboratories (Sandhofer, Germany) and housed at the animal facility of Karolinska Institutet, Stockholm, Sweden. Mice grouped three to four were intradermally injected on the left and right sides of the back near the base of the tail with a mixture of 10 μg of DNA immunogen and 10 mg of reporter pVax-Luc in 25 μL phosphate-buffered saline (PBS). Control mice received 10 mg of empty vector and 10 mg of pVax-Luc. Two additional groups of mice (n = 5) received 10 and 100 μg of pVax-Luc alone. Injections were done using a 29-gauge insulin-grade syringe (Micro-Fine U-100, BD Consumer Healthcare, Franklin Lakes, NJ). Immediately thereafter, a needle array electrode, consisting of two parallel rows of four 2 mm pins (1.5 × 4 mm gaps; formerly Cyto Pulse Sciences, Glen Burnie, MD, now Cellectis, Romainville, France), was placed over the knob/protrusion, and voltage was applied. Electroporation was performed using the Derma Vax DNA vaccine delivery system (Cyto Pulse Sciences/Cellectis) with a regimen optimal for rodents (2 pulses, 1,125 V/cm, 50 μs + 8 pulses, 275 V/cm, 10 μs 48 ). Six days later, mice were boosted intramuscularly with antigen-encoding plasmids, administered as two injections of 50 mg DNA in 50 mL PBS in the left and right anterior tibialis. At days 4, 9, 15, 21, and 27 after priming, mice were monitored by IVIS (see below). At day 28, mice were bled and sacrificed, and their spleens were collected. The main experiments were repeated twice, with concordant results.
All experiments were approved by the Swedish National Board for Laboratory Animals. Prior to intradermal injection, electroporation, and bleeding, mice were anesthetized with 2 to 2.5% isoflurane delivered in the 7 L inhalation chamber (Baxter Medical AB, Kista, Sweden). During live imaging, mice were maintained under 2 to 2.5% isoflurane administered via nasal masks. At the end of the experiment, mice were anesthetized and sacrificed by cervical dislocation.
Monitoring Reporter Expression by In Vivo Three-Dimensional Optical Imaging
In vivo monitoring of reporter gene expression was initiated 4 days after priming and continued every 5 to 6 days until photonic emission decreased to the level of 104 photons/s/cm2. The monitored area was regularly shaved. To monitor luciferase expression in vivo, mice were injected intraperitoneally with 15 mg/mL solution of D-luciferin potassium salt (Caliper Life Sciences, Hopkinton, MA) dissolved in PBS (100 μL per 10 g body weight), allowed to move freely for 5 minutes, and kept under anesthesia for another 5 minutes. After that, mice were transferred into the In Vivo Imaging Technique System 200 chamber (IVIS200, Caliper Life Sciences). Assessment of photonic emissions (photons/s/cm2) was performed for 1 minute. Luminescent and photographic images were captured, and the overlay of images was made using Living Image software version 2.50.1 (Caliper Life Sciences).
To quantify the photon emission, a universal frame was selected that was sufficient to engulf each of the (single) photon-emitting areas registered throughout the experiment (cross groups and time points). The frame was applied to all images in the series, and photons emitted from the given area per minute were acquired. Data within one time point were presented as an average of two sites in one mouse, as well as of all sites in the group of mice. Background luminescence, determined by measuring luminescence from the luciferin-injected naive mice, was low (< 200 pixels/s/cm2).
Assays of T-Cell Response
Spleens were homogenized individually in RPMI 1640 supplemented with penicillin/streptomycin (PEST), 2 mM L-glutamine, and 10% fetal calf serum (all by Invitrogen). Cells were washed once with PBS, resuspended in RPMI-20% FBS, and used in interferon-γ (IFN-γ) and interleukin (IL)-2 specific ELISpots (kits from Mabtech, Stockholm, Sweden). In brief, 250,000 splenocytes were added per well and stimulated with recombinant RT or RT1.14 (1, 2.5, and 12.5 μg/mL), single or pooled peptides (10 μg/mL), medium alone, or concanavalin A (ConA, 5 μg/mL) as a positive control. The number of cytokine-producing spot-forming cells (SFCs) per million splenocytes was evaluated using the AID ELISpot reader system (Autoimmun Diagnostika GmbH, Strassberg, Germany). For each animal, a net SFC/106 cells in response to each antigen was calculated by subtracting the background response induced by the medium. The response to an antigen was considered specific if it was higher than the mean net SFC/106 of this group in response to the control peptide plus 3 SD and exceeded the response to the given antigen in the control group of mice injected with Luc reporter and empty vector twofold.
Supernatants from splenocyte stimulation (50 mL/well) were withdrawn prior to ELISpot development; the contents of the duplicate wells were pooled. Pools were analyzed for IFN-γ and IL-4 using respective sandwich enzyme-linked immunosorbent assay (ELISA) kits (Mabtech). Net levels of cytokine secretion in response to specific antigens in a group were calculated after subtraction of the level of cytokines secreted by this group in response to the medium or to the control peptide (the highest of the values selected). Levels of in vitro IFN-γ secretion detected by ELISA correlated with those registered by ELISpot (R = .50 to .61, p < .05, Spearman rank test).
RT-Specific Antibody Response
Ninety-six-well microtiter plates (Nunc MaxiSorp, Odense, Denmark) were coated with 0.3 μg/mL RT or RT1.14, and serum levels of specific total mouse immunoglobulins and IgG were analyzed by ELISA as previously described. 47 Cutoff for specific anti-RT antibody response at each time point was set to the mean optical density values of the control animals collected at this time point plus 3 SD. For positive sera, end-point dilution titers of antibodies were calculated from the titration curves.
Statistics and Software
Western blot images were quantified using ImageJ software (National Institutes of Health, Bethesda, MD). Quantification of the photon emission was done with Living Image software version 3.2. Nonparametric statistics was chosen as appropriate for sample sizes < 100. 49 Continuous but not normally distributed variables, such as the average radiance in photons/s/cm2, antibody titers, the number of cytokine-producing SFCs, or cytokine levels in pg/mL, were compared by the nonparametric Kruskal-Wallis and Mann-Whitney U tests. Linear correlations between the variables were obtained using the Spearman rank-order test. To run the statistical analysis, raw immunogenicity and luminescence data were assembled into a database uniting the results of the described experiments done using one and the same immunization protocol and identical methods of screening. We assumed that the analysis of correlations observed for the raw data would adequately reflect the true interdependence between the parameters, specific or nonspecific, because we could not exclude the fact that changes in luminescence can at least in part be induced by immunogenunspecific mechanisms linked to innate immunity and inflammation. Statistical evaluations were done using STATISTICA AXA 8.0 (StatSoft Inc., Tulsa, OK).
Results
In Vivo Imaging Data Correspond to the Results of T-Cell Immune Assays
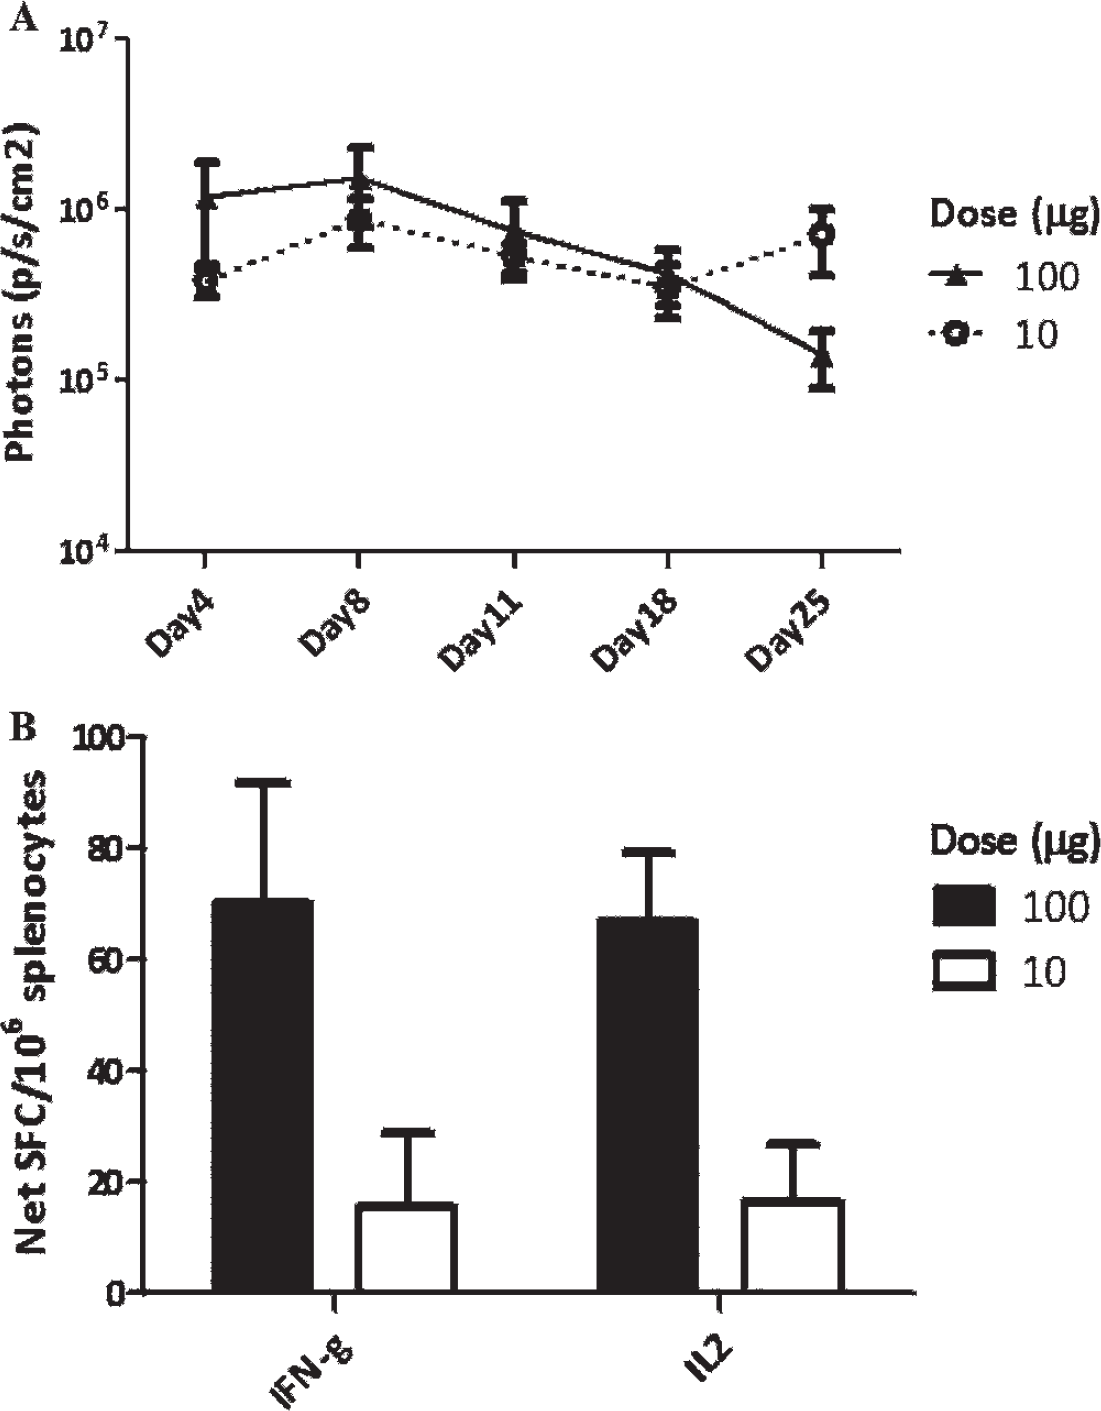
First, we examined the applicability of the in vivo imaging technique for monitoring the induction of immune response to the already characterized RT-based DNA immunogens. We chose the genes of the wild-type RT as a weak immunogen and of RT1.14-LAMP as an effective immunogen. BALB/c mice (n = 3–4) were immunized with RT genes mixed in priming with the reporter gene of firefly luciferase (Luc). The luciferase activity at the injection sites was measured by in vivo imaging that reflected the efficacy of delivery and subsequent expression of the reporter (Figure 1, A and B); the immune response against RT was assessed by IFN-γ ELISpot (Figure 1C).

Follow-up of the immunogenicity of gene immunogens using the in vivo imaging technique (A, B) and standard immune assay (C). The activity of luciferase reporter after the intradermal administration of Luc gene together with the reverse transcriptase (RT) or lysosome-associated membrane protein I (RT1.14-LAMP) gene or an empty vector (control) assessed by in vivo imaging. Representative composite images of two injection sites per group demonstrating luminescence (in photons/s/cm2) overlaid with the photo image; the luminescence scale is given to the right (A). Quantification of images (B). Development of an RT-specific T-cell response to RT assessed by interferon-γ (IFN-γ) ELISpot (represented by the total number of IFN-γ spots per 106 splenocytes generated in response to stimulation of mouse splenocytes by RT peptides amino acids 375 to 389, amino acids 528 to 543, and recombinant RT protein) (C).
Mice immunized with the RT gene exhibited a luminescence profile similar to that of vector-immunized mice (see Figure 1, A and B) and no RT-specific IFN-γ response (see Figure 1C). RT1.14-LAMP gene injection led to a significant fading of luminescence by day 15 (see Figure 1, A and B). Luminescence fading in RT1.14-LAMP-immunized mice coincided with strong IFN-γ production registered by the ELISpot test (see Figure 1C). Next, we applied the in vivo imaging technique to compare the performance of new DNA immunogens.
RT Chimeras: Design and Expression in Cell Culture
We designed a series of chimeras in which the wild-type RT gene was fused to short sequences known or expected to improve its immunogenic performance. Specifically, we chose the minimal lysosome targeting signal contained in 30 amino acids of the invariant chain of major histocompatibility complex (MHC) (Ii) and the 30–amino acid long GAR of EBNA-1. Ii signal was added to the N-terminus of RT (RT-Ii) for the lysosomal targeting of resulting chimeras,32,33 and GAR was inserted into either the Nor the C-terminus of RT (RT-Ngar or RT-Cgar, respectively; Figure 2A). To test their expression, HEK293 cells were transiently transfected with plasmid DNA and cell lysates were analyzed by Western blot with polyclonal anti-RT antibodies. All novel RT chimeras were expressed at similar levels (Figure 2B).

Schematic representation of reverse transcriptase (RT) and RT chimeric proteins (A). Expression of RT chimeras in cell culture (B): Western blot of HEK293 cells transfected with RT-encoding plasmids. Blots were sequentially stained with polyclonal anti-RT 6 and anti-actin antibodies (bottom). The ladder to the right shows molecular mass markers, in kilodaltons.
DNA Immunization and Follow-up of Gene Expression In Vivo
Next, we examined how the attachment of these signals influenced the performance of RT in gene immunization. Properties of novel RT chimeras were compared to those of RT chimeras targeted to MHC class II by fusion to cytoplasmic and transmembrane domains of LAMP. 30 In in vivo imaging experiments, we assessed luminescence from the injection sites at days 4, 9, 15, and 21 (Figure 3A), calculated the relative luminescence at days 9 to 21 to that at day 4, and compared the relative fading of luminescence between the groups (Figure 3B). The capacity to induce fading of luminescence increased in a row: RT-Cgar ≤ RT-Ii < RT-Ngar < RT-LAMP (see Figure 3B). Coadministration of Luc and RT genes, or Luc gene with empty plasmid, induced significantly lower fading; the difference was specifically pronounced at day 15 (p < .05; see Figure 1B and Figure 3C). No fading was observed in response to a 10 μg dose of Luc gene alone (Figure S1A available in the online version only).

Activity of luciferase reporter after the intradermal administration of Luc gene together with DNA immunogens RT-Ngar, RT-Cgar, RT-Ii, and RT-LAMP or empty vector (control), assessed by in vivo imaging. Representative composite images of two injection sites per group of three to four mice demonstrating luminescence (in photons/s/cm2) overlaid with the photo image; the luminescence scale is given to the right (A). Average luminescence for all injection sites per group at days 9, 15, and 21 related to the average luminescence at these sites by day 4, in percent (B). Average luminescence (in photons/s/cm2) at an injection site by day 15; values significantly different from those in vector-immunized mice (p < .05) are marked with arrows (C).
Development of Luc-specific immune response in control mice receiving 10 or 100 mg of Luc gene. Fading of luminescence (A) and production of IFN-γ and IL-2 after in vitro stimulation of splenocytes with a peptide representing the immunodominant epitope of Luc GFQSMYTFV (B). 45
Immune Response against HIV-1 RT
When photon emission at the injection sites decreased to the level of 104 photons/s/cm2 (by day 27 after priming), mice were bled and sacrificed, and their splenocytes were subjected to in vitro T-cell tests (ELISpot and cytokine ELISA). Tests assessed IFN-γ, IL-2, and IL-4 production in response to stimulation with recombinant RT and peptides representing amino acids 375–389 and 528–543 of RT, both characterized as promiscuous T-cell epitopes in BALB/c mice.50–52 In the RT-immunized mice, the number of IL-2-secreting splenocytes did not differ from that in the vector-immunized group. Low levels of IL-2 secretion were detected in the RT-Ii and RT-Cgar gene recipients. The highest RT-specific IL-2 secretion was induced in mice receiving RT-Ngar gene; here the IL-2 levels were almost twice those in the recipients of the RT-LAMP gene (Figure 4A). Overall, the IL-2 response to in vitro stimulation with RT antigens increased in a row: RT << RT-Cgar < RT-Ii < RT-LAMP < RT-Ngar (see Figure 4A). Mice receiving the Luc gene (alone as a control immunization) developed no Luc-specific IL-2 response, indicating nonimmunogenicity of the reporter gene; a weak response against Luc was raised only after a 10-fold increase in the Luc-gene dose (Figure S1B available in the online version only). Specific secretion of IL-4 was observed in mice receiving RT-GAR gene chimeras and in RT-Ii mice in response to the individual RT-derived peptides (Figure 4B and Figure 5, and data not shown). RT-specific secretion of IL-2 and of IL-4 was correlated (R = .55–.7; p < .05; Figure S2A available in the online version only). All RT gene chimeras (but not the wild-type RT gene) induced weak IFN-γ secretion with total production levels of 10 to 40 pg/mL (or < 100 IFN-γ net spots/106 cells; Figure 4C and Figure 5 and data not shown). The capacity to induce RT-specific IFN-γ production increased in a row: RT-Cgar < RT-Ngar ≤ RT-Ii ≤ RT-LAMP. No specific IFN-γ response was induced by Luc gene alone (at a 10 mg dose; see Figure S1B). Secretion of IFN-γ in response to each individual antigen, as well as to different RT-derived antigens, was directly correlated to secretion of IL-2 (R = .42–.68, all p's < .05); no such correlation was observed in response to the control antigen (see Figure S2B). Mouse sera collected at the end of the experiment were analyzed for anti-RT antibodies. The highest anti-RT IgG and total Ig levels were raised in mice immunized with RT-Ii and RT-LAMP gene fusions. The average level of total anti-RT immunoglobulins did not exceed 5 × 10³ (see Figure 5). No antibody response was registered in the recipients of the RT gene (see Figure 5).
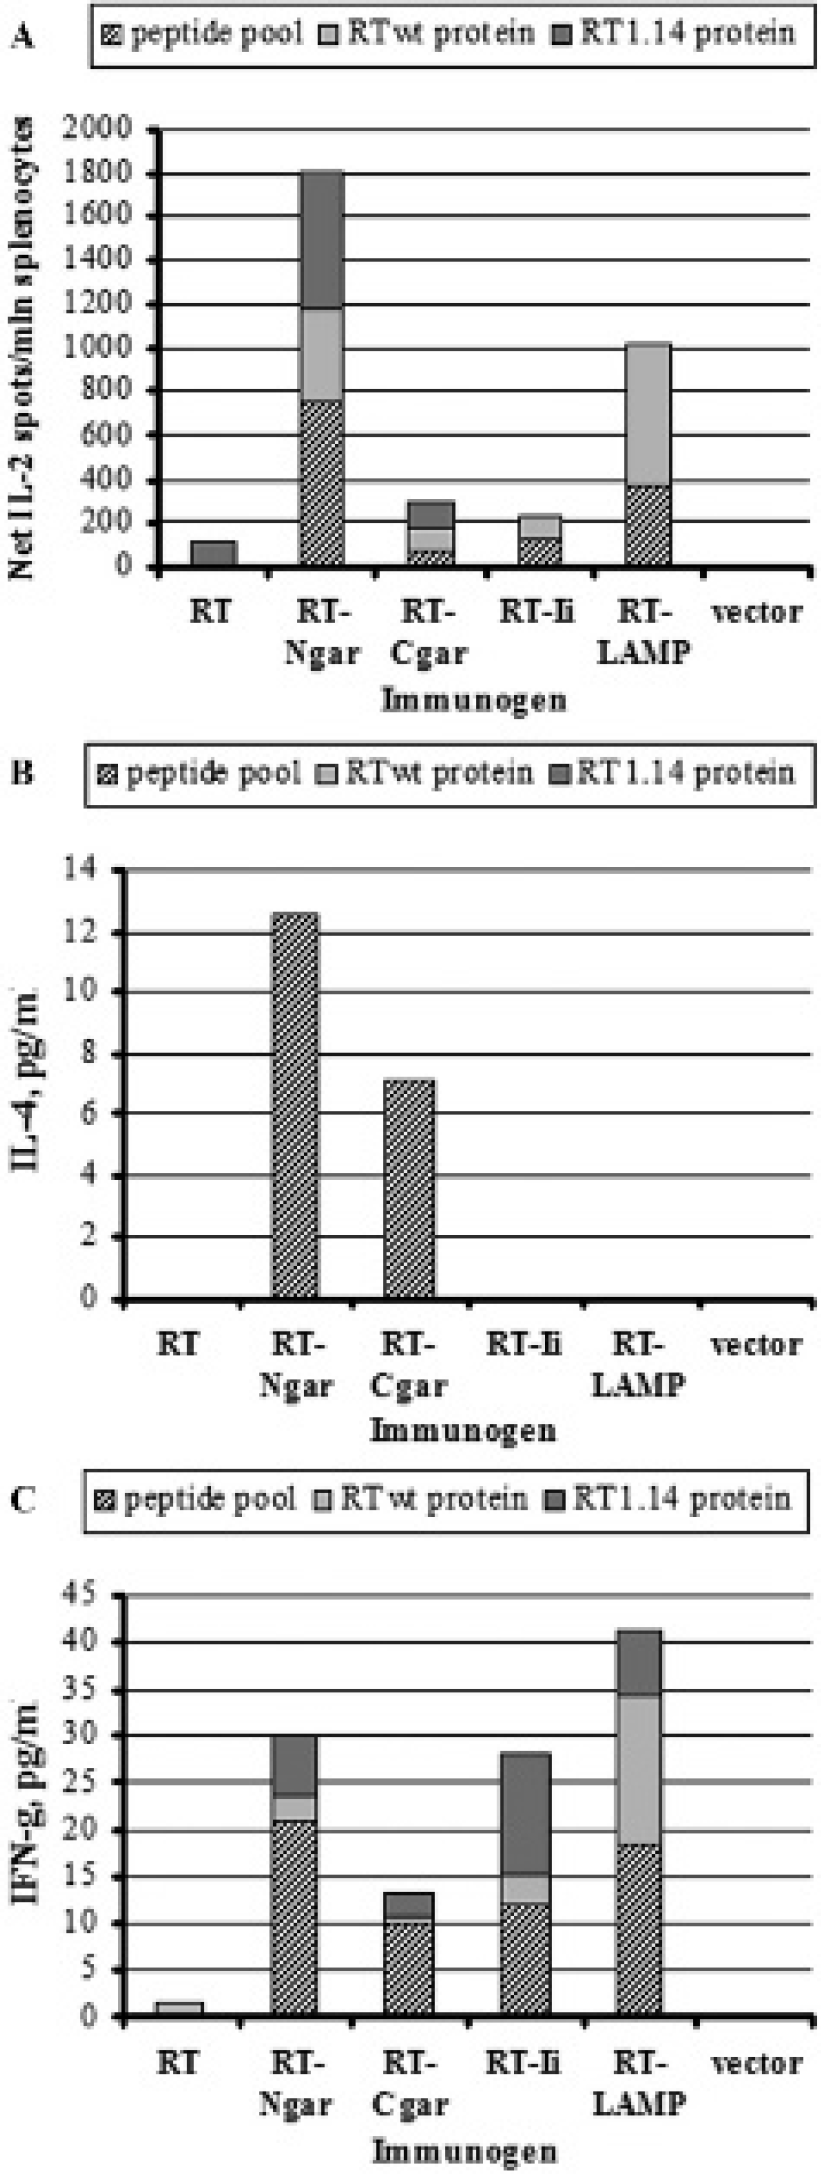
Secretion of cytokines by splenocytes of mice immunized with reverse transcriptase (RT) gene chimeras after in vitro stimulation with recombinant wild-type RT, patient-derived RT variant (RT1.14), and pooled RT-derived peptides amino acids 375 to 389 and 528 to 543 (peptide pool): interleukin (IL)-2 (A); IL-4 (B); and interferon-γ (IFN-γ) (C). Splenocytes of immunized mice were stimulated with RT-derived antigens, and the amount of secreted cytokines was measured by ELISpot (A) or enzyme-linked immunosorbent assay of cell culture fluids after the proliferation test (B, C). Values presented for each antigen represent the mean of raw signals (spots or cytokine secretion levels) generated in response to a given antigen in immunized mice from which we subtracted an average signal induced by this antigen in the control mice. Stapling resulting in the bars of different length reflects the cumulative cytokine production.

Interrelation of in vitro reverse transcriptase (RT)-specific cytokine secretion by splenocytes of mice immunized with RT gene chimeras: interleukin (IL)-2 (ELISpot) and IL-4 (enzyme-linked immunosorbent assay) in response to stimulation of splenocytes with recombinant RT (A); interferon-γ (IFN-γ) and IL-2 (both by ELISpot) in response to stimulation of splenocytes with medium, control antigen, amino acids 528 to 543 of RT, and recombinant RT (B).

Antibody response elicited by immunization with reverse transcriptase (RT)-based gene chimeras shown as an average titer of total anti-RT immunoglobulins and anti-RT IgG. Antibody levels in all recipients of RT gene chimeras significantly exceeded that in the control mice (all ps < .05).
Correlation of In Vivo Imaging and Immune Response Data
Next, we looked for correlations between the emission of luminescence at different time points of immunization and the parameters of immune response by the end of the experiment (when maximal fading of luminescence was reached). From day 15, fading of luminescence was positively correlated to the IFN-γ levels (n = 33, R = .5–.6, all ps < .05; Figure 6A). No correlation was observed between the luminescence and secretion of IFN-γ in response to the control antigen (R = –.1–.1; all p's > .1; data not shown). RT-specific in vitro IL-2 secretion (as detected by the end of the experiment) initially demonstrated a weak direct correlation to the luminescence levels, indicating that the efficient immunogen delivery/expression promotes an enhanced immunogen-specific IL-2 production (day 9, n = 33, R = .43–.47, p < .05; Figure 6B). However, starting from day 15, the correlation turned into an inverse as the enhanced production of IL-2 directly correlated to the fading of luminescence (weakly at day 21, R = −.36; stronger at day 27, R = −.48; both p's < .05; see Figure 6B). No correlation was observed between luminescence at days 4 to 27 and in vitro IL-2 production in response to the control antigen (R = .068.–171, all p's > .1; data not shown). A different pattern was observed between the luminescence and production of IL- 4. A weak direct correlation of RT-specific IL-4 secretion to luminescence was seen on day 4; it was inversed by day 15 (similarly to observations made for IFN-γ and IL-2, but weaker; R = −.46, p < .05) and again inversed, that is, reversed back to a direct correlation by day 27 (R = .55, p < .05). We can speculate that the IL-4 response may depend on the long-term expression of DNA immunogens in the tissues and, therefore, cannot be directly assessed by the in vivo imaging technique. The induction of anti-RT antibodies had no effect on the luminescence levels.
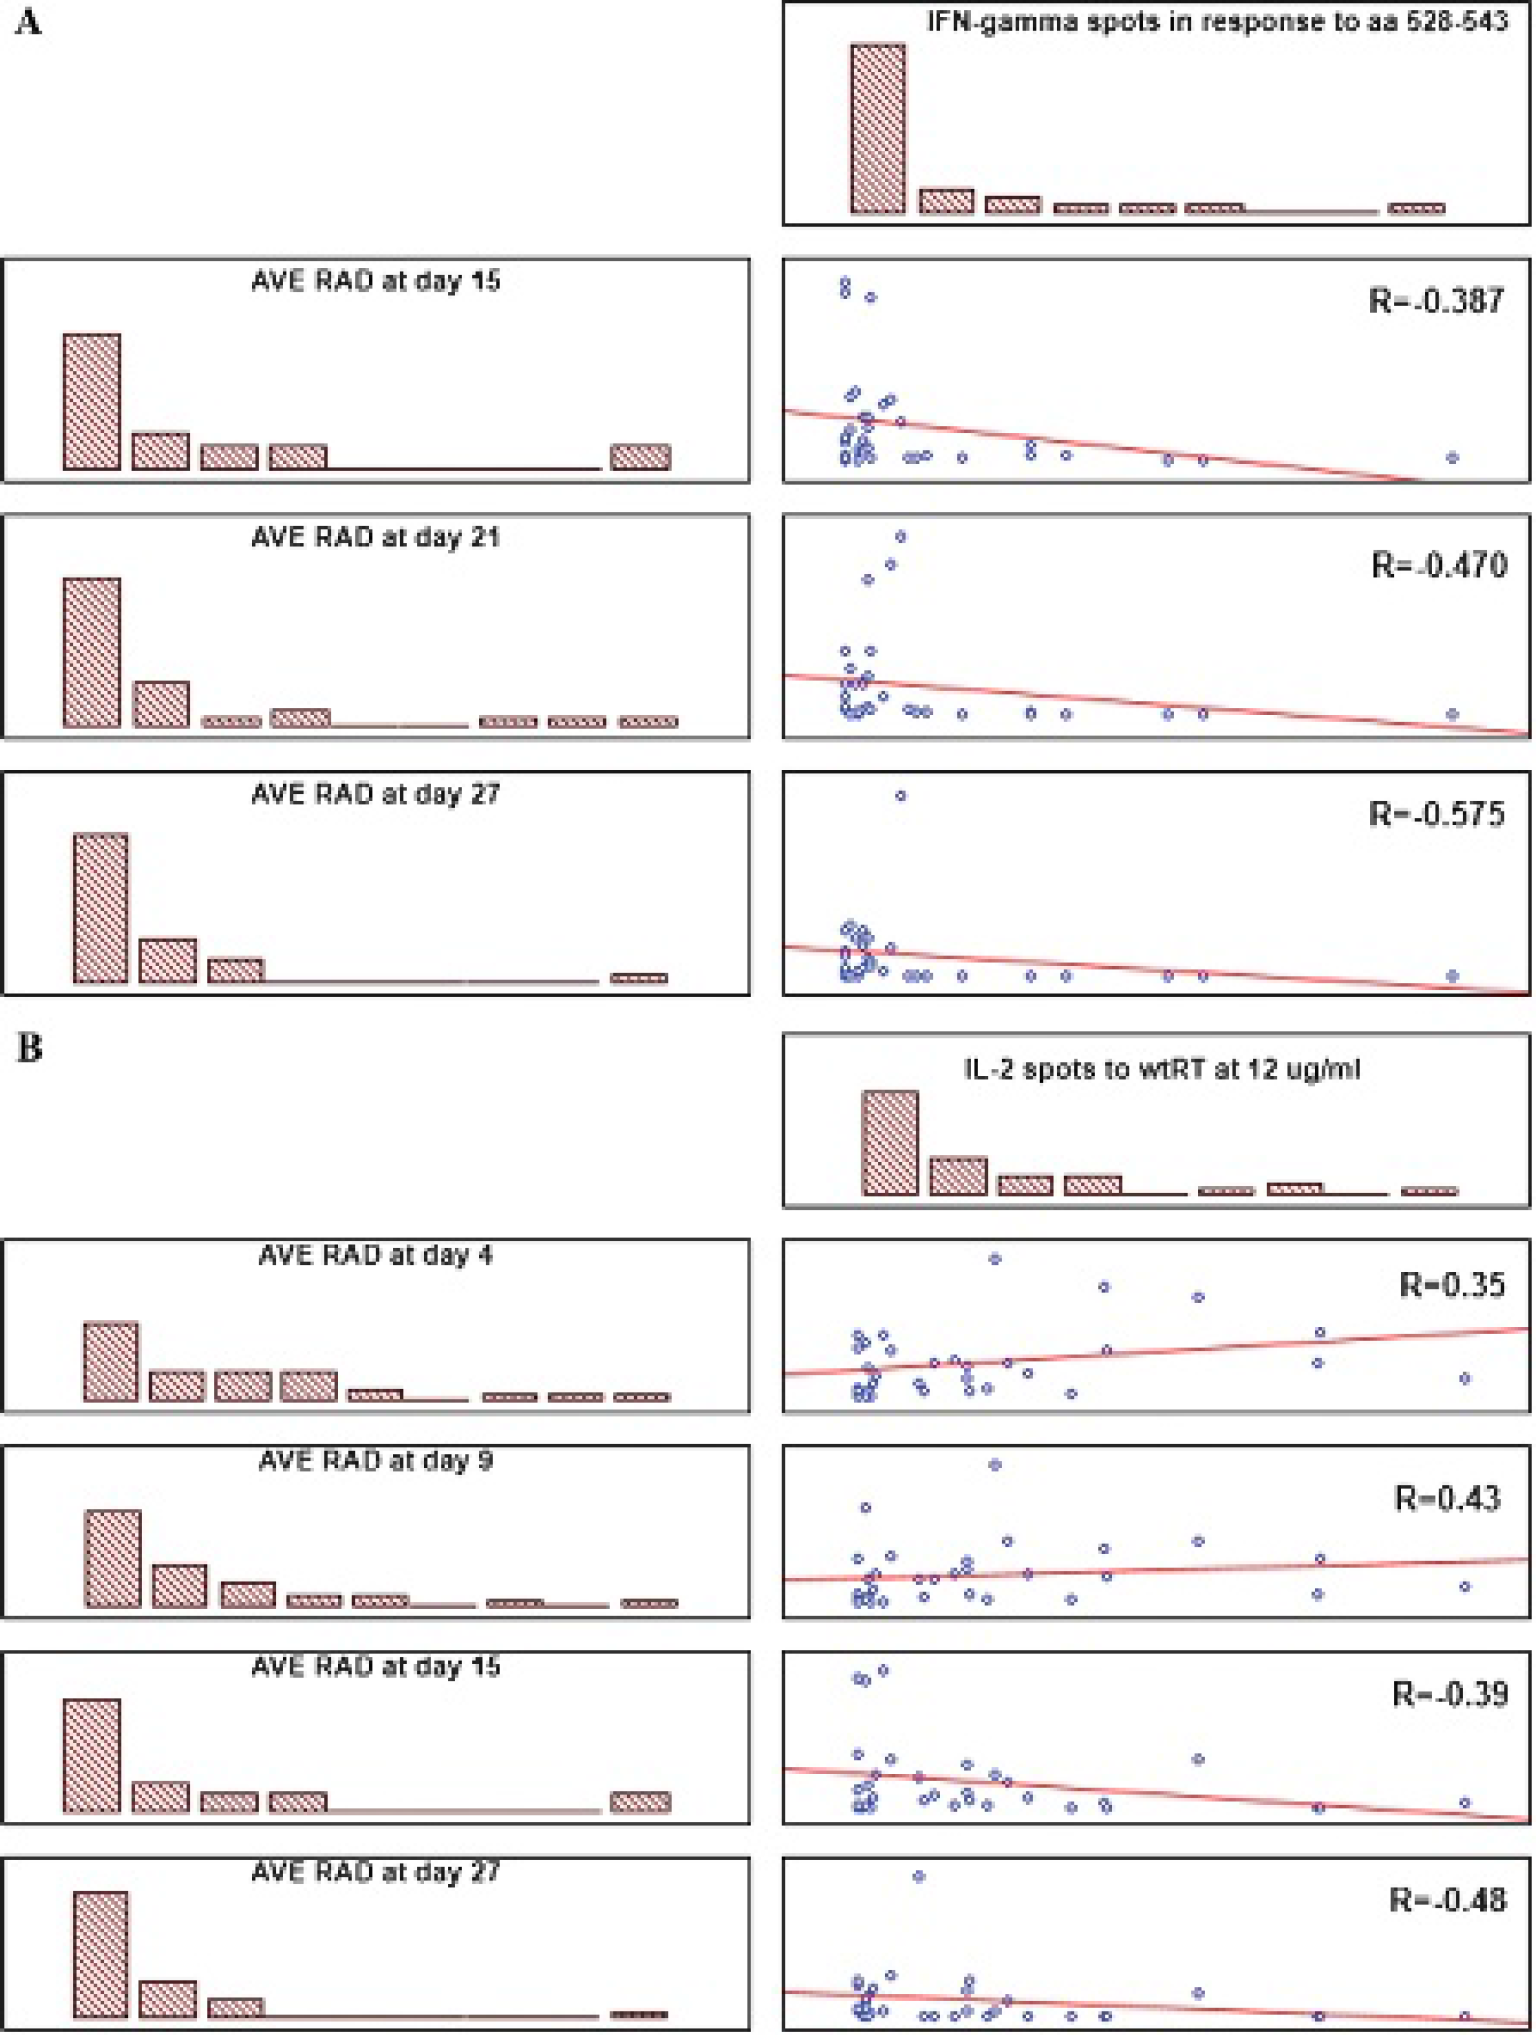
Linear correlation of luminescence registered in mice on days 4 to 27 to the levels of cytokines interferon-γ (IFN-γ) (A) or interleukin (IL)-2 (B) secreted on day 27 by splenocytes of the same mice stimulated with peptide representing amino acids 528 to 543 of reverse transcriptase (RT) (A) or recombinant RT at 12 μg/mL (B). X-axis, the level of in vitro cytokine secretion in net spots per 106 cells; y-axis, the average radiance per two sites per mouse in photons/s/cm2. Histograms built by STATISTICA AXA show the distribution of each parameter.
Profile of Cellular Response against CD4+ T-Cell Epitopes of RT
Regions between RT amino acids 375 to 389 and 528 to 543 contain known T-helper cell epitopes in mice and CTL epitopes in humans.50–52 The pattern of cytokine secretion in response to these peptides would thus reflect the mode of action of each of the RT gene chimeras. A weak to moderate antipeptide IFN-γ response was detected in all groups. In vitro stimulation with RT amino acids 375 to 389 induced potent IL-2 secretion in mice immunized with GAR and Ii gene chimeras but not in those receiving the RT-LAMP gene (Figure 7). The highest peptide-specific IL-2 secretion was observed in the recipients of RT-Ngar gene (see Figure 7). In vitro IL-4 secretion was detected in mice receiving genes of RT-Ngar and RT-Ii, whereas antipeptide response in the RT-LAMP recipients totally lacked the IL-4 component (see Figure 7). A similar profile of cytokine secretion was observed in response to the mouse CD4+ epitope located at amino acids 528 to 543 (data not shown). No in vitro T-cell response to RT peptides was detected in either control or RT gene-immunized mice (see Figure 4).

Secretion of cytokines by splenocytes of mice immunized with reverse transcriptase (RT) gene chimeras RT-Ngar (A); RT-Cgar (B); RT- Ii (C); and RT-LAMP (D) after in vitro stimulation with a peptide representing amino acids 375 to 389 of RT, representing a known T-helper epitope in BALB/c mice.32,48 interferon-γ (IFN-γ) and interleukin (IL)-2 responses are given in net spots per 106 cells and IL-4 response as net production in pg/mL.
Discussion
In this study, we completed the conventional immune assays with in vivo imaging of expression, for the first time using the latter to quantitatively assay the performance of gene immunogens. We assumed that the efficacy of DNA immunization can be indirectly assessed if we deliver gene immunogen together with a reporter gene, the expression of which can be monitored in vivo. The reporter and the immunogen genes enter cells with similar efficacy, colocalizing to the same or neighboring cells, the activity of the reporter reflecting the efficacy of DNA immunogen delivery and expression. Independently, it was shown that the development of the immune response leads to extermination of cells expressing the immunogens.24,26,28 Persistence of the reporter activity would then indicate low or no immunogenicity, and its rapid disappearance, a good immunogenic performance of the codelivered gene (the reporter itself has to be nonimmunogenic). Playing simply a reporter role (not influencing the immunogenicity), it can be easily removed from the vaccine preparation at the clinical trial stage.
We verified this on an example of two previously characterized gene immunogens: a weak one, HIV-1 RT, and a strong one, drug-resistant RT fused to the cytoplasmic and transmembrane domains of RT1.14-LAMP. 30 For this, we immunized mice with these genes mixed with the plasmid encoding one of the best delivery/expression reporters used so far, Luc. 53 By monitoring sites of plasmid injections after immunization, we could show that genes were delivered efficiently. RT and LAMP (as well as Luc) are not toxic to the expressing cells.53–55 In keeping with this, the reporter expression steadily increased up to day 9 (toxicity, on the other hand, would have led to an early non–immune-mediated elimination of expressing cells). Thus, we got a good set-point to monitor the immune-mediated fading of luminescence. Specifically, we could compare the dynamics of in vivo Luc expression in mice receiving the reporter mixed with a strong and a weak gene immunogen and relate the expression profile to plasmid immunogenicity. Monitoring of the injection sites demonstrated that coadministration of Luc reporter with the strongly immunogenic RT1.14-LAMP gene led to rapid disappearance of Luc expression, seen as luminescence fading, whereas no fading (over that seen in vector-immunized mice) was observed in mice receiving the weakly immunogenic RT gene.
Next, we applied this technique to characterize the immunogenicity of novel HIV-1 RT gene chimeras, in which RT was fused to the lysosome transport signal of Ii31–33 or to the GAR of EBNA-134–37 (RT-Ii, RT-Ngar, RT-Cgar). Their immunogenic performance was compared to RT-LAMP, shown to induce a strong cellular immune response30,56,57 The immune assays done here confirmed the latter, although in our experience, the RT-LAMP gene immunogen lacked the capacity to induce RT-specific IL-4 production. 30 Immunization with the RT-Ii gene induced an immune response with a similar profile: a high level of anti-RT antibodies and moderate IFN-γ production. The potency of RT-Ii gene immunogen was lower than that of RT-LAMP, possibly because the chimera carried a much shorter/weaker MHC class II targeting signal. RT-GAR chimeras induced the RT-specific T-helper cell response characterized by the production of IFN-γ and IL-4. Of the two GAR chimeras, only the N-terminal fusion (RT-Ngar) was capable of inducing strong production of IL-2. Overall, the performance of RT-Ngar chimera was comparable to that of RT-LAMP. This shows that even short signals, such as minimal GAR, can elicit a marked effect on antigen processing and presentation.
Modification of antigens to make them into potent immunogens is an actively explored avenue of protein design. Immunogenicity can be improved by fusing antigens to signals targeting them to proteasome to enhance the CD8+ response (inserting N-end rule tails, ubiquitinylation, fusion to ornithine decarboxylase) or to lysosome to enhance the CD4+ response (as LAMP, or Ii used here; also LIMP, Fas ligand, and calreticulin domains).58,59 However, there is no direct or straightforward path between a change in antigen processing and the enhanced immunogenicity, as was shown by the studies of multipartite gene immunogens combining proteasome-degradable and proteasome-resistant units.60,61 We used the GAR domain of EBNA-1 to enhance the immunogenicity of HIV-1 RT not because it is known to change (ie, block) processing of the carrier protein; we could not foresee what consequences it might have had on the immunogenicity of the chimera. Gly-Ala was chosen because such fusion has been shown to enhance the carriers immunogenicity for CD4+ T cells,38,39 and that was the component missing in the immune response to the parental RT gene.30,47 The actual mechanism of the Gly-Ala-driven immune response enhancement remains unknown, requiring further studies.
The results of the conventional immune assays were compared to the luminescence fading data. Strong immunogenicity of the RT-LAMP gene manifested by IFN-γ and IL-2 production was translated into a significant decrease in the reporter luminescence. Strong IL-2 and moderate IFN-γ production coincided with considerable fading of the reporter luminescence induced by RT-Ngar, and moderate IFN-γ production and no/low IL-2 secretion coincided with a weak decrease in the reporter activity in case of RT-Ii and RT-Cgar genes. The wild-type RT gene was nonimmunogenic, and its expression induced no decrease in luminescence beyond that seen in the vector-immunized mice. Similar observations were made for the Luc gene coinjected with the geneencoding HCV core, which was nonimmunogenic in both T- or B-cell assays (Sominskaya I and Isaguliants M, unpublished data, 2011), 62 and for the HIV-1 protease gene that was highly immunogenic on the T-cell (and B-cell) level. 29 The CTL response to Luc by itself could have little input into luminescence fading because Luc is relatively nonimmunogenic, particularly in the conditions used here.18,24,63 A slow decline in luminescence can be explained by nonlytic mechanism(s) of luminescence fading, primarily silencing of cytomegalovirus (CMV) promoter due to methylation.23,64 It is important to mention here the biphasic nature of the dependence of luminescence and cellular immune response, where the first phase of direct dependence observed at the early stages (up to day 9) reflected the efficacy of gene delivery, whereas luminescence fading at the later stages reflected the T-helper 1 immune response. The “hierarchy” of this fading can serve as a surrogate marker of the results of the conventional assays of cellular immune response: strong fading coincided with potent responses and low or no fading with weak or absent responses. It is not yet clear if the in vivo imaging technique is applicable for monitoring of the production of T-helper 2 cytokines (as IL-4) because the levels of the latter produced in this study were low and, therefore, not indicative.
Next, we looked for the specific immune correlates of luminescence fading. An inverse correlation was observed between the reporter expression at days ≥ 15 and the specific IFN-γ response registered by the end of the experiment (p < .05; see Figure 6), which supported the earlier observations of the IFN-γ-controlled clearance of expressing cells.21,24 Clearance can be driven by the immunogen-specific CD8+ T cells,19,29,30,65,66 as was demonstrated in immunization with the gene encoding NS3/NS4A of HCV.26,28 The IFN-γ response targeted against an immunodominant H2-Kd CTL epitope in Luc also correlated with luminescence fading (R = .57–.72; p < .005). This, however, could be seen only when immunizing with a high dose of Luc gene (100 μg versus 10 μg used in the mainstream experiments; see Figure S1 in the online version). Interestingly, the fading effect induced by the Luc gene itself can be enhanced if Luc is supplied with a strong foreign CTL epitope. 67 The latter favors the concept of CD8+ T cell–mediated luminescence fading due to clearance of expressing cells. The role in fading or clearance of other IFN-γ-producing cells, such as macrophages and natural killer cells, was reported to be refractory.19,68
Interestingly, the in vivo luminescence was also correlated to the RT-specific IL-2 secretion, but the correlation profile differed from that observed for IFN-γ (see Figure 6). In the early stages, there was a positive correlation; that is, the magnitude of IL-2 response depended on the initial level of antigen expression. Then, after day 9, the correlation turned into an inverse (see Figure 6B), implying that luminescence fading was mediated by IL-2-producing cells induced by gene immunization. The profile of cytokines secreted in response to mouse CD4+ epitopes (see Figure 4 and Figure 7) indicated that IL-2 secretion was (at least partially) elicited by the RT-specific CD4+ T cells. Altogether, our data illustrate that the degree of luminescence fading achieved during first 15 to 21 days of gene immunization can serve as a marker of the development of immunogen-specific IFN-γ and IL-2 T-cell response.
Correlation of IL-2 and of IFN-γ production to the rapid fading of luminescence points at the lysis of expressing cells by IL-2 or IFN-γ or IFN-γ/IL-2-producing immune cells. Therefore, dual IFN-γ/IL-2 secretion combining to fading can be proposed as a marker of successful gene immunization. The correlation of luminescence fading to the level of dual IFN-γ/IL-2 secretion observed for potent gene immunogens29,30,65 argues for the input of the dual IFN-γ/IL-2-producing T cells. Plausible candidates are IFN-γ/IL-2-producing memory CD8+ T cells capable of cytolysis 24 and multifunctional IFN-γ/IL-2-secreting CD4+ T-helper 1 cells. The latter, readily induced in intradermal gene immunization, are also capable of specific target cell lysis. 69 Further in vivo investigations will be carried out to delineate the mechanism of luminescence fading, which we propose to be the immune clearance of expressing cells, and, if the latter is true, to define the actual lysis-performing cells.
Conclusions
We applied the in vivo imaging technique for indirect dynamic monitoring of the development of immune responses in gene immunization. Imaging data assessed the real-time expression of the reporter gene (Luc), coadministered with gene immunogens. Fading of luminescence at the injection sites correlated with the induction of immunogen-specific responses, manifested by the production of IFN-γ and IL-2. Both the immune and the in vivo imaging methods concordantly demonstrated the immunogenicity of the fusions of HIV-1 RT to the luminal and transmembrane domains of LAMP-I and of its N-terminal fusion to 30-amino acid long GAR of EBNA-1. The experiments indicate that in vivo imaging could be used to monitor the performance of gene immunogens and quickly assess their integral immunogenicity, particularly the capacity to induce the production of IFN-γ and IL-2. The technique is applicable for the first preliminary monitoring of gene vaccine candidates prior to the immune tests. Experiments can then be terminated for immunogens that do not fade the luminescence beyond the levels registered for empty vectors. Altogether, use of the in vivo imaging technique may help reduce and refine gene vaccine tests in small animals.
Footnotes
Acknowledgments
Our thanks go to Prof. Shan Lu (Medical School, University of Massachusetts) for scientific advice and critical reading of the manuscript and to Petrick Hort for editorial support.
Financial disclosure of authors: The authors gratefully acknowledge financial support from the Swedish Research Council (grants #K2009-66X-21053-01-3 and K2011-79X-21744-01-6); Russian Federal Agency for Science and Innovation (grant 02.512.11.2291); Russian Foundation for Basic Research (grant 11-04-01569-a); the New Visby program of the Swedish Institute; and President of the Russian Federation for Young PhDs (grant MK-5287.2011.4).
Financial disclosure of reviewers: None reported.