
Abstract
We delivered adenovirus vector (Ad) via intravitreous injection and monitored transgene (luciferase) expression in living mice (BALB/c) at multiple time points. In vivo live imaging technology was able to assess dynamically intraocular luciferase expression in a single animal population throughout the entire experiment period. Using this information, we were able to determine the optimal time point for readministration of Ad into the eyes and to dynamically study the time course of expression of a second Ad administration. Optical imaging demonstrated the limited period of transgene expression in eyes. Significant transgene signal was also detected in livers. The repeat intraocular delivery of the adenovirus resulted in significant blunting of transgene expression in both eyes and livers compared to the initial delivery. Periocular corticosteroid (triamcinolone acetonide) injection combined with initial Ad delivery was effective to rescue luciferase expression on repeat Ad vector delivery. However, this effect was not observed when corticosteroid was combined with repeat Ad delivery. Although corticosteroid enhanced ocular transgene expression, it also increased transgene expression in liver, which has potential safety implications. This dynamic transgene expression in eyes was successfully traced and monitored via a live imaging technique.
ADENOVIRAL VECTOR (Ad) has been employed broadly in ocular gene therapy in both experimental and clinical settings.1–5 Because Ad transduces a wide range of cells and has high transgene expression, more than 300 human clinical trials used recombinant Ads to transfer therapeutic genes. 6 However, the principal disadvantage of Ad is that it evokes host immune responses that are associated with rapid losses of transgene expression in the target tissues. 7 Ads elicit strong innate immune responses through Toll-like receptor (TLR)-dependent and TLR-independent pathways.8,9 Cellular immune responses mediated by adenoviral injection have been considered. The virus does target antigen-presenting cells in target tissues and subsequently induces cytotoxic T cells that eliminate the transduced cells and the virus.7,10,11 The neutralizing antibodies acquired by first exposure may prevent cellular transduction by Ad on readministration. 7 The preformed adenovirus-specific immune response generates relatively higher levels of acute inflammatory cytokines (interleukin [IL]-6, IL-12, and tumor necrosis factor α) in the serum subsequent to readministration.12,13 Therefore, it has been demonstrated that repeat injection of Ad in nonocular tissue induces a significant reduction in transduction as well as shortened transgene expression compared to primary exposure.
The aspects of immune privilege afforded the eye include endowment of the intraocular space with the ability to maintain its vital functions by minimizing regular immune responses.14–18 The results of previous work have demonstrated this ocular immune privilege against Ads. Neutralizing antibodies induced by intravitreous or subretinal Ad injection have shown minimal effect on vector readministration into eyes.19,20 There was a report that subretinal injection of Ad primarily elicited a predominant T-helper 2 response. 19 In addition, several repeated intravitreous or periocular Ad injections were necessary to induce neutralizing antibodies equivalent to a single intramuscular injection. 20 However, a significant level of T-cell immune response and an inefficient transgene expression following repeat ocular administration of Ad were also reported. 21
Recent advances in optical imaging techniques in combination with vectored luciferase permit noninvasive, in vivo assessments of luciferase expression over time in a variety of tissues.22–26 Optical imaging of the bioluminescence resulting from luciferase expression using current-generation technology from Xenogen Corporation (Alameda, CA) is now significantly more sensitive and less affected by interference from tissue autofluorescence. 24 This technique for longitudinal assessment of biologic phenomenon occurring in the same animal population over time has obvious advantages over conventional techniques that use tissues, proteins, or ribonucleic acid (RNA) from sacrificed animals.
In this study, we delivered Ad via intravitreous injection and monitored transgene (luciferase) expression in living mice at multiple time points. In vivo live imaging technology is able to dynamically assess intraocular luciferase expression. Using this information, we were able to determine the optimal time point for readministration of Ad into the eyes and to dynamically study the time course of transgene expression delivered by the repeat Ad administration inside the eye—the immune-privileged organ. Furthermore, we evaluated the interesting role of localized ocular corticosteroid (CS) treatment (periocular triamcinolone acetonide [TA] injection) in salvaging ocular transgene expression after repeat Ad administration.
Materials and Methods
Adenoviral Vectors Expressing Luciferase
Adenoviral vectors expressing luciferase (Ad-Luc) were constructed that express firefly luciferase from a cytomegalovirus (CMV) immediate early promoter expression cassette on a backbone generated by adenovirus serotype 5. The vectors were replication deficient following deletion of the coding sequence for E1A, E1B, and E3. Luciferase expression was confirmed via transfection experiments using cultured ARPE-19 cell lines.
Animals
All animal procedures were conducted in accordance with the Association for Research in Vision and Ophthalmology (ARVO) statement for the use of animals in ophthalmic and vision research. Male 8-week-old BALB/c mice (Harlan, Indianapolis, IN) were divided into eight groups (Table 1, groups 1 to 6 and nonsteroid [NS] and CS groups). Each group is described in Table 1 and Figure 3A.
Description of the Mouse Groups

Ad-Luc: adenoviral vectors expressing firefly luciferase (109 particles in 1 μL for intravitreal injection, 109 particles in 50 μL for subcutaneous injection); TA 5 triamcinolone acetonide (Kenalog-40, Bristol-Myers Squibb Co., Princeton, NJ; 400 μg/10 μL, periocular injection).
Intraocular Injection of Vectors
Ad delivery was standardized to deliver identical dosages (109 particles in 1 μL) at all injection time points of this experiment. Briefly, under anesthesia with ketamine/xylazine (45 mg/kg and 4.5 mg/kg, respectively) and topical proparacaine, intravitreous Ad-Luc injection was conducted using a Harvard pump microinjection apparatus and pulled glass micropipettes, as described previously. 27 Each micropipette was calibrated to deliver 1 μL of vehicle containing Ad-Luc on the depression of a footswitch. Using a dissecting microscope, the sharpened tip of a micropipette was inserted through the sclera just behind the limbus of the right eye into the vitreous cavity, and the foot switch was depressed. The pipette tip was briefly held in situ to minimize the leakage. The first Ad-Luc intravitreous administrations were consistently performed in the right eye in this experiment.
Periocular TA Injection
Periocular injections of TA (Kenalog-40, Bristol-Myers Squibb Co., Princeton, NJ; 400 μg/10 μL) were conducted for local immune suppression. In brief, after the mouse was anesthetized with ketamine/xylazine (45 mg/kg and 4.5 mg/kg, respectively) and topical proparacaine was applied, the superotemporal quadrant of the study eye was exposed. Using a binocular dissecting microscope (Stemi 2000, Zeiss, Thornwood, NY) for visualization, a 30-gauge needle attached to a syringe containing 10 μL of TA was employed to gently deposit TA onto the episcleral surface, beneath the conjuctiva/tenons capsule. The needle was held in position for approximately 5 seconds after injection to allow for the distribution of the drug and to minimize leakage from the injection site. At the end of the procedure, the white sediment containing TA was confirmed to be in the periocular position in all mice.
Optical Imaging Using Luciferin
The vector-injected mice were imaged using an optical imaging system (IVIS 200, Xenogen). Mice were injected via an intraperitoneal route with a luciferin solution (0.2 mL of 15 mg/mL, 75 mg/kg, D-luciferin potassium salt; Gold Biotechnology Inc., St. Louis, MO). The mice were subsequently placed in an anesthesia box with a continuous flow of 2.5% isofluorane. After the mice were fully anesthetized, they were transferred to an imaging box (2.5% isofluorane continuous flow through a nose cone), and images were obtained. The image settings were as follows: high-resolution bin, f1 stop, 120 seconds of exposure time, 24.4 cm field of view, and height of 0.8 cm. All animals were imaged in single-image mode with the above settings 10 minutes after intraperitoneal luciferin injection throughout the entirety of the experiment. In the mice from groups 5 and 6, the second Ad injection was conducted at day 44 after confirming the lack of a visible luciferase signal from the first Ad injection.
Organ Luciferase Imaging
The mice for organ luciferase imaging were immediately euthanized after obtaining optical images on day 2 (n = 2 each). The eyeballs, livers, and spleens were immediately harvested. The harvested organs were then arranged on a piece of black paper, and optical imaging was conducted using the same imaging setting as in the live imaging. The time from intraperitoneal luciferin injection to the organ luciferase imaging was 30 minutes.
Signal Analysis of Optical Imaging
Bioluminescence was calculated using the manufacturer's software (Living Image 2.5, Xenogen). For eye signal calculation, a round-shaped region of interest (ROI) with a diameter of 10 mm was created and applied to the mouse eye area. The untreated left eye of the animal was employed to determine the background bioluminescence. For liver signal calculation, a rectangular ROI was created with a size of 30 mm (horizontal) × 24 mm (vertical) and applied to the liver and spleen area. Bioluminescence (photons/second/cm2/steridian) in these ROI was automatically calculated and employed for the purpose of comparison.
Histologic Examination
The tissues (eyes, livers, spleen) were fixed in 10% formalin, embedded in paraffin blocks, and sectioned. Hematoxylineosin staining was conducted to evaluate the degree of inflammation associated with vector administration, both with and without CS treatment.
Statistical Analysis
SPSS version 11.0 for Windows (SPSS Inc, Chicago, IL) was used for statistical analysis. Mann-Whitney U tests were used for analysis of differences between the two groups. The Kruskal-Wallis test and the least significant difference (LSD) test using ranks for multiple comparison were employed for analysis of differences among more than two groups. The paired t-test was used for comparison of luciferase expression between the first and second injection in the same animals. All p values less than .05 were considered statistically significant.
Results
Time-Intensity Curve of Intraocular Luciferase Expression after Initial Ad-Luc Injection
A time-luminescence intensity curve was obtained using the optical imaging system after the initial administration of Ad-Luc in mice in the NS and CS groups. The peak signal intensity was recorded at day 2 postinjection in both groups. Ocular luciferase expression in the NS group evidenced a rapid decline by day 8, and the residual signal decayed gradually until day 22. In the CS group, ocular luciferase expression was enhanced in the early period followed by prolonged duration of expression (Figure 1). These data are consistent with those of our previous report. 27 Periocular CS treatment significantly prolonged luciferase expression in both the eye and the liver. Ocular histology revealed the successful suppression of early ocular inflammation in the CS group, which may reflect a higher ocular luciferase signal relative to that of the NS group. However, significant infiltrations of inflammatory cells were observed in the CS group when checked on day 30 after the intravitreous delivery of Ad-Luc (see Figure 1). The inflammation induced by Ad-Luc intravitreous injection recruited various sizes of inflammatory cells in the early period; however, infiltration in the late stage was composed of small lymphocytic cells, mainly in the NS and CS groups. Significant optical intensity was detected in the abdominal areas of the mice. The signals were positively correlated with those in the eye. Organ luciferase imaging revealed that the signal originated primarily in the liver and that the spleen had no detectable signal. In our histologic examination, significant infiltration of inflammatory cells was present in the liver parenchyma and luciferase expression was confirmed via optical imaging (Figure 2).
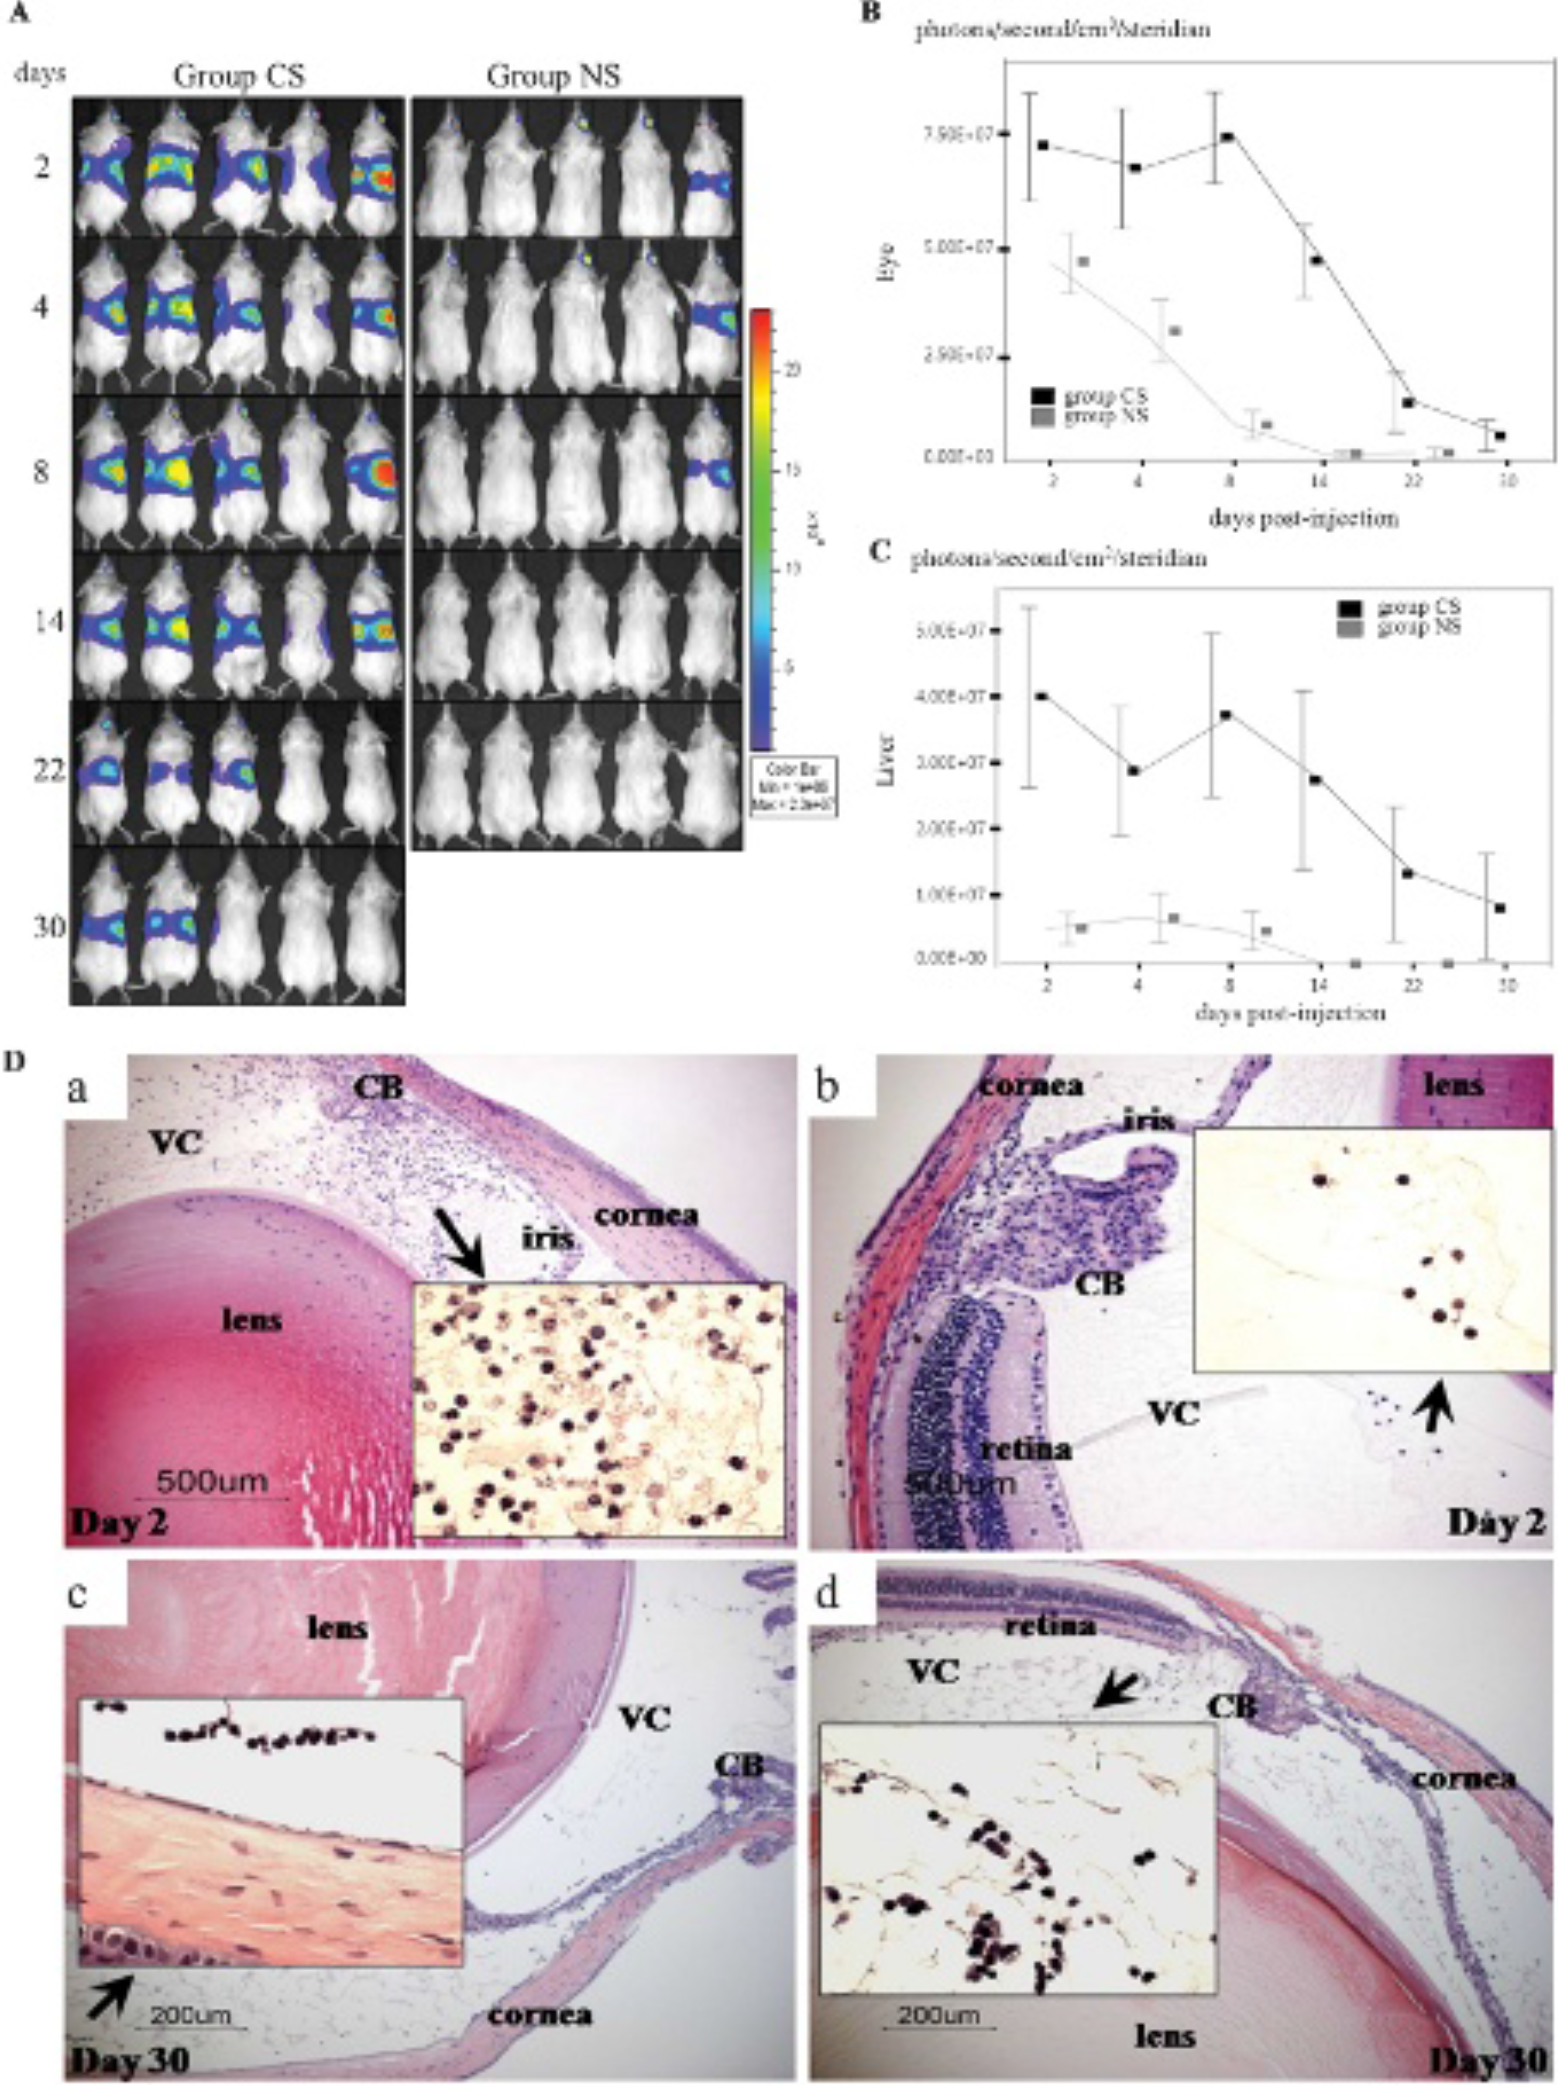
Optical imaging of luciferase activity and the enhancing effect of periocular corticosteroid (CS) injection on the time-intensity curve of intraocular and hepatic luciferase expression and histologic examination showing inflammation induced by Ad-Luc intravitreous injection. A, Representative pictures of the intraocular luciferin signal detected by optical imaging after the intravitreous injection of Ad-Luc (109 particles in 1 μL) in the right eye. The same population of mice was followed from day 2 until day 30. The left eyes had no Ad-Luc injection. The color bar on the right side of the figure is the pseudocolor scale (highest signal—red, yellow, blue, purple—lowest signal). Every picture is scaled to the same pseudocolor scale (photon count: minimum 3.0 × 10⁶ and maximum 2.3 × 10⁷). B, The optical (bioluminescence) signal intensity measured in the right eyes was longitudinally followed from day 2 through day 30. The optical signal intensity was higher in the periocular triamcinolone acetonide (TA)-injected eyes (CS) in all checkpoints. Grey squares represent the mean signal intensity of the vector-only group, and the black squares represent the mean signal intensity of the vector-plus-CS group (n = 10, each group) (p < .05 in every day point). C, The optical signal intensity was measured in the liver area. Periocular TA injection significantly increased liver signal intensity throughout the experiment relative to the control group (n = 10, each group) (p < .05 in every day point). Bars show the means, and error bars show 1.0 standard error. The Mann-Whitney U test was used to calculate the p values. D, Periocular CS injection significantly suppressed the inflammatory reaction accompanied by Ad-Luc intravitreous injection. Arrows indicate the magnification of areas. Hematoxylin & Eosin staining. Original magnification for a and b is × 400. Original magnification for c and d is × 200. (a) The eyes in the NS group evidenced significant amounts of inflammatory cell infiltration into both the vitreous cavity (VC) and the anterior chamber. The infiltrated inflammatory cells were a mixture of large granular and small lymphocytic cells (inset). (b) However, this inflammation was reduced significantly in the eyes of the CS group. (c) Early inflammation was reduced in the NS group on day 30. The infiltrated cells primarily exhibited a lymphocytic appearance. (d) The histology of the CS group showed the delayed onset of infiltration of small lymphocytic cell clusters. CS group: periocular TA injection at day −2 and Ad-Luc intravitreous injection into the right eyes at day 0; NS group: Ad-Luc intravitreous injection into the right eyes at day 0.

Detection of luciferase expression in the liver by organ luciferase imaging. A–F, Mice from the nonsteroid (NS) and corticosteroid (CS) groups were sacrificed immediately (at day 2 following Ad-Luc injection) after obtaining the optical images (A, B, C). The harvested organs (D, E, F) were imaged using a Xenogen system. The organs harvested from the mice in the upper row were arranged in the same positions in the lower row. A and D are from the NS group, B and E are from the CS group, and C and F are from the mice without Ad-Luc intravitreous injection (control). Higher luciferase expression was noted in livers from the CS group compared to the NS group. No luciferase expression was visible in spleens from both groups. A and B and D and E are demonstrated, respectively, in the same pseudocolor scales for better comparison. Colors are pseudocolors (pseudocolor scale: highest signal—red, yellow, blue, purple—lowest signal). LE = left eye; RE = right eye. G, The scatterplot of optical signal intensities between the liver and the eye showed a significant positive correlation (p < .001, Spearman's rho = 0.780). H, The histology of livers at 9 days after Ad-Luc intravitreous injection revealed focal small inflammatory cell infiltrations (arrows) in the liver parenchyma, suggesting hepatocyte transduction by Ad-Luc. Hematoxylin & Eosin staining. Original magnification for A and B is × 200. Original magnification for C and D is × 400. A and C and B and D are from mice in the NS and CS groups, respectively. NS group: Ad-Luc intravitreous injection into the right eyes at day 0; CS group: periocular triamcinolone acetonide injection at day −2 and Ad-Luc intravitreous injection into the right eyes at day 0.
Time-Intensity Curve of Intraocular Luciferase Expression after Second Injection of Ad-Luc
The second exposure of the eye to Ad-Luc resulted in rapid termination of viral transgene expression in both group 1 (reinjection in the same eye) and group 2 (reinjection in the other eye) (Figure 3B). Intravitreous injection in the same eye (group 1) resulted in significantly lower initial transgene expression measured on day 2 following the second injection. In group 2, the initial transgene expression level achieved following repeat Ad-Luc administration showed no statistical differences compared to that seen following the first injection. However, a more rapid decline in luciferase expression was observed on day 4, which was comparable to group 1 on day 6.

The time-intensity curves of repeat intravitreous Ad-Luc administration. A, The groups (from 1 to 6) used in the experiment are schematically described regarding the timing of each intravitreous Ad injection and periocular corticosteroid (triamcinolone acetonide [TA]) injection. The details of each group are described in Table 1. SC = subconjunctival. The optical signal intensity measured from injected eyes was longitudinally followed from day 2 through day 14 following the repeat intravitreous injection of Ad-Luc (109 particles in 1 μL) in various groups. B, Group 1 showed initially decreased luciferase expression combined with rapid viral transgene clearance. Group 2 evidenced sufficient initial luciferase expression; however, the reduction in luciferase expression was significantly rapid compared to that of the initial injection. C, The periocular corticosteroid injection at the time of the first Ad-Luc administration in group 5 failed to elevate significantly the initial luciferase expression level, and this showed no significant differences at any follow-up time point when compared to group 1. D, However, initial corticosteroid pretreatment improved the time-intensity curve of group 6, and no difference was observed up to day 8 relative to that of the first injection. E, The early luciferase expression at day 2 was increased significantly in group 3 compared to group 1. However, despite the corticosteroid effect, luciferase expression in group 3 was reduced rapidly until day 4 and evidenced low expression levels similar to those of group 1. F, The corticosteroid pretreatment failed to shift the luciferase expression curve significantly in group 4. G, Early luciferase expression was measured at day 2 following Ad-Luc injection. Groups 1 and 5 showed significantly reduced luciferase expression relative to any of the other groups in this study. Error bars show the ± 1.0 standard error of mean, and the dots show the mean. All p values were calculated via the Kruskal-Wallis test and the LSD test using ranks for multiple comparison.
CS Effect at the Time of the First Administration of Ad-Luc
CS pretreatment on initial Ad-Luc administration had a significant effect on the time-intensity curve after repeat Ad-Luc administration in the other eyes (group 6, Figure 3D), whereas it evidenced only minimal effects on repeat Ad-Luc administration in the same eyes (group 5, Figure 3C). Interestingly, the time-intensity curve of group 6 showed no differences up to day 8 compared to the initial injection (see Figure 3D).
CS Effect at the Time of the Second Injection of Ad-Luc
To determine the effects of CS pretreatment in conjunction with the second Ad-Luc administration, group 3 and 4 mice were pretreated with periocular TA on day 22. This was 2 days prior to the repeat Ad-Luc administration. Group 3 (CS pretreatment and repeat injection in the same eye) showed an initial increase in luciferase expression on day 2 following the second administration, and this was comparable to the level following the initial administration (Figure 3E). However, this high expression level was transient and decreased rapidly by day 4. In group 4 (CS pretreatment and repeat injection in the other eye), the CS pretreatment shifted the time-intensity curve toward that of the first injection; however, no time point achieved statistical significance compared to group 2 (reinjection in the other eye) (Figure 3F). When comparing the early luciferase expression measured at day 2, mice in groups 1 and 5 had expression levels that were significantly lower than those seen in the other groups (Figure 3G). The effect of CS treatment on the second Ad-Luc injection is evaluated further in Figure 4. Hepatic expression of luciferase was barely visible in group 2 subsequent to the second Ad administration; however, hepatic luciferase expression was noted in the group 6 mice. This was significantly lower than the hepatic luciferase expression present following the first Ad administration.

Comparison of liver optical signal intensities between the first and the second intravitreous administration of Ad-Luc in groups 2 and 6. A–C, Mice in group 2; D–F, mice in group 6. A, Optical images were obtained at day 2 after the first administration of Ad-Luc into the right eyes (upper panel) and at day 2 (day 26 after first Ad-Luc administration) after the second administration of Ad-Luc into the left eyes (lower panel) in the same population of mice. B, The optical signal intensities from the left eyes on day 26 evidenced no significant difference relative to those of the right eyes on day 2. C, However, the liver optical signals were rarely detected after the second administration of intravitreous Ad-Luc. The liver optical signal intensities measured on days 2 and 26 after the initial Ad-Luc administration are shown. The liver signal observed after the second administration was also negligible in the subsequent images out to day 14 (images not shown). D, Optical images were obtained on day 2 after the first administration of Ad-Luc into the right eyes (upper panel) and on day 2 (day 46 after first Ad-Luc administration) after the second administration of Ad-Luc into the left eyes (lower panel) in the same population of mice. E, The optical signal intensities from the left eyes on day 46 exhibited no significant differences relative to those of the right eyes on day 2. F, The liver signal obtained after the second administration of Ad-Luc in group 6 was significantly lower than that observed after the initial administration; however, it was significantly higher relative to the liver signal detected from the mice in group 2. It was even higher than the liver signal after the initial administration in group 2. G, Color bar: pseudocolor scale. Bars in the graph show the mean, and the error bars show the standard error of means (n = 10, each). Group 2: Ad-Luc intravitreous injection into the right eyes at day 0 and Ad-Luc repeat intravitreous injection into the left eyes. Group 6: periocular triamcinolone acetonide injection into the right eyes at day −2, Ad-Luc intravitreous injection into the right eyes at day 0 and Ad-Luc repeat intravitreous injection into the left eyes. Paired t-test was used in B, C, E, and F. The Kruskal-Wallis test with LSD was used in G.
Discussion
In this study, we employed live in vivo imaging. Tracking and analyzing the dynamic changes in transgene expression in the same animal population could enhance the reliability of acquired biologic data. The ability to continuously monitor the fate of antigens in living animals could generate some objective evidence and would also constitute an advantage over studies conducted with dead tissue. Using this technique, we designed various sets of repeat injection experiments and determined that ocular immune tolerance to viral antigen (Ad) is not expected in routine repeat intraocular administration of Ad. Repeat delivery of transgene via Ads resulted in significantly hampered efficiency, and local modulation of the intraocular microenvironment using periocular CS injection in combination with primary Ad exposure was necessary to rescue transgene expression. The presumed immune tolerance to Ad in the eye was not observed.
Rapid loss of luciferase expression occurs following repeat intravitreous injection. Even the naive left eyes of group 2 mice showed rapid termination of transgene expression following Ad administration. Development of both humoral and cellular immune responses against Ad may participate in the blunted transgene expression after repeat vector delivery. Although several previous reports suggested immune tolerance to intraocular Ads, we obtained contradictory data in this study, and our results are consistent with a previous report describing rapid loss of transgene expression and a significant increase in Ad-specific neutralizing antibodies following repeat ocular administration. 21 These discrepancies in observation may arise from the differences in the experimental designs of various studies. In previous studies, analysis was performed using tissue harvested from dead animals. To confirm the correct delivery of Ads, transgene expression was verified by tissue assay, and this meant the dropout of sacrificed animals. Furthermore, the verification of transgene expression in sacrificed animals cannot guarantee the transgene expression of remaining live animals. For a clearer picture of the dynamic aspects of the biologic phenomena occurring, it is advantageous to study the same animal population longitudinally and to evaluate the Ad transduction pattern after the primary and secondary Ad injections. Therefore, the noninvasive tracing technology we used in this study is uniquely suited to answer these questions.
The effect of CS pretreatment at the time of the primary intravitreous Ad injection exerted an interesting salvaging effect on viral transgene expression. The significantly stronger expression of hepatic luciferase (see Figure 4) also suggested that CS pretreatment altered the normal development of immune response against Ad, but the response was not one of complete immune tolerance, as observed through this study. When it was not accompanied by primary Ad exposure, the rescue effect of CS pretreatment was limited, as is demonstrated in groups 3 and 4. These findings suggested that the effect of CS pretreatment is related to some memory response at the first exposure of Ad, and the deviated immune memory induction is one of the possibilities. However, the normalized early luciferase expression in group 3 is another interesting effect of CS pretreatment.
Although CS pretreatment successfully controlled vector-associated inflammation in this study, the exact mechanism by which periocular CS administration contributes to the enhanced transgene expression after repeat Ad injection remains unclear. Ocular immune tolerance is an inducible phenomenon and is highly dependent on the ocular microenvironment.28,29 Many immune-related molecules, such as α-melanocyte-stimulating hormone, vasoactive intestinal peptide, hepatocyte growth factor, transforming growth factor β, indoleamine 2,3-dioxygenase (IDO), and programmed cell death domain-1 and its ligand, contribute to ocular immune privilege; some of these molecules can be induced by CS treatment.30–33 CS can also stabilize the blood ocular barrier under a variety of pathologic conditions. Therefore, we suggest that the effective suppression of acute inflammation and the stabilizing effect of the blood ocular barrier achieved by CS pretreatment may be related to the findings observed in our study. Previously, transient immune suppression occurring during Ad delivery inhibited the development of a robust host immune response. 34 Additionally, previous reports demonstrated that anterior chamber-associated immune deviation was disrupted in the proinflammatory ocular microenvironment and was restored following the resolution of inflammation.35,36 Under inflammatory conditions, regulatory T cells lost Foxp 3 expression and suppressive function.37,38
The effect of CS in enhancing Ad-delivered gene transfer was previously reported in extraocular tissue.39,40 In these studies, pretreatment with dexamethasone significantly decreased both innate and adaptive immune responses against systemically delivered Ad and prolonged vector-mediated transgene expression.
Viral uptake in the liver following intravitreous Ad delivery is an interesting phenomenon. Using in vivo imaging, we could demonstrate the correlation between ocular and hepatic luciferase intensity. The decrease of hepatic luciferase expression on the setting of repeat Ad intraocular delivery can be indirect evidence of the existence of neutralizing antibodies in the blood. In addition, the strong association between intraocular transfection and hepatic transfection indicates that treatments designed to increase the intraocular transfection (localized ocular immune suppression) may also affect the risk of Ad release into the bloodstream with subsequent remote effects in clinical application.
This study was limited in several ways. It is possible that the difference in the interval between the first and the second intraocular Ad injection may have made a precise comparison between the CS pretreated and nontreated groups problematic. The time point of reinjection in our study was determined by when the initial intraocular inflammation subsided significantly and by the time at which luciferase expression was no longer detectable. The lack of immunologic assay to explain the effect of CS is another drawback in some aspects; however, the in vivo measurement of biologic phenomenon in living animals may be stronger evidence than any other laboratory analysis using proteins or RNAs. Additionally, because the immune response is a type of biologic phenomenon that evidences individual variability, the limit on the number of experimental animals resulted in borderline significance in some between-group comparisons, and the immunogenicity of viral transgene (luciferase) is not completely excluded.
Conclusion
We used noninvasive in vivo imaging techniques to assess the transgene expression delivered by intravitreous Ad injection. Optical imaging to detect bioluminescence was useful for monitoring the time course and levels of ocular transgene expression. Repeat delivery of intravitreous Ad resulted in a significant decrease in both the intensity and the duration of transgene expression. Periocular CS pretreatment serves to enhance vectored gene expression after repeat Ad delivery. These findings may have practical and therapeutic relevance in application in the setting of ocular gene therapy.
Footnotes
Acknowledgments
We thank the Wilmer Gene Therapy Vector Core (Johns Hopkins University School of Medicine), Li Chen, Marisol Cano, Jason Rosenzweig, and David Johns, for the Ad-Luc Vector used in this investigation. We thank the In Vivo Cellular and Molecular Imaging Core (Johns Hopkins University School of Medicine), Elana Artemova, Dmitri Artemov, and Zaver Bhujwalla. We thank Dr. Martin Pomper for valuable advice and discussions in the area of in vivo optical imaging.
Financial disclosure of authors: This research was supported by the Basic Science Research Program through the National Research Foundation of Korea funded by the Ministry of Education, Science and Technology (NRF 2010-0002532) (PCY), the Wilmer Gene Therapy Vector Core, an unrestricted grant from Research to Prevent Blindness to the Wilmer Eye Institute, an RPB Career Development Grant from Research to Prevent Blindness (to P.L.G.), and the JHU Fund for Medical Discovery (P.L.G.).
Financial disclosure of reviewers: None reported.