
Abstract
We applied modern molecular and functional imaging to the pretreatment assessment of lung cancer using combined dynamic contrast-enhanced computed tomography (DCE-CT) and 18F-fluorodeoxyglucose–positron emission tomography (18F-FDG-PET) to phenotype tumors. Seventy-four lung cancer patients were prospectively recruited for 18F-FDG-PET/DCE-CT using PET/64-detector CT. After technical failures, there were 64 patients (35 males, 29 females; mean age [± SD] 67.5 ± 7.9 years). DCE-CT yielded tumor peak enhancement (PE) and standardized perfusion value (SPV). The uptake of 18F-FDG quantified on PET as the standardized uptake value (SUVmax) assessed tumor metabolism. The median values for SUVmax and SPV were used to define four vascular-metabolic phenotypes. There were associations (Spearman rank correlation [rs]) between tumor size and vascular-metabolic parameters: SUVmax versus size (rs = .40, p = .001) and SUV/PE versus size (r = .43, p < .001). Patients with earlier-stage (1-HA, n = 30) disease had mean (± SD) SUV/PE 0.36 ± 0.28 versus 0.56 ± 0.32 in later-stage (stage IIB-IV, n = 34) disease (p = .007). The low metabolism with high vascularity phenotype was significantly more common among adenocarcinomas (p = .018), whereas the high metabolism with high vascularity phenotype was more common among squamous cell carcinomas (p = .024). Other non-small cell lung carcinoma tumor types demonstrated a high prevalence of the high metabolism with low vascularity phenotype (p = .028). We show that tumor subtypes have different vascular-metabolic associations, which can be helpful clinically in managing lung cancer patients to hone targeted therapy.
LUNG CANCER is the most common cause of cancer death in men and women in the United States. 1 The role of 18F-fluorodeoxyglucose–positron emission tomography/computed tomography (18FDG-PET/CT) in lung cancer is increasingly recognized.2,3 However, there is also potential for using functional CT and magnetic resonance imaging, which has the ability to obtain perfusion data without an on-site cyclotron, which is needed for performing 15O-H2O PET. The latter gives rise to partial volume effects when evaluating tumor perfusion with PET.4,5
The treatment of lung cancer is becoming more complicated, with increasing refinements made with respect to staging and adjuvant therapies. 6 This has led to demand for both accurate staging and improved tumor phenotyping. PET/dynamic contrast-enhanced computed tomography (DCE–CT) can be used to study important metabolic flow relationships in tumors, 7 as well as to simultaneously stage the patient. Metabolic and vascular data are important in oncology as they enable improved tumor phenotyping, which can predict patient prognosis and the response to chemotherapy and radiotherapy.8–12 Here we prospectively investigate metabolic-vascular relationships in patients presenting with primary bronchial carcinoma using integrated 18F-FDG-PET/DCE-CT.
Materials and Methods
Patients
Seventy-four consecutive patients presenting with potentially curable primary non–small cell lung carcinoma (NSCLC) were prospectively recruited for combined 18F-FDG PET/DCE-CT from the lung cancer outpatient clinics of two hospitals. Inclusion criteria were all patients who had potentially curable NSCLC as defined by current guidelines, 6 including no evidence of metastatic disease. Exclusion criteria included pregnant patients and patients with contraindication to PET or CT (eg, allergy). There were 10 technical failures (excessive respiratory motion, n = 5; tumor too proximal to the pulmonary artery, n = 4; and tumor too small, n = 1), leaving a study population of 64 patients (35 males, 29 females; mean age [± SD] 77.5 ± 7.9 years). The clinical details are further summarized in Table 1.
Clinical Profile of the 64-Patient Cohort in This Study

NSCLC = non–small cell lung carcinoma.
Surgical histologic stage (n = 28).
All patients gave informed consent to undergo investigation, and the local ethics committee approved this study.
Staging and Histology Data
Imaging was used to derive the tumor size in all patients. Nodal status was analyzed only in patients who underwent surgical sampling (n = 28). The presence of metastasis was diagnosed on imaging, including staging CT and PET/CT, as well as other imaging and histology when appropriate. Histology was made by needle biopsy/bronchoscopic biopsy except in the patients who underwent surgery. Histologic diagnosis was made by an expert thoracic histopathologist in all cases.
PET/CT Protocol
Following a 6-hour patient fast, images were acquired 1 hour after injecting 370 MBq of 18F-FDG using a dedicated combined PET/64-detector CT (VCT-XT Discovery, GE Healthcare Technology, Waukesha, WI). CT was performed (for attenuation correction) using 64 × 3.75 mm detectors, a pitch of 1.5, and a 5 mm collimation (140 kVp and 80 mA in 0.8 seconds). Maintaining the patient position, whole-body 18F-FDG PET emission scanning was performed and covered an area identical to that covered by CT. All acquisitions were carried out in two-dimensional mode (4 minutes/bed position). Transaxial emission images of 3.27 mm thickness (pixel size 3.9 mm) were reconstructed using ordered subsets expectation maximization with two iterations and 28 subsets. The axial field of view was 148.75 mm, resulting in 47 slices per bed position. Next, maintaining the patient position, DCE-CT was performed during shallow respiration. Patients received 50 mL of intravenous contrast medium iohexol (Omnipaque 350 mg/mL iodine, GE Healthcare, Chalfont St. Giles, UK; 25 mL at 5 mL/s) at 4 mL/s, whereas 12 CT images (1 per 5 seconds with a 5-second delay) were acquired at 100 to 150 mAs, 80 KV using 64 × 0.6 mm detectors (total of 4 cm detector coverage). CT was performed in axial mode.
Image and Data Analysis
18F-FDG analysis was performed by a nuclear medicine physician with more than 4 years′ experience of region of interest (ROI) analysis with PET/CT. PET/CT images were displayed conventionally on a GE workstation (GE Healthcare Technology; Figure 1). An automated ROI was drawn around the tumor, and 18F-FDG uptake was expressed as the maximum standardized uptake value (SUVmax). Automation was performed using a standard ROI analysis tool provided with the scanner, using a thresholding method. A threshold of 42% of the maximum value was set as the default setting in keeping with the manufacturer's recommendation and the literature.13,14
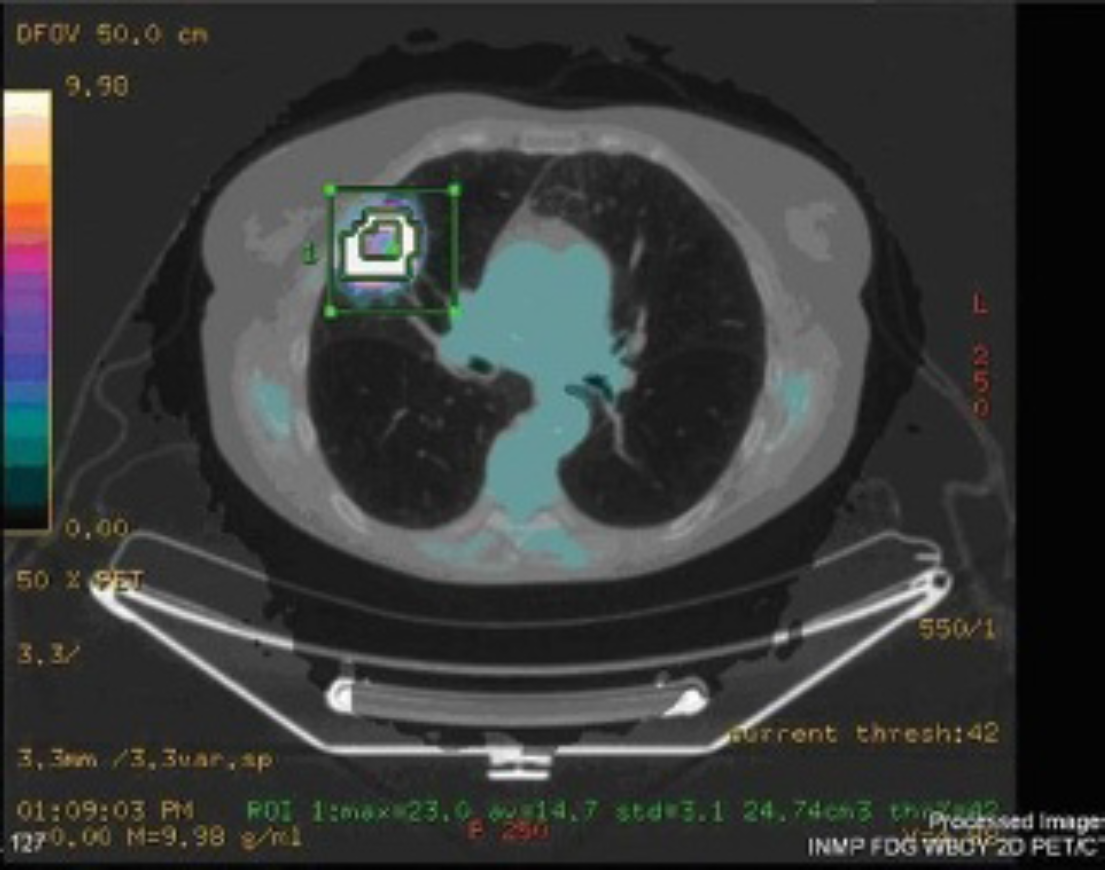
Fused positron emission tomography/computed tomography (PET/CT) image illustrating automated region of interest measurement of a lung tumor standardized uptake value using standard proprietary software with automated thresholding.
DCE-CT data were analyzed using validated proprietary CT perfusion software (Winfun, Cambridge Computed Imaging, Bourne, UK). On the axial image displayed by the software, an ROI was drawn freehand around the lung tumor, taking care to maintain the ROI within the boundaries of the mass, using the PET image for guidance. Vascularity was measured at a single midtumor level, and manual correction was made for respiratory motion. A further ROI was drawn freehand around the aorta, taking care to maintain the ROI within the boundaries of the vessel by viewing the images on the console. Tumor vascular values were obtained from automated processing of the enhancement–time curve data from the aortic and tumor ROI using the method previously described (Figure 2). 15 The peak tumor enhancement value was used to calculate perfusion normalized to cardiac output and the standardized perfusion value (SPV). 16 (Note that the derivation of SPV is analogous to the derivation of SUV.) The calibration factor relating iodine concentration to measured attenuation for the PET/CT system used was determined by phantom studies as described previously 17 :
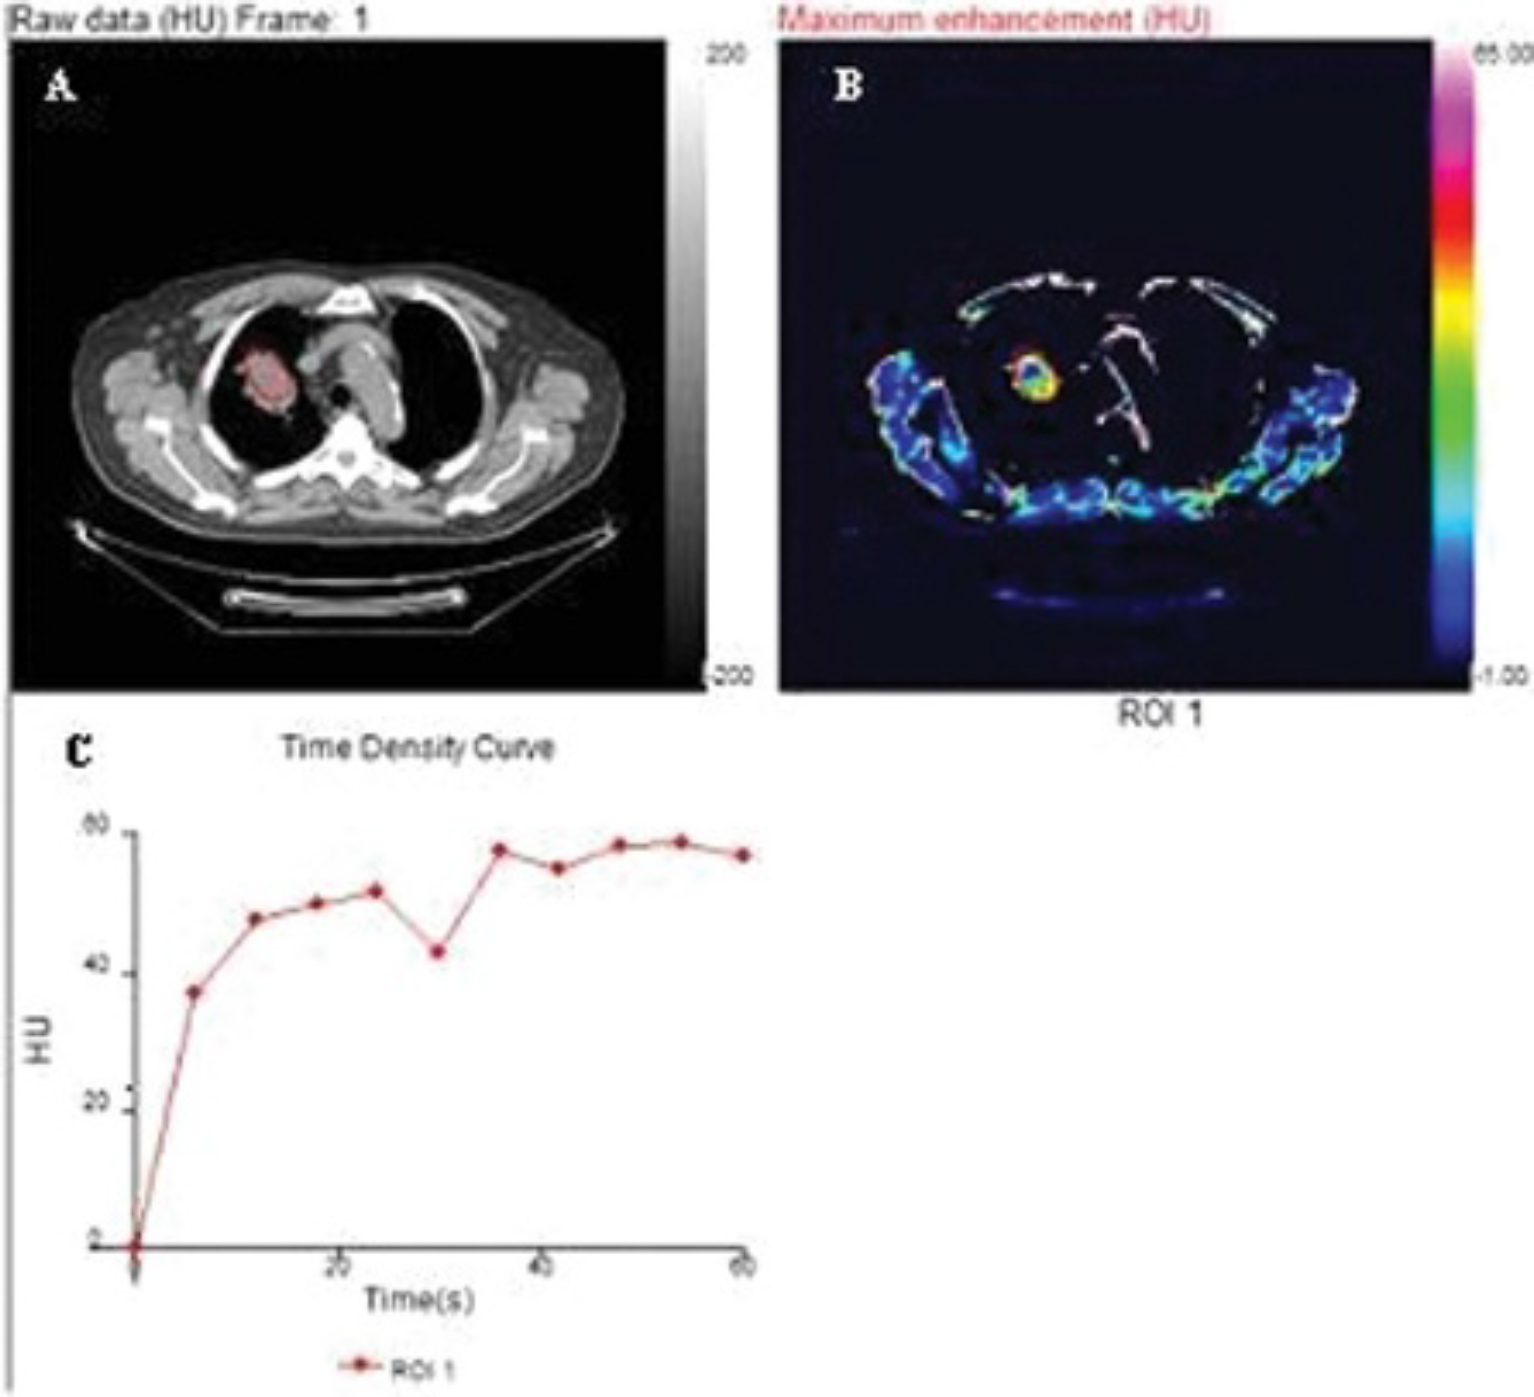
A, Axial computed tomographic (CT) image of the thorax at the midlevel of a lung carcinoma. B, derived from dynamic contrast-enhanced CT, shows the same tumor as part of a color parametric map. C shows the time enhancement curve automatically generated from the drawing of regions of interest (ROI) over the tumor (red ROI).
SPV = maximal tumor enhancement/
(dose of contrast medium × calibration factor/patient weight)
Tumor vascular-metabolic relationships were described by the ratio of SUVmax to each of the parameters reflecting tumor vascularity. Vascular-metabolic phenotypes were also classified into four categories based on the median values for SUVmax and SPV. Thus, tumors were defined as low metabolism (Lm) if the SUVmax was less than or equal to the median, whereas if the SUVmax was more than the median, the tumor was defined as Hm. Tumors were defined as low vascularity (Lv) if the SPV was less than or equal to the median, whereas if the SPV was more than the median, the tumors were defined as high vascularity (Hv). By combing these four parameters, the following four phenotypes were described: LmLv, LmHv, HmLv, and HmHv (Table 2). The median value was chosen as a cutoff owing to the lack of normality in the data (see statistics below).
Classification and Frequency of Vascular-Metabolic Phenotypes
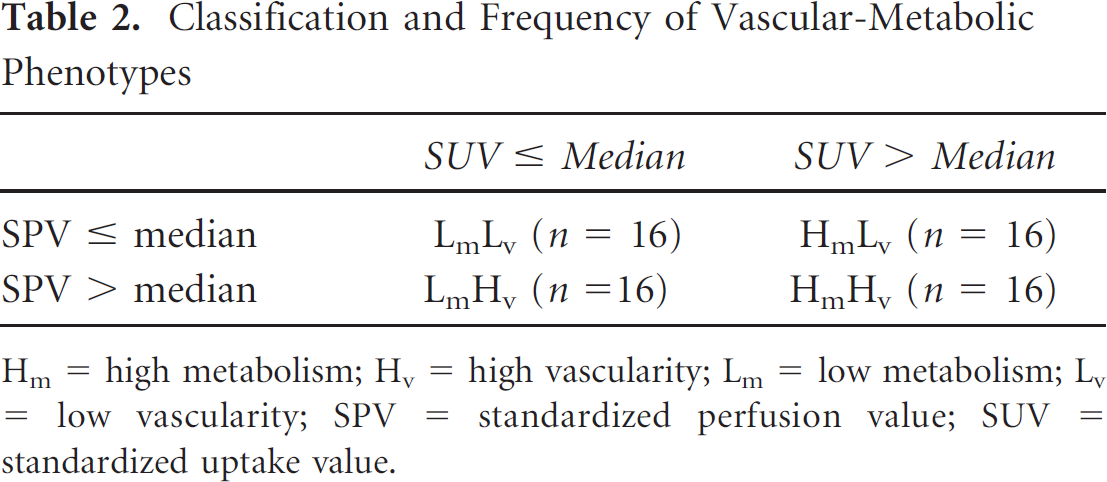
Hm = high metabolism; Hv = high vascularity; Lm = low metabolism; Lv = low vascularity; SPV = standardized perfusion value; SUV = standardized uptake value.
The longest axial diameter as measured on the CT component of PET/CT was used to determine the tumor size.
Statistical Analysis
Confirmation of data nonnormality was made using the Kolmogorov-Smirnov test. The relationships between tumor metabolism and parameters of tumor vascularity were investigated using Spearman rank correlation (rs). Differences in the prevalence of vascular-metabolic phenotypes between tumor types were assessed using a 2 × 3 Fisher exact test in which the frequency of an individual phenotype across the three histologic types was compared to the frequency of the other phenotypes combined. The 3 × 2 Fisher exact test was performed using the Freeman-Halton extension of the Fisher exact probability test for a two-row by three-column contingency table. 18 Mann-Whitney U tests were used to investigate metabolic-vascular parameters with grade (high versus other) and stage of disease (early I—IIA and later IIB—IV), and statistical tests were performed using software from GraphPad (La Jolla, CA). Statistical significance was set at 5%.
Results
The mean (± SD) tumor SUVmax was 13.8 ± 7.0. The mean (± SD) tumor maximal enhancement was 37.6 ± 16.0. The mean (± SD) SPV was 6.5 ± 3.4.
Tumor Metabolic Flow Status
The following correlations (rs) were shown: SUVmax versus maximum enhancement, −0.18 (p = .148), and SUVmax versus SPV, −0.10 (p = .410).
Tumor Size
The mean tumor size was 3.9 ± 2.0 cm. The following tumor correlations (rs) were shown: the SUVmax versus size = 0.40 (p = .001); the maximum enhancement versus size = −0.27 (p = .026); the SPV versus size = −0.23 (p = .065); the SUVmax/maximum enhancement versus size = 0.43 (p < .001) (Figure 3); and the SUVmax/SPV versus size = 0.43 (p < .001).

Graph showing plot of ranked tumor size and standardized uptake value (SUV)/maximal enhancement (rs = .41, p < .001).
Tumor Stage
The mean (± SD) SUVmax of early (stage I and 2IIA, n = 30) tumors was 12.1 ± 7.4 versus 15.4 ± 6.3 (p = .031) in more advanced tumors (IIB–IV, n = 34). The mean (± SD) maximal enhancement in early tumors was 40.0 ± 14.1 versus 34.6 ± 17.8 (p = .073) in more advanced tumors. The mean (± SD) SPV in early tumors was 7.2 ± 3.8 versus 5.8 ± 2.9 in more advanced tumors (p = .103). The mean (± SD) SUVmax/PE for early tumors was 0.36 ± 0.28 versus 0.56 ± 0.32 (p = .007) for more advanced tumors. The mean (± SD) SUVmax/SPV for early tumors was 2.1 ± 1.6 versus 3.4 ± 2.2 (p = .007) for more advanced tumors.
Histology Subtype
There were 16 squamous cell carcinomas (SCCs), 32 adenocarcinomas, and 16 others, including mixed tumor types and unspecified. The prevalence of the four vascular-metabolic phenotypes by tumor type is shown in Table 3.
Number (%) of Patients with Each Vascular-Metabolic Phenotype by Tumor Histology

Hm = high metabolism; Hv = high vascularity; Lm = low metabolism; Lv = low vascularity; SCC = squamous cell carcinoma.
The low metabolism with high vascularity phenotype was significantly more common among adenocarcinomas (p = .018), whereas high metabolism with high vascularity was more common among SCCs (p = .024). Other NSCLC tumor types demonstrated a high prevalence of the high metabolism with low vascularity phenotype (p = .028). There were no significant (p = .4311) size differences between adenocarcinomas with a mean (± SD) size of 3.6 ± 1.9 cm and SCCs with a mean (± SD) size of 3.8 ± 1.7 cm.
Histology Grade
The mean (± SD) SUVmax of high-grade tumors was 12.3 ± versus 12.8 ± 6.6 (p = .806) in lower-grade tumors. The mean (± SD) PE in high-grade tumors was 39.3 ± 14.0 versus 36.6 ± 18.2 (p = .546) in lower-grade tumors. The mean (± SD) SPV in high-grade tumors was 6.1 ± 1.9 versus 6.6 ± 4.1 in lower-grade tumors (p = .650), The mean (± SD) SUVmax/PE for high-grade tumors was 0.36 ± 0.24 versus 0.46 ± 0.33 (p = .345) in low-grade tumors. The mean (± SD) SUVmax/SPV for high-grade tumors was 2.2 ± 1.4 versus 2.7 ± 1.7 (p = .385) in lower-grade tumors.
Discussion
We present the findings from a prospective cohort of 64 NSCLC patients who underwent metabolic-vascular investigation at a single sitting using integrated DCE-CT and 18F-FDG-PET. We showed that the metabolic-vascular relationships of these tumors are uncoupled. The metabolic flow relationships revealed some potential clinical use in the differentiation of adenocarcinoma and SCC, which can be difficult and yet is increasingly necessary for patient management to individualize targeted treatment. We also demonstrate that tumor type and size vary in the metabolic-vascular profile.
One of the common clinical difficulties encountered in NSCLC practice can be obtaining a diagnosis of certain tumor subtypes. This is important because NSCLC subtype affects patient management. Adenocarcinomas typically have a better outcome, and it is important to test the epidermal growth factor receptor (EGFR) mutation status of these tumors to guide the use of targeted therapies such as gefitinib. Conversely, such therapies given to SCCs can have an inverse outcome. However, the initial diagnosis of lung biopsies is usually acquired from small tissue samples, leading to incomplete tissue subtyping. 19 Unfortunately, many of these patients do not proceed to surgery and thus never achieve adequate sampling and histologic subtyping. This is particularly true in the elderly and frail, which is often the case in NSCLC. Consequently, this can cause a dilemma as management could be better honed with the correct tumor subtype defined.19,20
Our data indicate that SCCs have higher 18F-FDG uptakes compared to adenocarcinoma, a finding also reported by others. 21 Furthermore, low FDG uptake in NSCLC may be associated with mutation of the EGFR tyrosine kinase. 22 However, there is such an overlap of SUVs between these groups of patients that it is difficult to base diagnostic assumptions on SUV alone. Histologic data suggest that EGFR status is also linked to angiogenesis and tumor vascularity 23 ; hence, the relationship between tumor vascularity and metabolism may be more closely associated with EGFR status than metabolism alone. Our data provide initial clinical evidence that combined metabolic and vascular values may have a better association with histologic type than using SUV alone and as such may have use where histology is equivocal. It should, however, be appreciated that there was some overlap of the metabolic-vascular phenotype between SCC and adenocarcinoma, which may limit the utility. Further research is also required to confirm an association between the vascular-metabolic phenotype and EGFR status. Using combined PET/CT perfusion to determine a vascular-metabolic phenotype in this way is not an unrealistic consideration because both PET and DCE-CT have been used routinely for many years in patients with suspected NSCLC to improve diagnosis (differentiating benign from malignant lung nodules and staging).24,25
The data from this study importantly showed that the metabolic-vascular relationship varies with histologic type, with adenocarcinomas having a stronger decoupling than SCCs. The pattern of metabolic-vascular coupling also was shown to be dependent on tumor size. We have found greater uncoupling of vascularity and metabolism in larger tumors as reflected by higher values for SUVmax/SPV with increasing size. This finding, which is in accordance with previously reported data, 7 likely reflects greater hypoxia in larger tumors associated with hypoxic stimulation of glucose metabolism. Consistent with this finding, we have also shown that SUVmax/SPV was higher in later-stage disease than in early disease. This may support evidence that this phenotype is more aggressive and needs to be clinically managed accordingly.
Interestingly, other studies revealed a stronger positive relationship between metabolism and vascular parameters compared to our findings. 26 Our study has a good-sized population and so is not necessarily underpowered compared to other studies, which showed an association in much smaller populations. However, our patient cohort contained a large number of patients with adenocarcinoma, which we have shown exhibits greater uncoupling of vascularity and metabolism. Another potential explanation may reflect that our DCE-CT and PET studies were performed at the same sitting on an integrated scanner. Minimizing the time between PET and DCE-CT may well be significant because the tumor microenvironment is highly susceptible to continuous change, especially with respect to hypoxia.27–29 Therefore, the imaging of vasculature and metabolism at different times may indeed be a limitation. The close temporal association between PET and DCE-CT could be a particular strength of our study when comparing findings from other data sets on the metabolic-vascular association in lung cancer.
The relatively large patient cohort in our study has enabled vascular-metabolic phenotypes to be classified into four groups based on the median values for SUVmax and SPV, with 16 patients falling into each group. There were significant differences in the prevalence of each phenotype depending on the tumor type. Adenocarcinomas were more likely to have low metabolism and high vascularity. Higashi and colleagues previously reported low FDG uptake with high vascularity as assessed by uptake of thallium 201 in adenocarcinomas of the bronchioloalveolar type. 30 It is feasible that the adenocarcinomas exhibiting the low metabolism and high vascularity in our series may have had bronchioloalveolar elements. It would be interesting to perform this type of analysis with other non-FDG-PET ligands as a number of potentially interesting tracers are becoming increasingly available. 31 One such example in particular would be a somatostatin analogue. 32
Previous studies using PET tracers have also found that the balance between blood flow and metabolism may provide prognostic/predictive information. Studies using 15O-H2O and 18F-FDG in breast11,33,34 and pancreatic cancer 8 have shown that tumors with low flow and high metabolism are associated with poorer treatment response and outcomes. Such findings may represent a Warburg effect, whereby hypoxic tumors are hypothesized to anaerobically metabolize glucose and are believed to behave more aggressively. 35 Our data suggest that the flow to metabolism ratio has the potential to phenotype tumors that may help NSCLC patient management by identifying those who may benefit from more vigorous intervention. It would be interesting to investigate whether those patients whom we identified with high metabolism and low flow showed worse prognosis, and as such, a follow-up study could be useful.
Study limitations include the difficulty of covering whole tumor volumes on CT components of PET/CT, even though our detector coverage was 4 cm. Respiratory motion is always a difficult component of imaging the lung. The software used in this study allows compensation for movement during shallow breathing, allowing longer DCE protocols. However, some investigators perform acquisitions in suspended respiration, 5 which overcomes many technical issues but is dependent on patient breath-hold, which can be reduced in many lung cancer patients owing to the common comorbidity with emphysema. 36 Difficulty analyzing tumors close to the major vessels is another technical challenge that limits the success rate of the technique. PET/CT is a relatively high–radiation exposure investigation, so we adopted a lower temporal resolution DCE acquisition. For this reason, we derived the maximal tumor enhancement and SPV rather than quoting perfusion, which would have been underestimated owing to undersampling. Despite the size of our population, surgically proven positive nodal disease was rare in this cohort, and this limited the statistical power for comparison observations between nodal and nonnodal parameters.
Conclusion
We present preliminary integrated 18F-FDG-PET/DCE data from 64 NSCLC patients showing that these tumors have an uncoupled metabolic-vascular phenotype, which may be reflected by the poor prognosis of this malignancy. Tumor subtypes showed different metabolic flow associations. The combined metabolic-vascular footprint had an association between SCC and adenocarcinoma that may be helpful clinically in managing lung cancer patients with current trends toward targeted, individualized treatment regimens.
Footnotes
Acknowledgment
Financial disclosure of authors: Funding was received from the Royal College of Radiologists (UK) and our local Department of Health Research Network Comprehensive Clinical Research Network. University College Hospital (NHS) Trust/University College London receives a proportion of funding from the Department of Health's National Institute for Health Research Biomedical Research Centre's funding scheme.
Financial disclosure of reviewers: None reported.