
Abstract
Considering the high cost of dedicated small-animal positron emission tomography/computed tomography (PET/CT), an acceptable alternative in many situations might be clinical PET/CT. However, spatial resolution and image quality are of concern. The utility of clinical PET/CT for small-animal research and image quality improvements from super-resolution (spatial subsampling) were investigated. National Electrical Manufacturers Association (NEMA) NU 4 phantom and mouse data were acquired with a clinical PET/CT scanner, as both conventional static and stepped scans. Static scans were reconstructed with and without point spread function (PSF) modeling. Stepped images were postprocessed with iterative deconvolution to produce super-resolution images. Image quality was markedly improved using the super-resolution technique, avoiding certain artifacts produced by PSF modeling. The 2 mm rod of the NU 4 phantom was visualized with high contrast, and the major structures of the mouse were well resolved. Although not a perfect substitute for a state-of-the-art small-animal PET/CT scanner, a clinical PET/CT scanner with super-resolution produces acceptable small-animal image quality for many preclinical research studies.
THE VALUE OF MOLECULAR IMAGING of small animals with positron emission tomography (PET) is widely recognized in preclinical research and drug development.1–3 High spatial resolution is required to visualize structures of interest and to maintain quantitative accuracy. Dedicated small-animal PET scanners with specialized high-resolution detectors have been developed and are available commercially.4–6 Many commercial small-animal scanners are hybrid PET/computed tomography (CT) systems with both PET detectors and x-ray CT detectors. Integrated PET/CT provides the additional benefits of coregistered molecular and anatomic images and of CT-based data corrections for PET attenuation and scatter. Although this instrumentation is valuable for preclinical research, the cost of acquiring a dedicated small-animal PET/CT scanner and of maintaining a dedicated preclinical research laboratory is high. Many laboratories would benefit from a lower cost alternative to dedicated small-animal PET/CT, even at the expense of reduced image quality.
One possible solution is the large installed base of clinical PET/CT scanners that could be available off-hours at many institutions for preclinical research studies. Although the performance of clinical PET/CT does not rival that of dedicated small-animal scanners, there has been steady improvement in image quality. Modern detectors for clinical whole-body PET/CT scanners have fine arrays of scintillation crystals, producing images with spatial resolution in the range of 4 to 5 mm. Advanced reconstruction algorithms that more accurately model the point spread function (PSF) are also available on commercial PET/CT systems.7,8 The PSF model accounts for the crystal dimensions and for parallax from photon penetration. Incorporating this information improves the accuracy of reconstruction and recovers some spatial resolution otherwise lost by traditional reconstruction models.
Our underlying motivation is to investigate whether clinical PET/CT is feasible for preclinical research with small animals. Although a clinical PET/CT scanner is more expensive than a dedicated small-animal PET/CT scanner and requires additional precautions and approvals for animal use, the fact that clinical PET/CT is widespread and may have underused capacity makes it worthy of consideration. Other groups have studied this topic and have reported that clinical PET scanners are useful for some small-animal imaging tasks.9–16 Imaging large implanted tumors was considered feasible provided that the tumor was large enough (> 10 mm diameter) to avoid quantitative errors from the partial volume effect. However, the poor spatial resolution remains an issue for visualizing and quantifying smaller tumors and other structures in mice. Spatial resolution is less of an issue for rats, rabbits, and other larger animals but is still a concern. Although clinical PET scanners are useful for preclinical research, severe limitations prevent them from replacing high-resolution dedicated small-animal scanners.
Our focus is thus to improve small-animal image quality for clinical PET/CT. One innovative approach taken by another group has been to build ultrahigh resolution detectors in combination with clinical detectors, also known as “virtual-pinhole PET.” 17 Instead, we focus on inexpensive ways to improve image quality with minimal hardware. For small-animal single-photon emission computed tomography (SPECT)/CT, we accomplished this goal with a multipinhole collimation device and clinical SPECT/CT detectors. 18 For small-animal PET/CT, we pursue a similar approach where a stand-alone device with an animal bed is placed on the patient bed of a clinical PET/CT scanner. This device allows the phantom or mouse to be stepped in three dimensions so that image quality is improved with superresolution.
Super-resolution may be described as recovering spatial resolution by combining blurred data from multiple spatial samples.19,20 Various algorithms may be implemented to produce the final image estimate, but, basically, a deconvolution process is performed using a measured or estimated kernel that models the image blur. Substantial improvements in resolution and image quality are possible, although the ability to recover high-frequency components of the data is limited. Other groups have studied super-resolution as applied to PET scans of clinically sized objects, for which count density and expectations of spatial resolution are lower than for preclinical studies.21–24 We applied superresolution methods to small-animal data (phantom and mouse) acquired with clinical PET/CT and investigated what improvements in image quality are possible for preclinical research. Super-resolution images are compared to those reconstructed using the algorithms available on the clinical workstation. Our goal is to assess the feasibility of this technique for preclinical research as an inexpensive alternative to dedicated small-animal PET/CT.
Materials and Methods
Data Acquisition
Imaging was performed using a clinical PET/CT scanner (Biograph mCT, Siemens Molecular Imaging, Hoffman Estates, IL). The PET detectors consist of 32,448 lutetium oxyorthosilicate (LSO) crystals of dimensions 4 × 4 × 20 mm3 arranged in 13 × 13 blocks. The crystals are situated at a diameter of 842 mm and cover an axial field of view of 216 mm. Vendor specifications for the reconstructed spatial resolution at the center of the field of view are 4.5 mm (transaxial) and 4.4 mm (axial) full-width at halfmaximum (FWHM), measured according to the National Electrical Manufacturers Association (NEMA) NU 2-2007 standard 25 using the filtered backprojection algorithm. Iterative reconstruction using the ordered subsets expectation maximization (OSEM) algorithm is also available. OSEM reconstruction may be performed with PSF modeling of the detector elements 7 and with time-of-flight (TOF) information. The CT portion of the scanner is capable of acquiring up to 128 slices per rotation at a contrast resolution up to 30 line pairs per centimeter.
After acquiring a scout topogram and a CT scan, phantom or animal PET data were acquired in list mode and in two spatial modes: static or stepped. First, the static PET scan was acquired for 16 minutes with the phantom or animal positioned in the center of the field of view. This was followed by a stepped PET scan, where a second 16-minute scan was acquired while stepping the phantom or animal at 1-minute intervals in the three orthogonal directions. The stepping was achieved using the apparatus shown in Figure 1. The device containing three motorized linear stages (two Model LTA-HS and one Model ILS-250, Newport Corporation, Irvine, CA) and a small-animal bed was placed on the patient table of the clinical PET/CT scanner. The stages were programmed to step the animal bed at 16 locations (listed in Table 1) at 1-minute intervals for a total 16-minute PET acquisition. The stepping volume (8 mm cubic region) was selected to be larger than the scanner's FWHM resolution to ensure thorough subsampling. The timing of the motion was synchronized manually to the PET data acquisition by pressing the start buttons simultaneously.
Spatial Sampling Used for the Stepped Super-Resolution Images

Distances are relative to the starting location.

Apparatus for stepped PET acquisition. A small bed holding the phantom or animal is attached to three motorized linear stages arranged in orthogonal directions (X, Y, Z). The entire apparatus is placed on the patient table of the clinical PET/CT scanner so that the phantom or animal is centered in the scanner field of view. The clinical scanner acquires CT images first and then moves the table to the rear of the gantry for the stepped PET acquisition.
Phantom
To evaluate spatial resolution and image quality of a known radionuclide distribution, the NEMA NU 4-2008 image quality phantom was imaged. 26 This cylindrical phantom is designed to evaluate the imaging performance of small-animal PET scanners and has a size (internal diameter of 30 mm and axial length of 50 mm) similar to that of a small rodent. The NU 4 phantom consists of three regions. The resolution portion contains hot rods of 5, 4, 3, 2, and 1 mm diameter in a cold background for evaluating contrast resolution. The contrast portion contains water- and air-filled cylinders of 8 mm diameter in a hot background for evaluating the accuracy of attenuation and scatter corrections. The uniformity portion contains a hot background with no structures for evaluating noise and nonuniformity artifacts.
The NEMA NU 4-2008 protocol for the image quality phantom is to image for 20 minutes with 3,700 kBq (100 μCi) 18F solution at the start of imaging, which for this phantom corresponds to a starting activity concentration of 176 kBq/mL. For simplicity in data acquisition and flexibility in data processing, the phantom was filled with excess activity (500 kBq/mL) and imaged for 16 minutes to allow for 16 1-minute dynamic imaging frames. Based on the activity assay time and the actual start times of the static and stepped acquisitions, the list mode frame durations were truncated to achieve an effective count density and scan time matching the parameters of the NEMA protocol. Dead time losses for the clinical PET detectors were negligible at these count rates.
Animals
To evaluate image quality in a typical preclinical scan, mice were imaged under a protocol approved by the Institutional Animal Care and Use Committee at our institution. Two female BALB/C mice (The Jackson Laboratory) 6 to 8 weeks of age and each weighing 28 g were injected via the tail vein with 5 MBq 2-deoxy-2-[18F]fluoro-D-glucose (FDG) in a nonfasting state. The mice were awake and in a room temperature environment during a 60-minute uptake period. Afterward, each mouse was anesthetized by intraperitoneal injection of pentobarbital (50 mg/kg body weight) and placed on the animal bed of the stepping apparatus for imaging with the clinical PET/CT scanner as described above.
Data Processing
The static PET data were reconstructed using the available software on the scanner workstation. For these studies, the TOF capability was disabled during reconstruction because the phantom and animal sizes were much smaller than the TOF kernel. PET images were reconstructed with PSF modeling (denoted as “PSF” images) and without PSF modeling (denoted as “no PSF” images). Images were reconstructed on the scanner workstation using the OSEM algorithm with 8 iterations, 24 subsets, no postfiltering, 512 × 512 matrix size (1.6 mm pixels), and native slice thickness of 2.0 mm. The reconstruction was set to use a zoom factor of 3 and to match the CT slice interval, thereby outputting resampled images with 0.53 mm × 0.53 mm pixels at 1.0 mm slice intervals. Standard CT-based corrections for attenuation and scatter were used.
The stepped PET data first were reconstructed on the scanner workstation (without PSF modeling) as 16 separate PET image sets using the same parameters as the static images above. The list mode data were histogrammed at 16 frames to match the timing of the stepped motion sequence. To have proper CT-based corrections, the PET/CT image coregistration matrix was manually shifted prior to reconstruction in 1.0 mm steps in the orthogonal directions to match the stepped motion sequence. After reconstruction, iterative deconvolution was performed using the Richardson-Lucy algorithm27,28 according to
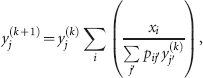
where xi is the stepped image voxels (with the index i encompassing all 16 frames), yj is the super-resolution image voxels, pij represents the probability matrix element, and k is the iteration number. The kernel underlying the probability estimate was based on a three-dimensional gaussian distribution of 4 mm FWHM to approximately match the PET spatial resolution. Deconvolution was stopped after 50 iterations, at which convergence was visually determined. The output PET super-resolution images were produced with isotropic 0.5 mm voxels to better visualize the resolution gains from the deconvolution process.
Results
Phantom
PET and CT images of the NEMA NU 4 phantom are displayed in Figure 2. All features are visible in the coregistered CT images, which provide a reference map for the PET images. Several differences are clearly visible between the no PSF and PSF images (static) and the superresolution images (stepped). As expected, the PSF images were sharper than the no PSF images; however, the PSF images appeared distorted and overcompensated for blur. The super-resolution images were sharper but not distorted, and the rods (5, 4, 3, 2, and 1 mm diameters) were true to their actual shapes and locations. The 2 mm rod was much more clearly visualized in the superresolution images than in the no PSF and PSF images. Also, the 1 mm rod was visible in the super-resolution images but not seen well in the no PSF and PSF images.

Images of the NEMA NU 4 phantom obtained with the clinical PET/CT scanner: rod transaxial slice (top row), cylinder transaxial slice (middle row), and coronal slice (bottom row). The PET images (first three columns) show varying degrees of resolution, contrast, and Gibbs ringing artifact depending on the method. Corresponding CT images are shown in the right column.
A complete NEMA NU 4 test report for the image quality phantom is given in Table 2. The recovery coefficients (RCs) are indicative of the spatial resolution of the reconstructed images. (Note that the NEMA NU 4 protocol measures spatial resolution in terms of a 22Na point source [≤ 0.3 mm] in air and specifies filtered backprojection reconstruction, which cannot be used here because the PSF and super-resolution studies require iterative reconstruction and iterative deconvolution, respectively.) The RCs for the rods (in descending order of diameters) were measured to be 0.97, 0.90, 0.67, 0.39, and 0.10 for the super-resolution images; 0.62, 0.45, 0.26, 0.13, and 0.04 for the no PSF images; and 2.14, 1.16, 0.59, 0.21, and 0.05 for the PSF images. The PSF RCs were artifactual (exceeding 100%) because of PSF overcompensation during reconstruction.
Summary Reports for the NEMA NU 4 Image Quality Phantom

Adapted from National Electrical Manufacturers Association. 26
PSF = point spread function. SOR = spillover ratio; %STD = percent standard deviation.
Image reconstruction parameters: no PSF: three-dimensional ordered subsets expectation maximization (3D OSEM), 8 iterations, 24 subsets, no postfilter; PSF: 3D OSEM with PSF modeling, 8 iterations, 24 subsets, no postfilter; super-resolution: same as no PSF, followed by 16-frame iterative deconvolution (Richardson-Lucy, 50 iterations).
Phantom activity: 100 μCi at 176 kBq/mL (effective activity and concentration during list mode processing).
A notable observation is that the resolution-enhanced images (PSF and super-resolution) had overshoot in the intensity of edge voxels at high-contrast boundaries, often described as ringing or Gibbs′ overshoot artifact. It is well known that image enhancement algorithms are susceptible to ringing.29,30 The ringing was very pronounced in the PSF images but was of minor significance in the super-resolution images. No ringing was seen in the no PSF images.
Animals
Mouse PET transaxial slices and maximum-intensity projection (MIP) images are displayed in Figure 3 and Figure 4, respectively. Given that the mouse was not fasting, there was significant muscular uptake in the legs, heart, and other regions, in addition to the bladder and brain. Given that the mouse was not warmed during the uptake period, there also was uptake in brown adipose tissue (BAT). The nonfasting and nonwarmed state provided more features to resolve than would have been present in a fasting and warmed mouse.
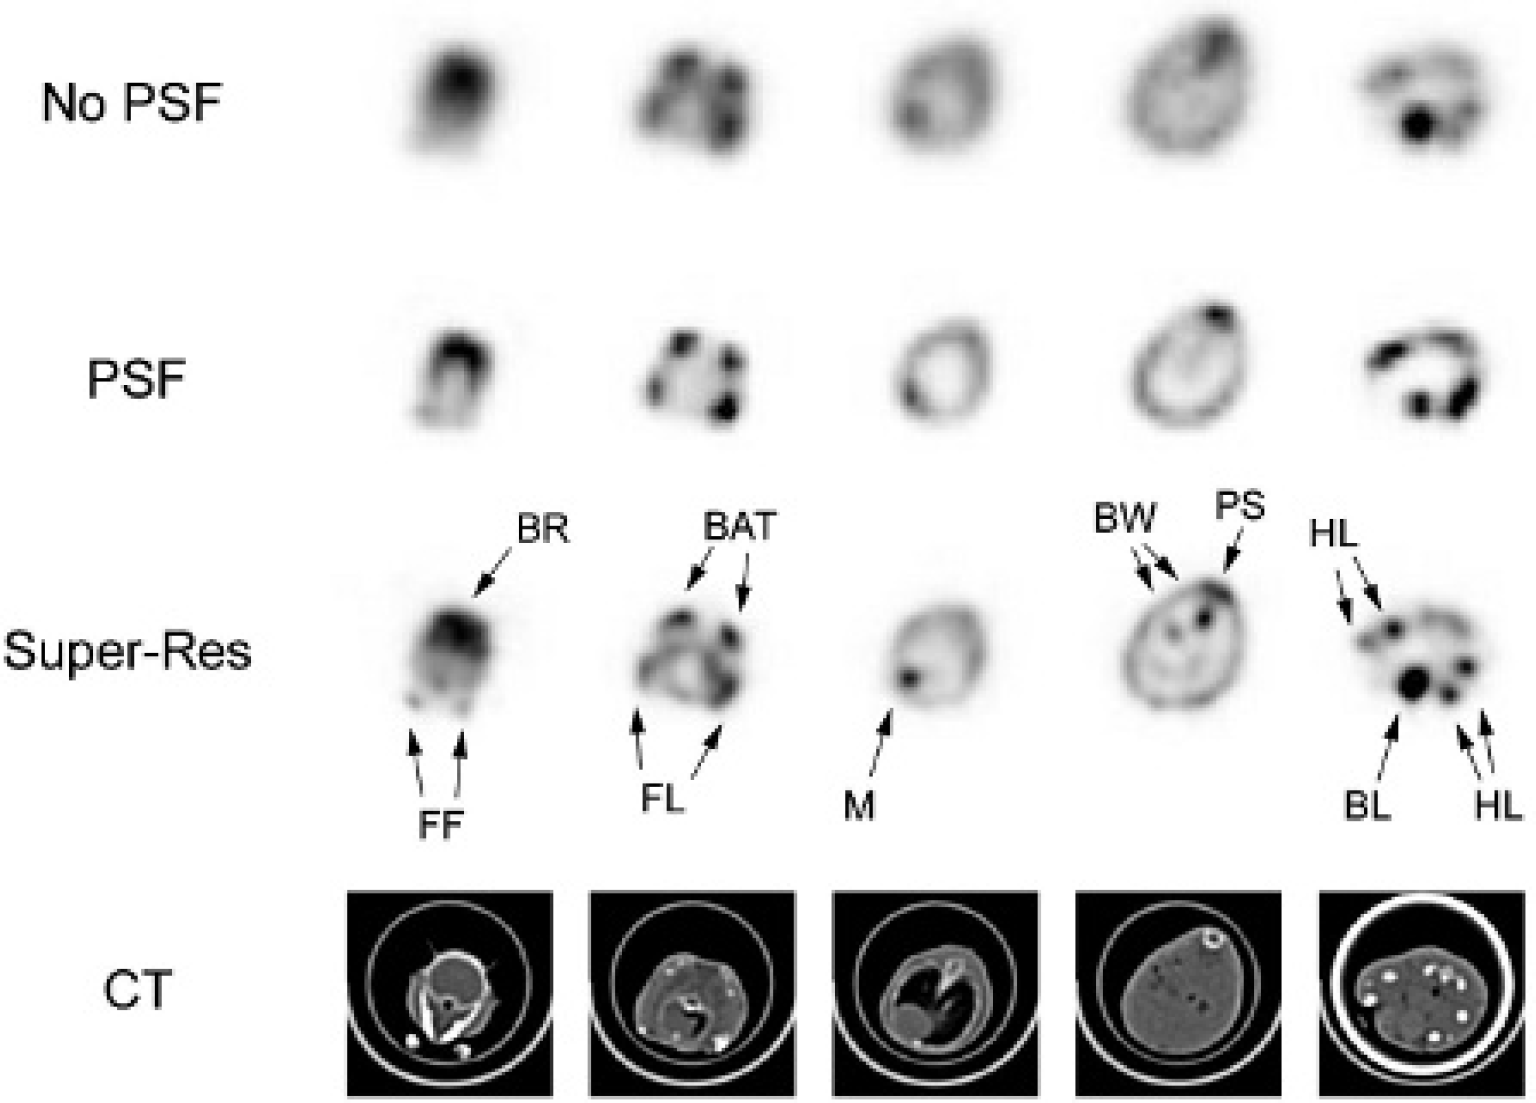
Transaxial slices of a 28 g mouse injected with FDG were reconstructed from the static PET data without (first row “No PSF”) and with (second row “PSF”) point spread function (PSF) modeling using the clinical workstation. The super-resolution images (third row “Super-Res”) were produced from the stepped PET data using iterative deconvolution postreconstruction. The corresponding CT slices (fourth row) also are shown. Brightness and contrast were adjusted per PET image for optimal display. The super-resolution images consistently show improved image quality and resolve structures not visible in the no PSF or PSF images. Structures are identified and labeled as follows: brain (BR), front feet (FF), brown adipose tissue (BAT), muscles of the front legs (FL), myocardium (M), bowel uptake (BW), paraspinal muscles (PS), bladder (BL), and muscles of the hind legs (HL).

Maximum-intensity projection images of a 28 g mouse injected with FDG illustrating improved reconstruction using the super-resolution method (“Super-Res”) compared to the available reconstructions on the clinical workstation (“No PSF” and “PSF”). Structures are identified and labeled as follows: harderian glands (HG), neck uptake (NK), brown adipose tissue (BAT), muscles of the front legs (FL), front feet (FF), myocardium (M), bladder (BL), muscles of the hind legs (HL), and hind feet (HF).
The mouse super-resolution images from the stepped PET data had superior image quality overall. The front and hind leg muscles were visualized better and were distinguished easily from BAT. Bladder uptake was well defined and did not significantly spill over into nearby structures. Myocardial uptake was clearly visible, although the myocardial walls could not be resolved owing to limited spatial resolution. Bowel uptake was more clearly delineated. In the transaxial slices of Figure 3, the front feet (first column) and the hind leg muscles (fifth column) could be resolved much better in the super-resolution images. The bilateral uptake in the harderian glands and neck could be seen well in the coronal view of the MIP super-resolution image in Figure 4. There were no noticeable ringing artifacts.
The PSF images were significantly sharper than the no PSF images; however, the PSF image quality was not as high as that of the super-resolution images. The PSF modeling created certain artifacts that were not present in the no PSF or super-resolution images. In some instances, it appeared that the PSF reconstruction erroneously placed activity between structures, causing nearby foci of FDG uptake to appear more as a single focus. For example, the focal FDG uptake in the hind legs in the transaxial slice (see Figure 3, fifth column) and neck in the MIP image (see Figure 4) shows much worse separation in the PSF images compared to the super-resolution images.
Discussion
Although image quality in clinical PET has improved in recent years through advances in detector resolution and image reconstruction, the no PSF and PSF images of the NEMA NU 4 phantom and of the mouse injected with FDG illustrate the limits of clinical PET scanners for preclinical use. With a spatial resolution greater than 4 mm, the no PSF images did not adequately resolve the organ FDG uptake in mice. PSF modeling did improve the overall resolution and contrast. The measured spatial resolution of a point source in air has been reported to be 2 mm FWHM over the entire scanner field of view when using PSF reconstruction.7,8 However, the relatively simple task of imaging a point source in air does not really demonstrate the performance when imaging an extended source, for which resolution gains are more modest. 8 Even though the spatial resolution was improved by PSF modeling, the PSF images did not exhibit the same resolution that a dedicated small-animal PET scanner with 2 mm FWHM would produce. Furthermore, the artifacts seen in the PSF images are worrisome, suggesting that the PSF reconstruction is affected by an insufficiently small voxel size and/or inaccuracies in the system model and is overcompensating for the lack of resolution. Although the clinical scanner outputs resampled images with 0.53 mm pixel size, it is not designed to reconstruct images at this level of resolution and is susceptible to such artifacts. The super-resolution images using stepped PET data demonstrated noticeable improvements in phantom and mouse image quality. Structures were visualized with higher resolution and contrast compared to PSF and with much less distortion. Although some ringing artifact was present in the super-resolution phantom images, it was significantly less intense than in the PSF images and was not noticed in the super-resolution animal images.
Overall, the PET image quality was improved by superresolution, but not to the same level as that of a dedicated small-animal PET image. Based on the actual size of the phantom structures and mouse anatomy and on their appearance in images, our visual estimation is that the effective spatial resolution of the super-resolution images is approximately 2.5 mm. Although better than the other clinical PET images, the clinical PET with super-resolution is clearly not a substitute for dedicated small-animal PET with 1.5 mm spatial resolution. For brain imaging, myocardial imaging, and small tumor imaging, dedicated small-animal PET is clearly superior; however, clinical PET with super-resolution still may be useful for in vivo measurement of whole-brain and whole-heart uptake. For imaging large tumors and xenografts, clinical PET with super-resolution may be a valid alternative in many cases. Clinical PET with standard reconstruction (no PSF) has already been reported as useful for in vivo uptake measurements of large tumors; however, quantitative errors from partial volume effect remained a concern. Super-resolution would significantly reduce partial volume errors and would allow for quantitative experiments with tumors smaller than 10 mm in diameter. The NEMA NU 4 phantom images had an RC of 90% for the 4 mm diameter rod. Although imaging a lesion with background activity in an animal represents a different task, it appears likely that the uptake of a 6 mm tumor can be accurately quantified. Studies tracking tumor uptake versus time represent a large fraction of small-animal PET studies, meaning that clinical PET with super-resolution would be an acceptable alternative to dedicated small-animal PET in many cases.
The super-resolution technique in these experiments used a 16-step sequence with iterative Richardson-Lucy deconvolution applied in image space with certain parameters (50 iterations, 4 mm gaussian kernel, 0.5 mm voxel size). There are, of course, other possible implementations of super-resolution that could be investigated to further optimize image quality. These include other deconvolution methods, bayesian algorithms using CT image information, varying the number of steps in the PET acquisition, and varying the number of iterations, kernel size, and voxel size. Optimizing the parameters of the super-resolution procedure is a topic of future research. As with any deconvolution technique, image noise is amplified as resolution is recovered. This is evident in the NEMA NU 4 measurements in Table 2 as the noise (%STD) for the uniformity region is substantially higher for the super-resolution images (4.1%) in comparison with the no PSF images (1.9%). However, the noise for the PSF images (7.7%) is significantly higher than that of the super-resolution images, which indicates that the spatial sampling helps constrain the noise amplification. Although the %STD image noise measurement is included in the NEMA NU 4 protocol, it is not a definitive indicator of image quality. A task-based phantom that, for example, simulates lesion detection would be a better phantom for optimizing parameters for stepped sampling, reconstruction, and deconvolution.
There is also room for optimization of the sampling sequence itself. The manipulation of the clinical PET data was tedious because of the large number of reconstructions performed with manual shifting of the CT images to match the stepped sequence, for accurate attenuation and scatter correction. A fewer number of steps may be more optimal for routine use but may reduce image quality. 19 A possibly better approach would be to include the spatial stepping and CT shifting within the reconstruction model,23,24 but this reconstruction algorithm is not available on the scanner workstation and would require significant software development.
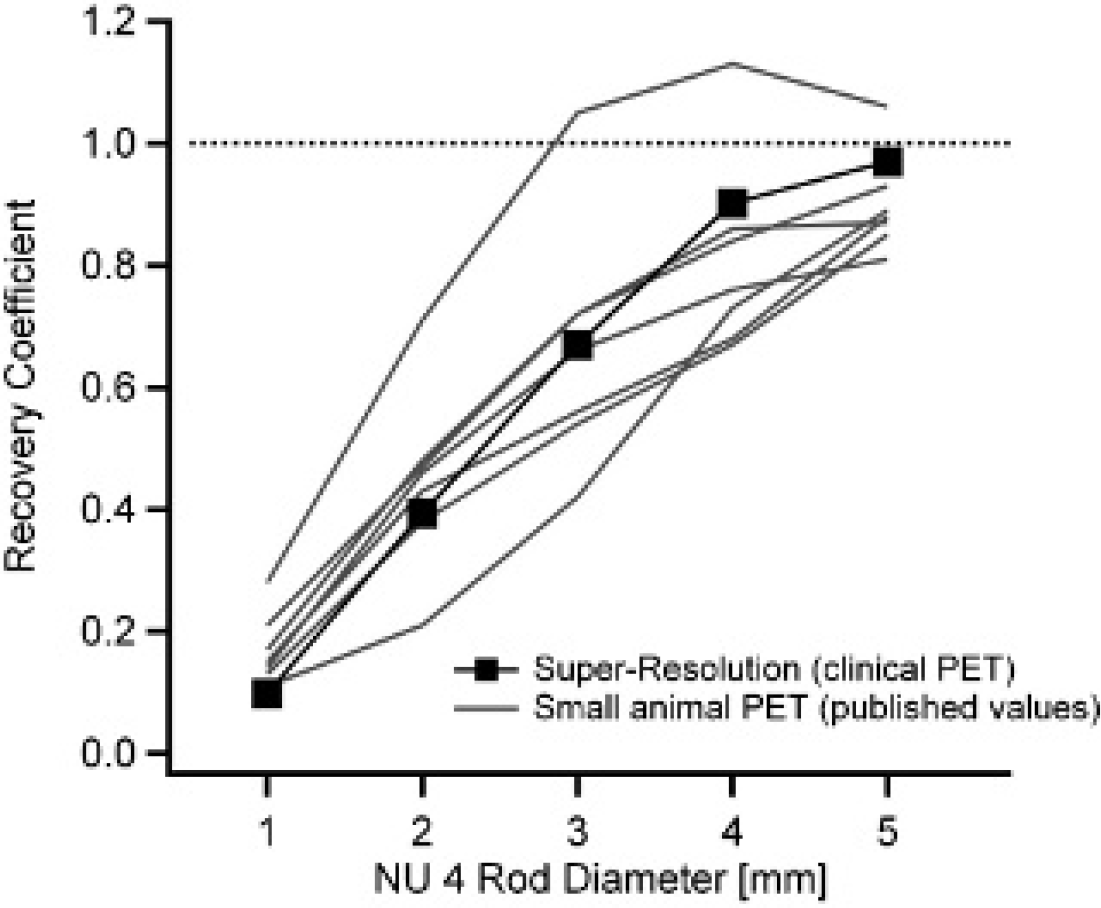
A limitation of this work is that a dedicated small-animal PET scanner was not available at our institution for a side-by-side comparison of mouse image quality. (In fact, the lack of such a scanner motivated our research on this topic.) We recognize that clinical PET with super-resolution has poorer spatial resolution and image quality in comparison with a dedicated small-animal PET. For example, a state-of-the-art dedicated small-animal PET scanner is able to resolve the myocardial walls and left ventricle,3,4 whereas in the super-resolution images of Figure 3, the myocardium appears as a single blurred structure. We are able to make a direct comparison with published phantom data, however. Several groups have reported RCs for the hot rods of the NU 4 phantom imaged on various small-animal PET scanners.31–35 RCs ranged between 0.81 and 0.97, 0.67 and 0.86, 0.42 and 0.74, 0.21 and 0.48, and 0.11 and 0.21 for the 5, 4, 3, 2, and 1 mm rods, respectively. One group also measured a considerably higher RC (1.06, 1.13, 1.05, 0.71, and 0.28) when using a maximum a posteriori iterative reconstruction, however, with some resolution recovery error (Gibbs′ overshoot). 33 The RCs measured from clinical PET with super-resolution (0.97, 0.90, 0.67, 0.39, and 0.10) compare well to the published RCs from dedicated small-animal PET (Figure 5).
A disadvantage of super-resolution compared to dedicated small-animal PET is that the stepped PET acquisition is not conducive to dynamic imaging experiments because fast frame rates would not allow for stepping during frames. However, an advantage of super-resolution is that the clinical PET offers a larger axial coverage than a typical dedicated small-animal PET, for which multibed acquisitions are often necessary. The sensitivity of a clinical PET (measured to be 5.8% at the center of the field of view for the scanner used in these experiments) is also comparable to that of a dedicated small-animal PET (typically between 1 and 10% in the center of the field of view).
It is worth noting that the CT image quality from the clinical PET/CT scanner (see Figure 3) is quite good, although not at the same level as that from a dedicated small-animal CT scanner. Nonetheless, for many preclinical imaging tasks, the CT is needed mainly for PET anatomic mapping and for PET data corrections. Considering the fact that a large majority of clinical PET scanners in use are hybrid PET/CT scanners, and considering the cost of a dedicated small-animal hybrid PET/CT system, the clinical CT images will be an acceptable alternative for many preclinical studies.
It is also worth noting that our super-resolution approach is also applicable to dedicated small-animal PET scanners. Current state-of-the-art scanners report spatial resolution in the 1.5 to 2.3 mm range.32–37 Advanced iterative reconstruction with PSF modeling available on several dedicated small-animal PET workstations further improves spatial resolution. However, given our experience with PSF reconstruction on a clinical scanner, the actual recovery of spatial resolution is limited, and the possibility of image distortion and artifacts cannot be ignored. Based on our clinical PET/CT data, superresolution would likely further improve image quality over PSF reconstruction in dedicated small-animal PET. We would expect some submillimeter structures to be resolved in super-resolution studies acquired on dedicated small-animal PET scanners.
Conclusion
For NEMA NU 4 phantom and FDG mouse data acquired on a clinical PET/CT scanner, image quality with superresolution is significantly improved compared to standard iterative reconstruction and advanced image reconstruction with PSF modeling. The hardware and software required to implement super-resolution on a clinical PET/CT scanner are relatively inexpensive and practical. Although a clinical PET/CT scanner with super-resolution is not a perfect substitute for a dedicated small-animal PET/CT scanner, it is an acceptable alternative for many preclinical research studies when a dedicated small-animal PET/CT scanner is not available.
Footnotes
Acknowledgment
Financial disclosure of authors: This research was supported in part by an American Asthma Foundation Research Program Senior Investigator Award (to S. C. Erzurum) and by National Institutes of Health grant R01-HL099303.
Financial disclosure of reviewers: None reported.