
Abstract
Positive T1 contrast using gadolinium (Gd) contrast agents can potentially improve detection of labeled cells on magnetic resonance imaging (MRI). Recently, gadolinium oxide (Gd2O3) nanoparticles have shown promise as a sensitive T1 agent for cell labeling at clinical field strengths compared to conventional Gd chelates. The objective of this study was to investigate Gado CELLTrack, a commercially available Gd2O3 nanoparticle, for cell labeling and MRI at 7 T. Relaxivity measurements yielded r1 = 4.7 s−1 mM−1 and r2/r1 = 6.2. Human aortic endothelial cells were labeled with Gd2O3 at various concentrations and underwent MRI from 1 to 7 days postlabeling. The magnetic resonance relaxation times T1 and T2 of labeled cell pellets were measured. Cellular contrast agent uptake was quantified by inductively coupled plasma–atomic emission spectroscopy, which showed very high uptake compared to conventional Gd compounds. MRI demonstrated significant positive T1 contrast and stable labeling on cells. Enhancement was optimal at low Gd concentrations, attained in the 0.02 to 0.1 mM incubation concentration range (corresponding cell uptake was 7.26 to 34.1 pg Gd/cell). Cell viability and proliferation were unaffected at the concentrations tested and up to at least 3 days postlabeling. Gd2O3 is a promising sensitive and stable positive contrast agent for cellular MRI at 7 T.
MAGNETIC RESONANCE IMAGING (MRI) has emerged over the past decade as a promising modality for cellular imaging owing to its high spatial resolution and exquisite soft tissue contrast. The use of contrast agents has been instrumental in this development as contrast-labeled cells can be visualized, thus allowing their biodistribution to be tracked and monitored in vivo. To date, cellular MRI studies have been performed in various experimental systems, including neurodegenerative disorders and stroke, tumors, myocardial infarction, transplantation, and tissue engineering,1–5 to improve our understanding of normal and pathologic processes at the cellular level and to develop new cellular therapies.6,7 The majority of these studies use superparamagnetic iron oxide nanoparticles to achieve sensitive cell detection as iron oxides are readily taken up by cells and provide a strong negative contrast on T2 or T*-weighted images. However, negative agents tend to obliterate surrounding anatomy because they exert a susceptibility effect that extends well beyond the physical boundaries of labeled cells. Specific distinction of labeled cells is also difficult owing to negative contrast arising from natural sources, such as hemorrhage, susceptibility gradients around normal biologic structures, and background tissue with intrinsically low signal intensity. Owing to these fundamental drawbacks of negative contrast agents, the development of better agents that provide high sensitivity is a critical area of current research for cellular MRI applications. A promising development is positive contrast agents that provide signal enhancement and potentially more specific identification and better anatomic delineation of labeled cells.
Positive contrast, or enhanced signal from labeled cells on T1-weighted images, can be obtained from contrast agents containing the paramagnetic gadolinium (Gd) ion. This approach was initially investigated with the clinically approved chelated form (Gd-DTPA), but its main limitation was low sensitivity owing to poor uptake and retention in cells, with most reports showing modest T1 enhancement to none or diminished T1-reducing effect intracellularly. More recently, several Gd-based agents have demonstrated positive contrast visualization,8–13 either through higher relaxivities (eg, Gd-fullerenol, 8 Gadofluorine M 9 ) or higher cell uptake of contrast agents (eg, Gd hexanedione with a threefold uptake over Gd-DTPA. 10 A particularly promising class of Gd-based agents for cellular MRI is gadolinium oxide (Gd2O3) nanoparticles.14–20 These small nanoparticles can be efficiently ingested by cells and contain a high fraction of superficial Gd, thus offering key advantages over Gd chelates. One advantage is better cell uptake and retention, which have been demonstrated in several cell lines, most of which are phagocytic,15,16 and recently in a glioma cancer model. 17 Another advantage is a considerably higher relaxivity demonstrated at clinical field strengths, which enables a greater positive contrast effect and more sensitive visualization of labeled cells.
At higher fields used for preclinical imaging studies, achieving positive contrast is even more challenging owing to a decline in relaxivity of Gd compounds with increasing field strengths. 21 Very few Gd agents have been reported for high-field cellular MRI,8,12 and the performance of Gd2O3 has not been evaluated. In this study, the potential of Gd2O3 for positive contrast cellular MRI was investigated at 7 T on endothelial cells. Gado CELLTrack (BioPhysics Assay Laboratory [BioPAL], Worcester, MA), a commercially available 30 nm Gd2O3 colloid, was used to label human aortic endothelial cells, which are less phagocytic compared to cell lines in other Gd2O3 studies. Endothelial cells play a central role in angiogenesis, atherosclerosis, and cancer and are, hence, an important element in new cellular and revascularization therapies.22,23 To date, the few studies on labeling endothelial cells have employed exclusively iron oxides for their visualization on MRI.24,25 To our knowledge, this is the first application of Gd2O3 for labeling endothelial cells and, more importantly, the first high-field MRI study of Gd2O3 at 7 T. Cell uptake and visualization on MRI were investigated, as well as the effects on MR relaxation times and cell function. The goal was to establish Gd2O3 for high-field positive contrast cellular MRI and evaluate its potential for labeling endothelial cells in cardiovascular applications.
Materials and Methods
Cell Culture and Immunofluorescence
Normal human aortic endothelial cells (FC-0014) were obtained from Lifeline Cell Technology (Walkersville, MD). They were maintained in basal medium complete with appropriate supplements (VascuLife EnGS Medium Complete, LL-0002, Lifeline Cell Technology) and 1% penicillin-streptomycin. Fresh medium (13 mL) was added every 2 days, and cells were passaged 1:3 at 80% confluency in T75 flasks (BD Biosciences, Mississauga, ON) and incubated at 37°C, 5% CO2. Before passaging, cells were washed twice with 5 mL of sterile phosphate-buffered saline (PBS) and incubated with 3 mL 0.25% trypsin–0.1 mM ethylenediaminetetraacetic acid (EDTA) for 3 minutes. Then 7 mL of medium with fetal bovine serum (FBS) was added to the cells. The entire 10 mL was collected in 15 mL tubes and spun at 1,300 rpm for 5 minutes. The liquid above the cell pellet was aspirated, and the cells were resuspended in fresh medium, passaged, and maintained according to company instructions.
Cell phenotype was confirmed by visualizing the expression of endothelial cell–specific von Willebrand factor (vWF) on immunofluorescence. Cells were grown on sterile coverslips for 3 days to allow for adhesion and proliferation. Samples were then fixed in 5% formalin in PBS for 15 minutes at room temperature (RT). After washing twice with 1× PBS, cells were permeabilized with ice-cold methanol for 10 minutes at −20°C to target internalized protein markers. Excess methanol was washed off twice with 1× PBS and blocked with 4% bovine serum albumin and PBS + 0.05% Tween (PBST) at RT for 1 hour. For the primary antibody, endothelial cells were incubated with mouse monoclonal vWF IgG1 antibody (1:300; Abcam, ab68545, Cambridge, MA) for 2 hours at RT and then washed five times (5 minutes/wash) with 1× PBST. For the secondary antibody, cells were incubated with polyclonal goat-antimouse IgG-H&L (Texas red) (1:400; Abcam, ab6787) for 1 hour at RT, and excess antibody was washed off five times with 1× PBST (5 minutes/wash). Cells were counterstained with VECTASHIELD Mounting Medium with DAPI for 1 minute (H-1200, Vector Laboratories, Burlingame, CA) and mounted onto slides.
Contrast Agent and Cell Labeling
Gado CELLTrack (–) (CL-50P02-6) was purchased from BioPAL, Inc. for cell labeling. This nanoparticle has been highly dialyzed and consists of Gd2O3 and a polymer coating of dextran. The entire complex retains a negative charge and was mixed with a cationic amino acid polymer, poly-L-lysine (PLL) (CL-00-01, BioPAL), to enhance cell uptake, a procedure also applied to iron oxides. 26 Figure 1 is a schematic of the nanoparticle structure. Small volumes of Gd2O3 and PLL (2.5:1 ratio) were incubated in sterilized 1.5 mL Eppendorf tubes at RT for 1 hour to allow complete solubilization.

Cartoon illustrating the structure of PL-Gado CELLTrack consisting of a Gd oxide core covered with a polymer coat of dextran. The Gd oxide dextran complex (Gado CELLTrack) has been treated by the manufacturer to retain a negative charge. The complex when mixed with poly-L-lysine (PLL) forms a series of ionic interactions that causes PLL to combine with Gado CELLTrack. The multiple points of attachment ensure the stability of the complex. Courtesy of BioPhysics Assay Laboratory, Inc.
Endothelial cells were grown in 12-well plates (BD Falcon, Mississauga, ON) for 2 days in a 37°C, 5% CO2 humidified incubator. When 70 to 80% confluency was reached, 1 mL of fresh medium was added and cells were incubated with appropriate concentrations of Gd2O3 and returned to the incubator for 24 hours. The following Gd2O3 concentrations in the incubation medium were prepared: 0 (control), 0.002, 0.02, 0.1, 0.2, and 1 mM of Gd ion. Cells were washed three times with sterile 1× PBS to remove excess contrast agents. Fresh supplemented medium was then given to the cells (1 mL/well). The medium was changed every 2 to 3 days with subsequent washing. The last wash was carried out prior to MRI to ensure that extracellular Gd2O3 was eliminated.
Determination of Gd Content in Cells
Samples were assayed for Gd using inductively coupled plasma–atomic emission spectroscopy (ICP-AES) at the ANALEST facility (Toronto, ON). The analysis was performed on a PerkinElmer spectrometer (Model Optima 7300DV ICP AEOS, PerkinElmer, Waltham, MA) and certified against an independent source traceable to the National Institute of Standards and Technology Standard Reference Material. The detection threshold for Gd was 0.01 mg/mL. The cellular Gd concentration was determined by dividing the total Gd content by the number of cells.
Cell Viability and Proliferation Assays
To assess cell viability and proliferation, 96-well assay plates containing endothelial cells (≈ 8,000 cells in 250 μL of culture medium per well) were set up. Following a 24-hour period of cell adhesion onto the well plates, Gd2O3 was added to achieve the same concentrations as in the 12-well plate preparations for MRI. Cells were incubated with Gd2O3 for 24 hours, washed three times with 1× PBS, and either assayed immediately (1 day group) or incubated in 250 μL fresh culture medium for an additional 2 days (3-day group) or 6 days (7-day group). The medium was replaced every 48 hours. Fresh medium (100 μL) was replenished prior to performing the following assays.
CellTiter-Blue Cell Viability Assay (G8080, Promega, Madison, WI) was used to assess cell cytotoxicity following Gd2O3 incubation. Twenty microliters of CellTiter-Blue reagent was added to each well, shaken for 10 seconds, and incubated at 37°C, 5% CO2 for 2 hours. Fluorescence was recorded at 560/590 nm (Spectra MAX Gemini Microplate Spectrofluorometer, Molecular Devices, Sunnyvale, CA).
CellTiter 96 Aqueous One Solution Cell Proliferation Assay (MTS [3-(4,5-dimethylthiazol-2-yl)-5-(3-carboxy-methoxyphenyl)-2-(4-sulfophenyl)-2H-tetrazolium, inner salt; MTS]) (G3582, Promega) was used to determine the number of viable cells undergoing proliferation. Twenty microliters of combined MTS-PBS solution was dispensed into each well. Cells were incubated for 2 hours at 37°C, 5% CO2. Absorbance was recorded at 490 nm.
For all assays, samples were set up as triplicates. Blank wells (media with reagent alone) and controls (media with unlabeled endothelial cells) were included. Fluorescence versus concentration of test samples was plotted using GraphPad Prism (GraphPad, LaJolla, CA).
Magnetic Resonance Imaging
Imaging was performed on a 7 T preclinical MRI magnet (BioSpec 70/30, Bruker, Ettlingen, Germany) using Bruker commercial hardware, namely, a B-GA12 gradient coil, a 7.2 cm cylindrical linear transmit coil, and a four-channel murine phased-array receiver coil. Prior to MRI, cells were prepared as follows. From the 12-well plates used to cultivate cells for MRI, approximately 250,000 cells per well were harvested using 100 μL 0.25% trypsin and 0.1 mM EDTA and subsequent 100 μL 10% FBS medium. Cells were transferred to 200 μL pipette tips, with bottoms sealed through melting and the tips capped with polymerase chain reaction tube caps. Two pipette tips were placed in a larger 15 mL tube, which was spun for 10 minutes at 1,500 rpm to create a cell pellet. Subsequently, the old medium was aspirated from the tips, and 200 μL of fresh human aortic endothelial cell medium (Lifeline Cell Technology) was added on top of the cells. There were approximately 250,000 cells per pipette tip.
Cell pellets in the pipette tips were kept on ice during the transfer to MRI. The tips were then secured firmly in an upright position in plasticine and placed on the phased-array coil. Quantitative T1 relaxation times were measured using a two-dimensional (2D) saturation-recovery RARE sequence: RARE factor = 2; repetition time (TR) = 5,000, 3,000, 2,000, 1,500, 1,000, 750, 500, 250, 150, 125 ms; echo time (TE) = 7.43, 22.3, 37.1, 52.0, 66.8, 81.7, 96.6, 111.4 ms; field of view = 2.56 cm; slice thickness = 4 mm; in-plane resolution = 100 × 100 μm; scan time = 22 minutes. Quantitative T2 relaxation times were measured using a spin-echo Carr-Purcell-Meiboom-Gill sequence: TR = 4,000 ms; 128 echoes with TE = 4.19, 8.38, · 536.5 ms; slice thickness 5 = mm; in-plane resolution = 200 × 200 μm; number of averages = 2; scan time = 13 minutes.
T1 and T2 relaxation times were also measured for Gd2O3 in water over the same concentration range used for cell incubation (0.002–1 mM) to determine the r1 and r2 relaxivity constants at 7 T.
Data Analysis
MRI raw data were transferred to an independent workstation for quantitative data analysis. All data processing was performed using in-house software developed in Matlab version 7.8 (MathWorks, Natick, MA). Quantitative maps of T1 relaxation times were computed by nonlinear least-squares fitting to the signal intensity on the saturation-recovery curve at the minimum TE. Quantitative T2 relaxation times were computed by fitting signal intensity to a monoexponential decay function added to a constant offset to account for noise. Relaxivity constants r1 and r2 of Gd2O3 in solution were determined by linear regression analysis of the change in relaxation rates (1/T1 and 1/T2) versus Gd concentration. All data were expressed as mean value ± standard deviation. All significance testing was based on the Student t-test, with a probability value (p) < .05 considered significant.
Results
Phenotype Expression in Cultured Endothelial Cells
Cultured normal human aortic endothelial cells were examined on phase-contrast microscopy (Figure 2A), and endothelial cell phenotype expression was confirmed by monitoring the expression of endothelial cell–derived vWF (previously known as factor VIII) via immunofluorescence (Figure 2B).

Normal human aortic endothelial cells (passage 2). A, Phase-contrast microscopy (10× magnification). B, von Willebrand factor (vWF; factor VIII) immunofluorescence. Mouse monoclonal primary antibody IgG1 for vWF was detected with polyclonal goat-antimouse IgG-H&L (Texas red). Arrows indicate vWF staining (red). DAPI (blue) staining refers to fixed cell nuclei (20× magnification).
MRI Relaxivity Measurements of Gd2O3 in Solution
The relaxivity constants for Gd2O3 in water at 7 T were measured to be r1 = 4.7 s−1 mM−1 and r2 = 29.3 s−1 mM−1. These are summarized in Table 1 and compared against relaxivities of other Gd compounds measured at 7 T.27–29 Figure 3 shows the plots of relaxation rates versus Gd concentration from which r1 and r2 were estimated.
Relaxivity Constants r1 and r2 of Gd Compounds Measured at 7 T

Units for r1 and r2 (S−1 mM−1)

Relaxivity measurements of Gd2O3 in water at 7 T. A, Relaxation rates 1/T1 and 1/T2 versus Gd2O3 concentration and relaxivities r1 and r2 calculated from linear regression slopes (R 2 = .997 for r1; R 2 = .971 for r2). B, MRI signal intensity on two-dimensional saturation recovery RARE sequence (TR = 1000 ms, TE = minimum).
Shortening of T1 and T2 Relaxation Times in Gd2O3-Labeled Cells
Figure 4 shows representative T1- and T2-weighted images from the 2D RARE sequence of pelleted Gd2O3-labeled human aortic endothelial cells. A variation in signal intensity in pellets labeled with different incubation medium concentrations ([Gd] = 0.002–1.0 mM) was observed in comparison with unlabeled controls. On T1-weighted images, there is progressive signal enhancement with increasing incubation medium [Gd] over the range 0.002 to 0.1 mM. At the upper limit of [Gd] = 0.1 mM, competing T2 effects begin to offset T1 enhancement and are evident on T2-weighted images as cell pellets begin to take on a hypointense appearance. At yet higher incubation concentrations, T2 signal loss dominates, and signal voids are present on both T1- and T2-weighted images.

Representative (A) T1-weighted and (B) T2-weighted MRIs of Gd2O3-labeled endothelial cell pellets at 7 T. Cells were incubated in medium at various [Gd] concentrations. Scan parameters were (A) TR/TE = 1,000/7.4 ms and (B) TR/TE = 5,000/22.3 ms. Note that from 0.1 mM and higher, cell pellets appear hypointense owing to competing effects from T2 shortening.
Figure 5 demonstrates a decrease in both T1 and T2 relaxation times in labeled endothelial cells with increasing incubation medium [Gd]. Note that in the transition from [Gd] = 0.02 to 0.1 mM, T2 drops significantly (from 50 ms to 15 ms), thus explaining why signal enhancement on a conventional T1-weighted sequence can be gleaned from Gd2O3-induced T1 shortening only at low concentrations.
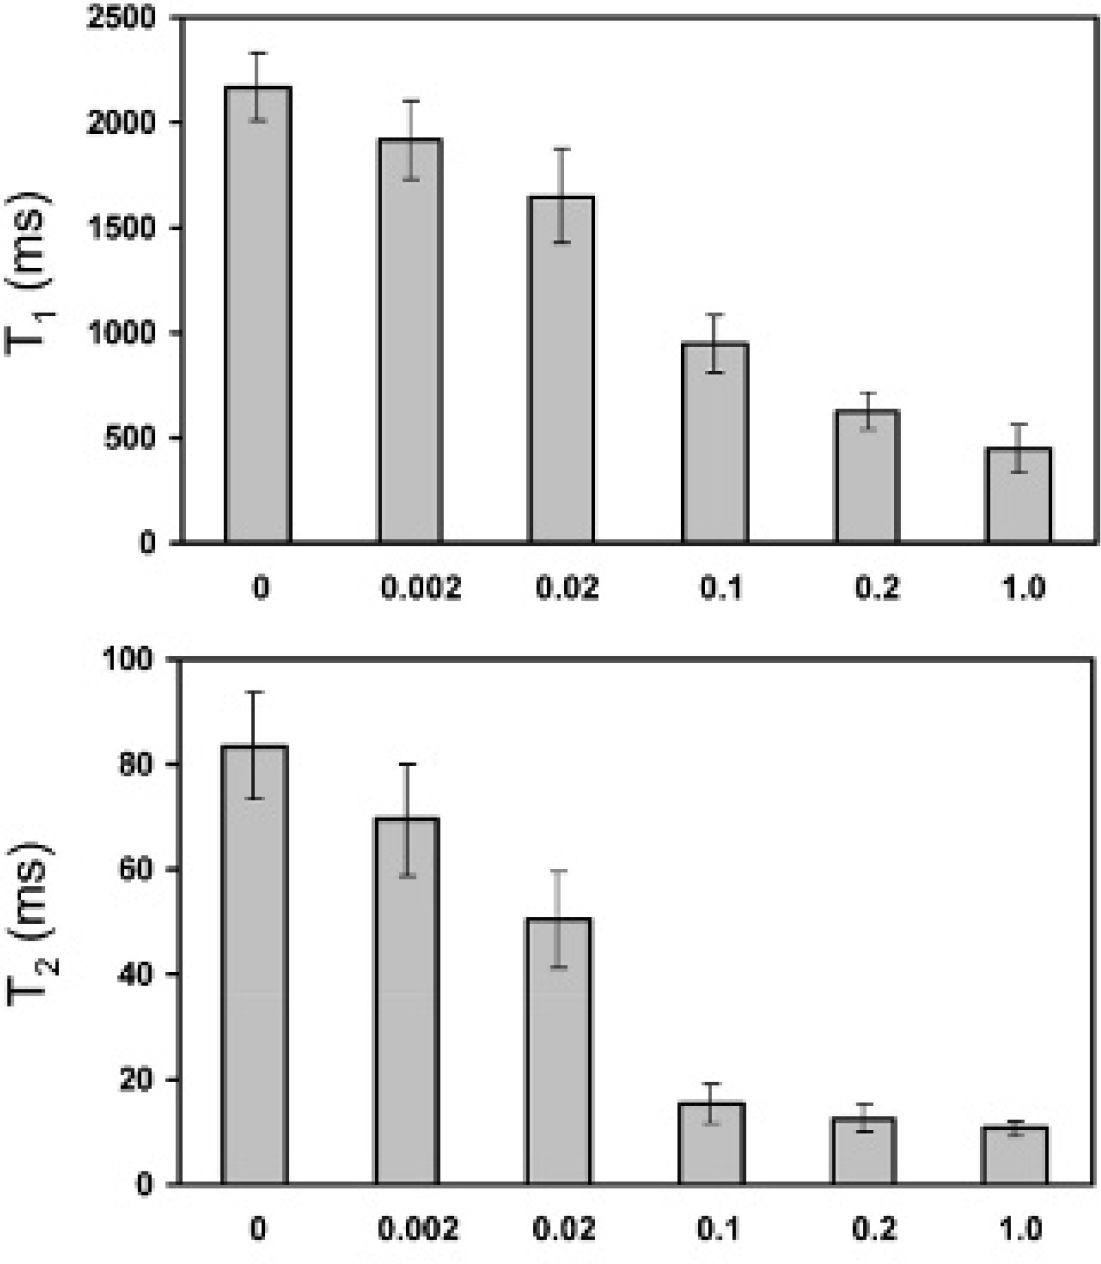
T1 and T2 relaxation times in Gd2O3-labeled endothelial cell pellets decrease with increasing incubation concentration [Gd].
Stability of Gd2O3 Labeling over Time
Figure 6 displays the stability of Gd2O3 inside labeled cells at various intervals after a 24-hour incubation period. A trend toward slowly increasing T1 and T2 relaxation times was observed at longer intervals, particularly at day 7, which could be due to signal dilution with cell proliferation. Overall, however, positive signal enhancement was maintained over 7 days post–cell labeling.
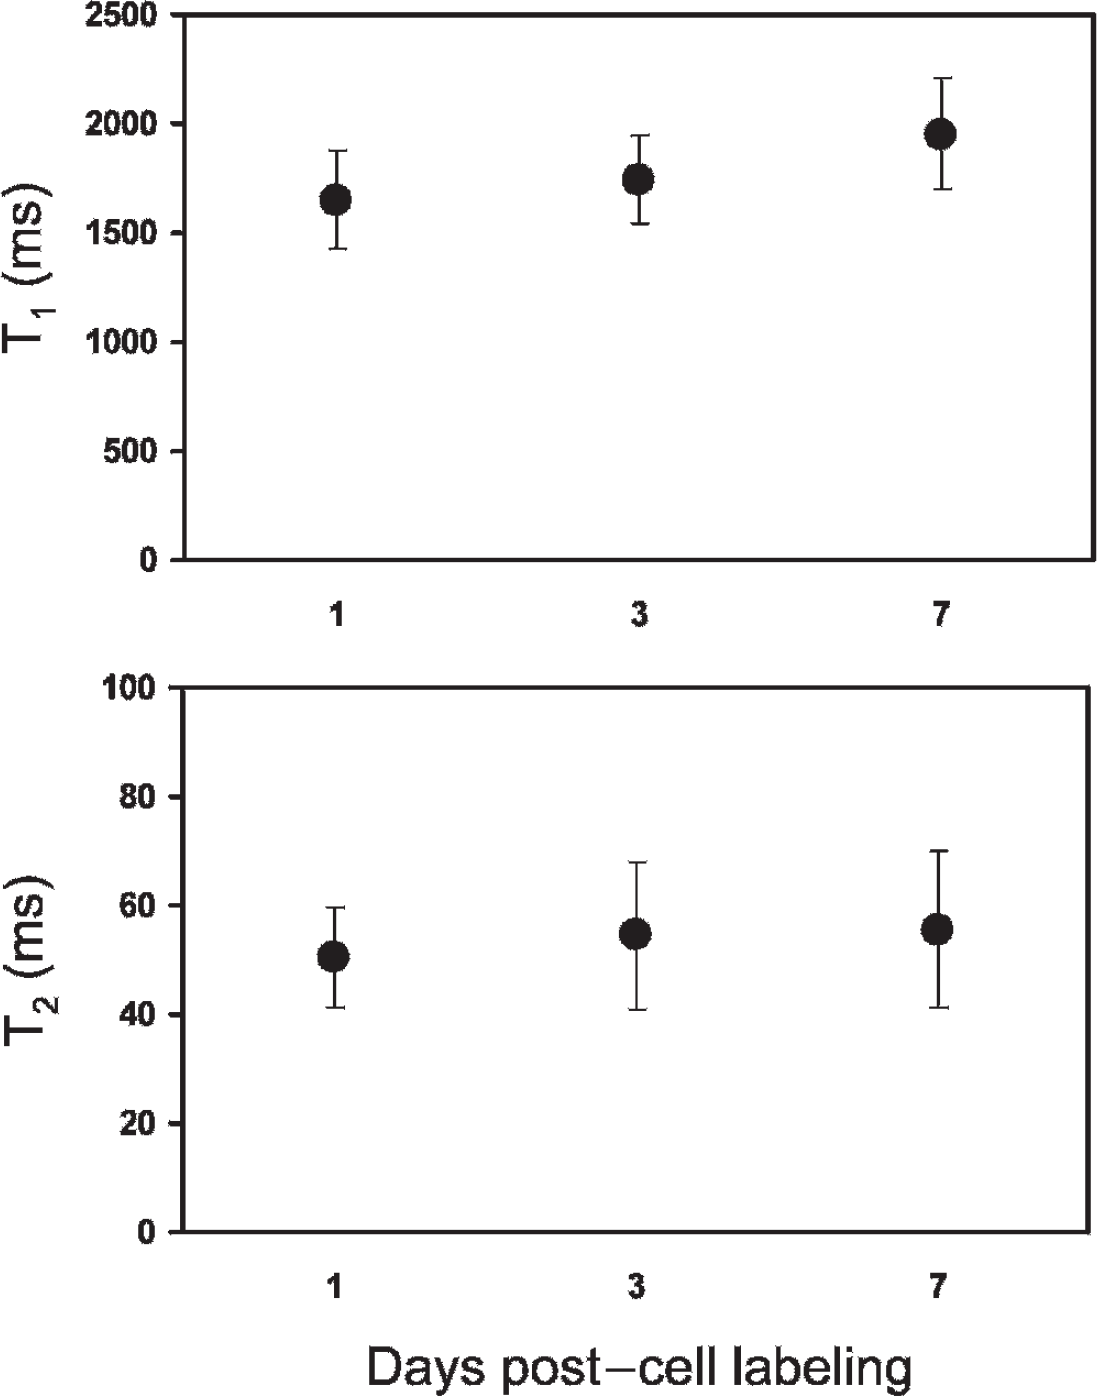
T1 and T2 relaxation times in Gd2O3-labeled endothelial cell pellets over 7 days post–cell labeling. Shown are results for [Gd] = 0.02 mM.
Cell Viability and Proliferation
Figure 7 illustrates the effect of increasing [Gd] in the incubation medium on cell viability and proliferation. Viability was not affected significantly at any of the Gd2O3 concentrations relative to unlabeled cells. Proliferation was also unaffected at the lower Gd2O3 concentrations; however, a significant decrease was observed at [Gd] = 0.2 mM and higher (p < .05).

Viability and proliferation assays show no change in Gd2O3-labeled endothelial cells relative to control (0 mM) at any of the concentrations except where indicated by an asterisk (*p < .05).
Figure 8 examines cell viability and proliferation at different time points post–cell labeling. Compared to unlabeled cells, neither viability nor proliferation was significantly altered in labeled cells at 1 and 3 days postlabeling. However, a latent effect was observed on day 7, where both viability and proliferative capacity were significantly reduced (p < .05).
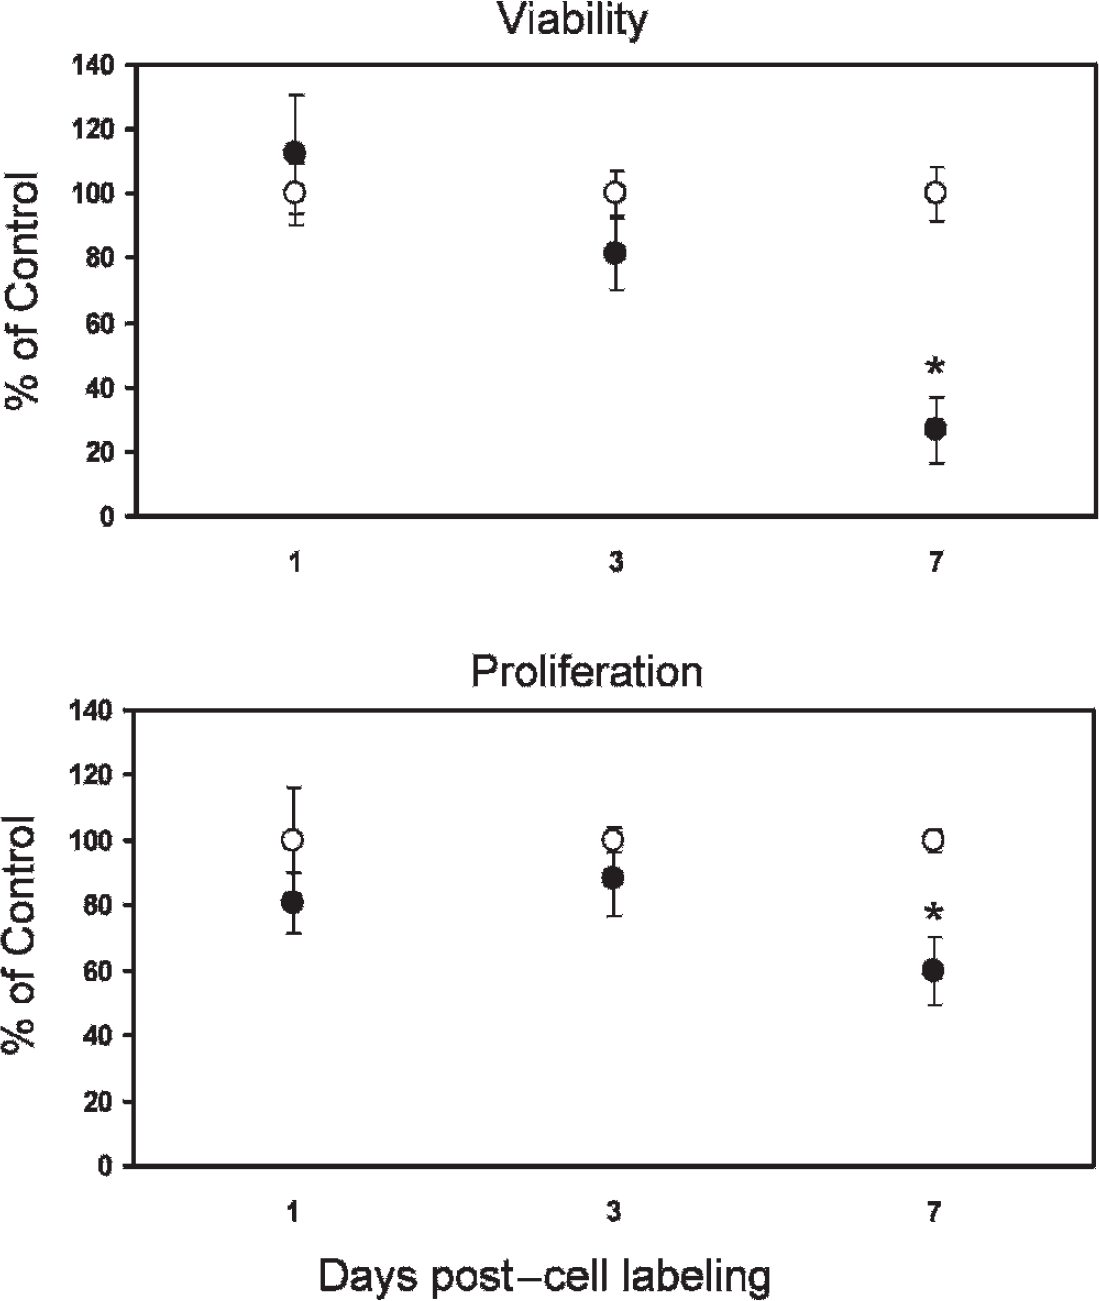
Viability and proliferative capacity in Gd2O3-labeled endothelial cells (filled circles) are unaffected relative to unlabeled controls (open circles) up to at least 3 days post–cell labeling. A significant decline is observed on day 7 (*p < .05). Shown are results for [Gd] = 0.02 mM.
Intracellular Gd Content
The mean cellular uptake of Gd2O3, expressed as pg Gd/cell, was assessed by ICP-AES and summarized in Table 2. The uptake of Gd2O3 into human aortic endothelial cells increased with increasing [Gd] in the incubation medium. No saturation effect was detected, and the amount of Gd2O3 taken up was linearly proportional to its concentration in the incubation medium (r = .995, p < 1e–4). Approximately half of the Gd2O3 in solution was taken up by cells.
Cellular Uptake of Gd2O3 Measured on ICP-AES

Gd2O3 = gadolinium oxide; ICP-AES = inductively coupled plasma–atomic emission spectroscopy.
A linear correlation exists between [Gd] and cellular uptake (r = .995, p < 1e–4).
Discussion
Positive T1 contrast agents based on Gd provide an important advantage over negative T2 iron oxides that are traditionally used in cell labeling and cellular MRI applications: they generate a positive signal change to enhance detection of labeled cells, provide better anatomic delineation, and reduce confusion between iron-labeled cell signal voids and negative contrast artifacts. Gd-based agents in the conventional chelated form are suboptimal for cell labeling and positive contrast visualization because of their small size and high hydrophilicity, 30 which hinder spontaneous cell uptake and retention. Toward creating a positive T1 agent with high sensitivity, different Gd formulations have been devised to improve cell uptake and optimize relaxation effects. Of these, Gd2O3 nanoparticles have shown the most promise.14–20 Enhanced relaxivity for different Gd2O3 nanoparticles has been demonstrated at clinical field strengths, and their uptake efficiency has been investigated, albeit predominantly in phagocytic cell lines. However, it is unknown if Gd2O3 remains a suitable T1 agent at higher field strengths and if it can be ingested efficiently by less phagocytic cells. The goal of this study was to determine the potential of a readily available Gd2O3 nanoparticle for labeling endothelial cells and providing positive T1 contrast for high-field MRI at 7 T.
Gado CELLTrack, a commercially available 30 nm Gd2O3 colloid, was investigated for cell labeling and cellular MRI at 7 T. Structurally, it is analogous to iron oxide and is much larger than conventional Gd chelates; it is expected to be more readily taken up by cells and retained for longer periods. Our results at 7 T demonstrated the potential of Gd2O3 as a positive T1 contrast agent for high-field cellular MRI. The major findings were as follows: (1) Gd2O3-labeled cells showed positive T1 contrast at 7 T; (2) Gd2O3 uptake in endothelial cells was high, much higher than for most Gd compounds and comparable to Gd2O3 uptake reported in glioma cells; (3) uptake in cells was linear over the incubation concentration range studied (up to [Gd] = 1.0 mM); (4) optimal positive T1 contrast was achieved at incubation concentrations ([Gd] < 0.1 mM) much lower than typical levels used for Gd agents; (5) T1 and T2 relaxation times increased slightly with time after cell labeling, but positive contrast was maintained up to 7 days; and (6) there was no deleterious effect of Gd2O3 on cell viability or proliferation for at least 3 days post–cell labeling.
Comparison with other cell labeling studies based on Gd contrast agents underscores several distinct advantages and features of Gd2O3. First, Gd2O3 is shown for the first time to exert an appreciable T1 relaxation effect at 7 T. Very few Gd-based compounds, all non-Gd2O3 formulations,8,12 have demonstrated this capability. Second, T1 enhancement in labeled cells was optimal at low incubation concentrations (< 0.1 mM), which is a range similar to other Gd2O3 nanoparticles16,17 and is much lower than that (< 25 mM) of conventional Gd agents.12,13 Analysis of intracellular Gd content revealed that contrast uptake was linear with incubation concentration up to 1.0 mM, which is consistent with linearity of Gd2O3 uptake observed in another study in human monocytic leukemia cells. 16 More importantly, positive contrast was achieved at low incubation concentrations owing to efficient internalization of Gd2O3: approximately half of the Gd was taken up by cells. Over the incubation concentration range of 0.02 to 0.1 mM, the intracellular Gd content was 7.26 to 34.1 pg Gd/cell, which is comparable to another report where 12 pg Gd/cell was measured in glioma cells incubated in 3.8 mM of Gd2O3. 17 Our results and those of Faucher and colleagues 17 suggest that the internalization of Gd2O3 is comparable to that of iron oxides31,32 and is much more efficient relative to other Gd compounds, for which intracellular uptake is generally very low (0.119 pg/cell 11 and 0.3 pg/cell at 25 mM incubation concentration). 13 An estimate of the intracellular molar concentration may be obtained by assuming a mean cell volume of 1,200 μm3, which would yield 38.5 and 181 mM of Gd corresponding to 0.02 and 0.1 pg/cell, respectively. This efficient cell uptake of Gd2O3, even in endothelial cells that have limited phagocytic capacity, suggests an active mechanism and may be further attributed to the use of PLL, which transforms the surface of the nanoparticle to a positive charge and thereby assists its attraction to cells (plasma membranes have a negative surface charge).
In addition to a high cellular accumulation of Gd2O3, relaxivity plays an integral role in determining the degree of positive contrast that can be obtained. A range of relaxivities have been reported for Gd2O3 with varying particle diameters: from r1 = 8.8 to 9.9 s−1mM−1 and r2/r1 = 1.3 for 1 to 2.5 nm particles,18,19 to r1 = 3.6 s−1mM− and r2/r1 = 3.5 for 5 nm particles, 16 to r1 = 0.1 s−1mM−1 and r2/r1 = 81.6 for 30 nm particles. 20 Although these relaxivity measurements in aqueous solutions were performed at clinical field strengths and cannot be directly compared to our results at 7 T, the measured relaxivities of our nanoparticle (r1 = 4.7 s−1mM−1 and r2/r1 = 6.2) fall within the range reported in the literature. It is important to note that since T1 and T2 relaxation effects coexist (T1 effects predominate at low Gd concentrations, but competing T2 effects dominate at higher concentrations 33 ), optimal positive contrast is obtained at intermediate concentrations. In our study, labeled cells were best visualized when incubated with Gd2O3 at concentrations less than 0.1 mM, a threshold that is slightly lower than 0.6 mM for a different Gd2O3 nanoparticle at 1.5 T.14,16 These numbers are consistent with a lower concentration requirement for maximal signal contrast from Gd2O3 nanoparticles compared to Gd-DTPA. 14
Further considerations for a suitable cell labeling contrast agent include its retention in cells and its effects on cell function. We found that Gd2O3 induced positive contrast changes that were retained for at least 7 days following cell labeling. Relaxation times T1 and T2 slowly increased with time but remained well within the range expected for signal dilutions owing to cell proliferation. For human aortic endothelial cells, we measured the doubling time to be approximately 42 hours, which is significantly longer than other cell types studied with Gd2O3. Therefore, by days 3 and 7, we would expect one and two doublings, respectively, which would account for the slight increase in T1 and T2. Few reports exist for comparison on T1 and T2 stability, none of which is based on Gd2O3. The one study that showed retention of contrast changes was performed on Gadofluorine M, 13 which noted that 1/T1 decreased 3 days post–cell labeling but then remained relatively stable up to day 7. The stability of Gd2O3 contrast compared to Gd chelates soon after cell labeling suggests enhanced retention in cells that is most likely due to the larger size of Gd2O3. Analysis of cell function showed that Gd2O3 does not alter viability and proliferation at the concentrations tested. However, a significant decrease in both viability and proliferation was observed on day 7. The reason is unclear, and assessment of cell function in the days following Gd2O3 labeling is not available from other literature investigations for comparison.
Future work will involve more comprehensive studies into the mechanisms of action and applications of Gd2O3. Stem cells and other phenotypes that are useful in cell tracking applications will be investigated. For different cell types, we need to gain insight into how Gd2O3 affects cell metabolism and function and characterize details related to its action (eg, optimal incubation time, cell uptake mechanism, intracellular distribution, and retention period). For example, although a 24-hour incubation period was used in this study to ensure contrast uptake in endothelial cells, shorter intervals of 4 or 8 hours may also suffice. Several observations from this study also deserve further investigation. One observation is a larger r2/r1 compared to other studies, which translates to reaching the maximum positive contrast at a lower Gd concentration. This may be related to different field strengths, and this hypothesis will need to be validated at lower fields. Another observation is a hyperintense signal in the supernatant above the cell pellets. Given that cells were washed immediately prior to MRI and the fresh medium added was free of Gd2O3, there may have been slow lysis of cells as a result of dense cell packing in a pellet formation, which would disperse some contrast into the overlying supernatant. Finally, beyond these in vitro characterizations, the in vivo efficacy of Gd2O3 for cell labeling and tracking at 7 T will need to be demonstrated in animal studies.
Conclusion
This study demonstrates that Gd2O3 nanoparticles are a promising contrast agent for cell labeling and positive T1 contrast cellular MRI at 7 T. Significant signal enhancement was demonstrated in endothelial cells labeled with Gd2O3 owing to efficient cell uptake of contrast agent at low incubation concentrations. The advantages of the Gd2O3 used in this study include its availability, ease of labeling without complicated assisted internalization into cells, optimal contrast agent uptake at low concentrations, positive contrast at high field strengths, and stable labeling for at least 7 days. These results suggest that Gd2O3 is suitable for time-course cell tracking studies and may overcome limitations associated with traditional Gd compounds or iron oxides.
Footnotes
Acknowledgment
Financial disclosure of authors: This work was supported by a grant from the Canadian Institutes of Health Research.
Financial disclosure of reviewers: None reported.