
Abstract
We investigated the potential of antibody-vectorialized superparamagnetic iron oxide (SPIO) particles as cellular specific magnetic resonance contrast agents to image lymphocyte populations within the central nervous system (CNS), with the final goal of obtaining a reliable tool for noninvasively detecting and tracking specific cellular populations in vivo. We used superparamagnetic particles bound to a monoclonal antibody. The particle is the contrast agent, by means of its T2* relaxation properties; the antibody is the targeting vector, responsible for homing the particle to target a surface antigen. To investigate the efficiency of particle vectorialization by these antibodies, we compared two types of antibody-vectorialized CD3-specific particles in vivo. We successfully employed vectorialized SPIO particles to image B220+ cells in a murine model of B-cell lymphoma. Likewise, we were able to identify CD3+ infiltrates in a murine model of multiple sclerosis. The specificity of the technique was confirmed by immunohistochemistry and electron microscopy of corresponding sections. Our findings suggest that indirect binding of the antibody to a streptavidinated particle allows for enhanced particle vectorialization compared to covalent binding of the antibody to the particle.
MAGNETIC RESONANCE IMAGING (MRI) is an important tool in both clinical activity and preclinical research for in vivo, noninvasive direct imaging of central nervous system (CNS) structures with high contrast and great spatial resolution. In recent years, new MRI-based contrast media have been developed to distinguish biologic events at the cellular level. 1
To study the dynamics of adaptive immune response in vivo, growing efforts have been undertaken to develop cell-specific contrast agents 2 that would allow the monitoring of lymphocyte localization through noninvasive imaging techniques such as MRI. Currently, this information can be obtained only by tissue pathology after sacrificing the animals or invasively using multiphoton microscopy. Therefore, to date, it is not possible to noninvasively study the immune cell dynamics in a single animal.
The development of MRI-negative contrast agents such as ultrasmall superparamagnetic iron oxide (USPIO) or superparamagnetic iron oxide (SPIO) particles has enhanced MRI sensitivity up to the detection of a few cells.3,4 Clinical employment of these contrast media in CNS imaging has been attempted by exploiting the natural tendency of these magnetic particles to be phagocytized by macrophages. This allowed, for example, the highlighting of macrophage accumulation within multiple sclerosis lesions.5–7
Similarly, other groups tried to load these particles into lymphocytes that were later grafted into siblings to induce experimental autoimmune encephalomyelitis (EAE) via adoptive transfer. This technique allowed the researchers to follow the position of lymphocytes in the CNS as the disease progressed. 8 However, this approach requires ex vivo labeling of the lymphocytes as the particles themselves have no lymphocyte targeting properties.
The imaging properties of superparamagnetic particles are very much dependent on the characteristics of the particles themselves. 9 Many factors may influence the sensitivity of these particles for cellular imaging purposes: for example, the particle's size, charge, and concentration have a dramatic impact on the specificity and sensitivity of the technique.
The idea of using conjugating particles to cell-specific antibodies was initially developed as a tool to target tumor-specific antigens outside 10 or inside 11 the CNS. In our work, we decided to further inquire about the viability of antibody-conjugated superparamagentic particles as an imaging tool for lymphocytes infiltrating the CNS. We first identified the particles best suited for our goals through in vitro experiments. Then we tested their efficiency in the imaging of T- and B-cell lymphocytes within mice brains. Lastly, we developed a system to compare the efficiency of those particles quantitatively, to establish which ones perform best in terms of sensitivity and specificity. This matching system is based on the mathematical analysis of the comparison between MRIs and the histology of the whole brain. This represents a novel approach to the study of antibody-vectorialized SPIO particles as cell-specific contrast agents.
Materials and Methods
Superparamagnetic Particles
Eight different particles were employed for our experiments: 50 nm propylene matrix streptavidin-coated SPIO (Miltenyi, Bergish Gladbach, Germany), 50 nm propylene matrix anti-mCD4-coated SPIO (Miltenyi), 50 nm dextran matrix anti-mCD3-coated SPIO with a coating density of 1:1 and a ferrite content of 35% (Micromod, Rostock, Germany), 150 nm streptavidin-coated SPIO (R&D Systems, Minneapolis, MN), 250 nm dextran matrix anti-mCD3-coated SPIO with a coating density of 1:400 and a ferrite content of 80% (Micromod), 250 nm dextran matrix anti-mB220-coated SPIO with a coating density of 1:400 and a ferrite content of 80% (Micromod), 300 nm propylene matrix streptavidin-coated SPIO with a coating density of 1:4,000 and a ferrite content of 54.5% (Merck Estapor, Fontenay sous Bois, France), and 350 nm propylene matrix anti-mCD3-coated SPIO with a ferrite content of 27.5% (Bangs Laboratories, Fishers, IN).
Magnetic Separation of Labeled Cells Using Antibody-Conjugated Superparmagnetic Particles
Ten million unfractionated splenocytes were resuspended in a volume of 1 mL phosphate-buffered saline (PBS) containing the desired quantity of antibody-conjugated superparamagnetic particles. Cells were incubated with the particles at 4°C for 20 minutes. Cells were then separated using a MagCellet magnet (R&D Systems) for 10 minutes. Supernatant was harvested (negative fraction, unbound cells). To make sure that all the unbound cells were retrieved, a mild resuspension was applied before pipetting the surpernatant off. Lastly, the smear that formed on the test tube toward the magnet was resuspended in 1 mL PBS (positive fraction, bound cells). The number of cells in each fraction was then counted, and the percentage of cells bound to particles was calculated.
Magnetic Separation of Labeled Cells Using Streptavidinated Superparamagnetic Particles Combined with Biotinylated Antibodies
First, streptavidinated particles were incubated with an excess of biotinylated antibody for 1 hour at room temperature on a rotating wheel. After incubation, the excess antibody was washed off by placing the antibody-combined particles in a MagCellet magnet for 5 minutes, and two 2 mL PBS washes were applied. Ten million unfractionated splenocytes were resuspended in a volume of 1 mL MACS buffer (Miltenyi) (PBS 1 ×, pH 7.2, 2 mM ethylenediaminetetraacetic acid [EDTA], and 0.5% bovine serum albumin) containing the desired quantity of antibody-combined superparamagnetic particles. Cells were incubated with the particles at room temperature for 30 minutes on the rotating wheel. After that, cells were separated using a MagCellet magnet for 5 minutes. Supernatant was harvested (negative fraction, unbound cells). To make sure all the unbound cells were retrieved, a mild resuspension was applied before pipetting the supernatant off. Lastly, the smear that formed on the test tube toward the magnet was resuspended in 1 mL PBS (positive fraction, bound cells). The number of cells in each fraction was then counted, and the percentage of cells bound to particles was calculated.
MACS Separation
One hundred million cells were resuspended in the desired volume of antibody-conjugated particles plus MACS buffer (PBS 1×, pH 7.2, 2 mM EDTA, and 0.5% bovine serum albumin), for a final volume of 500 µL, and incubated at 4°C for 20 minutes. Meanwhile, a Miltenyi LS Separation Column was placed in the separator magnet and equilibrated with 500 µL of MACS buffer. Cell suspension was applied to the LS column, and three 3 mL MACS buffer washes were applied to the column. All effluent was collected as unlabeled cells. The LS column was then removed from the separator and 5 mL MACS buffer was pipetted into the column; then the plunger was immediately and firmly applied to the column to flush out the fraction with the magnetically labeled cells. The number of cells in each fraction was then counted, and the percentage of cells bound to particles was calculated.
Agar Phantom Preparation
Forty-eight multiwell cell culture clusters (Corning Incorporated, Milano, Italy) were sawed into stripes of about one-well thickness to fit into the magnetic resonance device. Five hundred microliters of low melting agarose (Sigma-Aldrich, Milano, Italy) 1% in PBS was added in each well to form a base for the phantom once solidified. Five microliters of particle-labeled cells was resuspended in an equal volume of 2% low melting agar in PBS to form a 10 µL drop that was laid over the agar base already present in the well. After that, 500 µL of 1% low melting agar in PBS was added to each well to complete the phantom.
In Vitro MRI of Agar Phantoms
In vitro MRI studies were performed using a 3 T human magnetic resonance scanner (Intera 3T, Philips Medical Systems, Andover, MA) equipped with 80 mT/m gradients. A compatible mouse-dedicated commercially available volume coil of 40 mm diameter (Philips Medical Systems) was used. Turbo spin echo (TSE) T2 (time of repetition [TR] 3,595 ms, time of echo [TE] 96 ms, thickness 0.75 mm, field of view [FOV] 50 mm), TSE T1 (TR 600 ms, TE 23 ms, thickness 0.75 mm, FOV 50 mm), and fast field echo (FFE) T2* (TR 326 ms, TE 9.21 ms, fractional anisotropy 32°, thickness 0.8 mm, FOV 55 mm) sequences of agarose phantoms were acquired.
SJL Mice Immunization
Eight- to 10-week-old female mice (Charles River, Wilmington, MA) were injected subcutaneously over the shoulder with 100 µL of PLP139-151 (2 mg/mL) emulsified in an equal volume of complete Freund's adjuvant (prepared by adding 4 mg/mL of Mycobacterium tuberculosis to incomplete Freund's adjuvant). At day 7, immunization boost was performed by delivering another identical subcutaneous injection of emulsion on the second shoulder. Mice were also injected intraperitoneally with 100 µL of a pertussis toxin solution (500 ng/100 µL; List Biological Laboratories, Campbell, CA) at days 0, 1, 7, and 8.
After encephalitogenic challenge, the mice were observed daily, and clinical manifestations of EAE were scored on a scale of 0 to 5. Two weeks after EAE induction, mice with clinical scores between 2.5 and 3 were used for the experiments involving the use of SPIO (n = 6).
B-Cell Lymphoma Induction
One hundred thousand B220 lymphocytes (B-cell lymphoma) were stereotactically injected in the cerebral parenchyma of six inbred BALB/c mice. The cells were allowed to grow inside the mice brains for 25 to 28 days. Six to 10 hours before undergoing MRI, mice were injected with 250 nm SPIO conjugated to anti-B220 antibody or isotype control antibody.
In Vivo MRI
In vivo studies were performed on the same MRI apparatus and with the same radiofrequency coil used for the in vitro studies. During the entire acquisition time, mice were positioned prone on a home-made Mouse Pod. At 13 to 15 days after the beginning of EAE induction, mice underwent MRI examination under general gas anesthesia (5% sevoflurane [Sevorane; Abbott Laboratories, Abbott Park, IL] for anesthesia induction followed by 1 to 2% sevoflurane for anesthesia maintenance, both in a mixture of 95 to 99% O2). The following sequences were acquired in EAE mice before conjugated antibody injection: (a) axial three-dimensional TSE T2 (TR 2,200 ms, TE 80 ms, voxel size 0.075 × 0.075 × 0.09 mm, turbo factor 4); (b) coronal FFE T2* (TR 736 ms, TE 9.2 ms, flip angle (FA) 32, voxel size 0.1 × 0.1 × 0.8 mm); (c) axial three-dimensional TSE T1 (TR 500 ms, TE 19 ms, FFE 90, voxel size 0.08 × 0.08 × 0.09 mm, turbo factor 7) before and 10 minutes after intravenous administration of 0.6 mL/kg gadolinium (gadobenate dimeglumine, Multihance, Bracco, Italy). All three-dimensional axial images were also reformatted on coronal and sagittal planes. Eight hours after conjugated antibody injection, the axial three-dimensional TSE T2 and the coronal two-dimensional T2* were repeated and the following sequence was acquired: axial three-dimensional T2* (TR 350 ms, TE 9.2 ms, FA 25, voxel size 0.1 × 0.1 × 0.3 mm). At the end of the scan, mice were immediately perfused. In mice transplanted with B-cell lymphoma cells, the following sequences were acquired before and after conjugated antibody injection: (a) coronal two-dimensional TSE T2 (TR 2,200 ms, TE 80 ms, voxel size 0.20 × 0.30 × 0.8 mm, turbo factor 4, scan duration 6 minutes, 7 seconds); (b) coronal FFE T2* (TR 647 ms, TE 14 ms, FA 34, voxel size 0.20 × 0.24 × 0.5 mm, scan duration 30 minutes, 5 seconds).
The amount of particles injected was 1 mg for 250 nm covalently conjugated superparamagnetic particles (Micromod) and 0.25 mg for 300 nm streptavidinated superparamagnetic particles (Merck Estapor).
Anti-CD3 Immunohistochemistry on Frozen Slides
Tissues were then placed in special plastic chambers filled with OCT inclusion medium (Bio-Optica, Peschiera Borromeo, Italy) and frozen using isopenthanol and liquid nitrogen. Slides were obtained by cryostate (Leica Microsystems, Milano, Italy) 10 µm thick slicing of the frozen samples.
Slides were thawed for 30 minutes and then stained by immunohistochemistry (IHC). Slides were washed in PBS 13, and then immersed in 0.5% H2O2 (Aldrich, Milano, Italy) in PBS solution to block endogenous peroxidase. After two PBS 1× washes, antigen retrieval was done by 5-minute incubation via microwave in citrate buffer solution, pH 6. Slides were then left to cool down for 20 minutes, again washed in PBS 1× for 5 minutes, and incubated for 1 hour with PBS + fetal calf serum (FCS) 10% to block aspecific binding. After that, slides were incubated overnight with the primary antibody, rat antimouse CD3 (Serotec), diluted 1:200 in PBS + FCS 10%. The next day, three PBS 1× washes were performed, and then secondary antibody, biotinylated goat antirat (Amersham Biosciences), diluted 1:500 in PBS + FCS 10%, was applied for 1 hour. After three washes in PBS 1× a biotinylated peroxidase + avidin solution (Vectastain elite ABC kit) was applied. Two final washes in PBS were performed followed by the development of CD3+ positive cells using a DAB + Chromogen kit (DakoCytomation). Just before aspecific staining started to develop, chromogen reaction was blocked in water.
Cell nuclei were counterstained for 25 to 30 seconds with modified Harris hematoxylin (Sigma-Aldrich) and then washed for 10 minutes in a flux of tap water and dehydrated (ethanol 50%, 70%, 100%) to n-butyl acetate. Slides were then coverslipped with Eukitt medium (Bio Optica).
Data Analysis and Mouse Atlas Preparation
An expert neuroradiologist carried out qualitative visual and quantitative analysis of MRIs blinded. In parallel, an expert neuroimmunologist carried out qualitative visual and quantitative analysis of the histology slides blinded to the MRI results.
For each mouse, we prepared an atlas of the whole brain using pictures of the animal's magnetic resonance two-dimensional coronal slices. All 16 equidistant coronal sections were pasted sequentially. MRI hypointense spots and histology infiltrates were both recorded on this atlas by two different blinded operators.
Calculation of Sensitivity Values Based on Matching Data
Sensitivity was calculated as the number of true positives divided by the sum of true positives plus false negatives. The number of true positives is the number of MRI hypointense spots that correctly match with CD3+ infiltrates in the postmortem histology. The number of false negatives is the number of CD3+ infiltrates from histology that do not have a matching hypointense spot in the MRIs.
The number of spots “matching” between MRI and histology slides depends on the distance value that we assume as threshold to define matches from mismatches. To identify what distance threshold should distinguish a match from a mismatch, we developed a graph that showed how sensitivity curves behave when a different value for distance threshold is considered. The data required to compile this graph were obtained by measuring the distance between each histology spot and the closest magnetic resonance hypointense spot. A matrix was built to count how many spots fell within discrete distance intervals of 10 µm using Microsoft Excel. From this matrix, we could draw a graph showing how many histology spots are matching with magnetic resonance hypointense spots given that a certain distance approximation threshold is assumed.
Results
In this work, we evaluated the use of antibody-vectorialized SPIO particles as a magnetic resonance contrast agent to image lymphocytes within the CNS in vivo and propose a system to characterize the in vivo efficiency of these labeling techniques.
In Vitro Assessment of Sensitivity and Specificity of Different Types of Antibody-Vectorialized SPIO Particles
To choose which antibody-conjugated superparamagnetic particles were best suited to our study, we investigated which SPIO particle showed the best sensitivity, high enough to image an amount of cells similar to that which can usually be found in the average CNS inflammatory infiltrates. By performing limiting dilutions, we determined the minimum amount of particles that we could image in vitro using agar phantom simulations such as the ones shown in Figure 1. Our results are summarized in Table 1 and suggest that particle size plays the most important role in determining the imaging power of the particle. Infiltrate density in a 10 µL volume in vivo is expected to contain on the order of 102 infiltrating T-cell lymphocytes. As such, the particles that are suited for our uses are those that allow detection of as low as 100 labeled cells. Our tests show that the smallest particles, measuring 150 or 50 nm in diameter, are not able to image cells in the 102 range in T2 sequences using our human 3 T machine adapted to mice, so we focused on larger particles for our analysis.
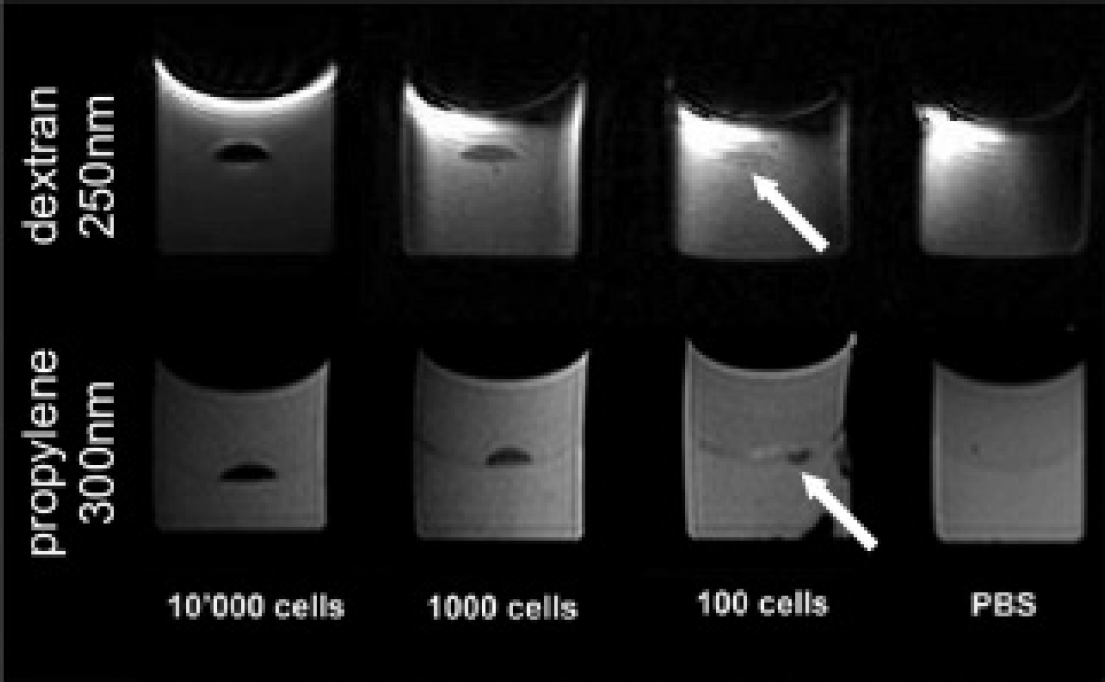
Minimum concentration of SPIO-labeled cells detectable by MRI. T cells were labeled with 250 nm anti-CD3-conjugated SPIO (dextran matrix) or 300 nm streptavidinated SPIO (propylene matrix) plus biotinylated anti-CD3 antibody. Then different dilutions of the labeled cells were dropped between two layers of low melting agar to generate an agar phantom. MRIs successfully detect a signal loss in wells containing as low as 100 cells in 10 µL for both particles. Arrows indicate the small, but detectable, hypointense signal in the wells containing only 100 labelled cells.
Features and In Vitro Sensitivity of Antibody-Vectorialized Superparamagnetic Iron Oxide Particles

ND = not declared by supplier; SPIO = superparamagnetic iron oxide.
MRI Detects Lymphocytes in the Brain of B-Cell Lymphoma or EAE-Affected Mice Injected with Antibody-Vectorialized SPIO Particles
We evaluated the possibility of employing antibody-vectorialized SPIO particles in vivo using both a brain lymphoma model and an autoimmune demyelinating disease model. Our aim was to show the viability of this contrast agent in vivo as a proof of principle.
B-cell lymphoma was induced by stereotactically injecting BALB/c mice in the frontal lobes with 105 cells from the A20 B-cell lymphoma genetically modified to express green fluorescent protein and CXCL13 (the kind gift of Paolo Ghia). When tumor-bearing mice were injected with anti-B220-conjugated 250 nm Micromod particles, large hypointense regions could be detected by T2* MRI. The hypointense regions matched with the tumor distribution when the tumor grew intracranially (Figure 2, A and C), as well as when the tumor grew both intra- and extracranially (Figure 2, B and D). Using the same particles, no hypointense areas were detected in mice affected by a non–B-cell tumor such as glioma (Figure 2E). Finally, mice bearing the CNS B-cell lymphoma injected with isotype control antibody–conjugated 250 nm Micromod particles (Figure 2F) also did not display tumor-specific hypointensities. These results suggest that in the case of masses constituted by large numbers of homogeneous cells such as in experimental tumor models, antibody-vectorialized particles are able to provide a cell-specific contrast agent.
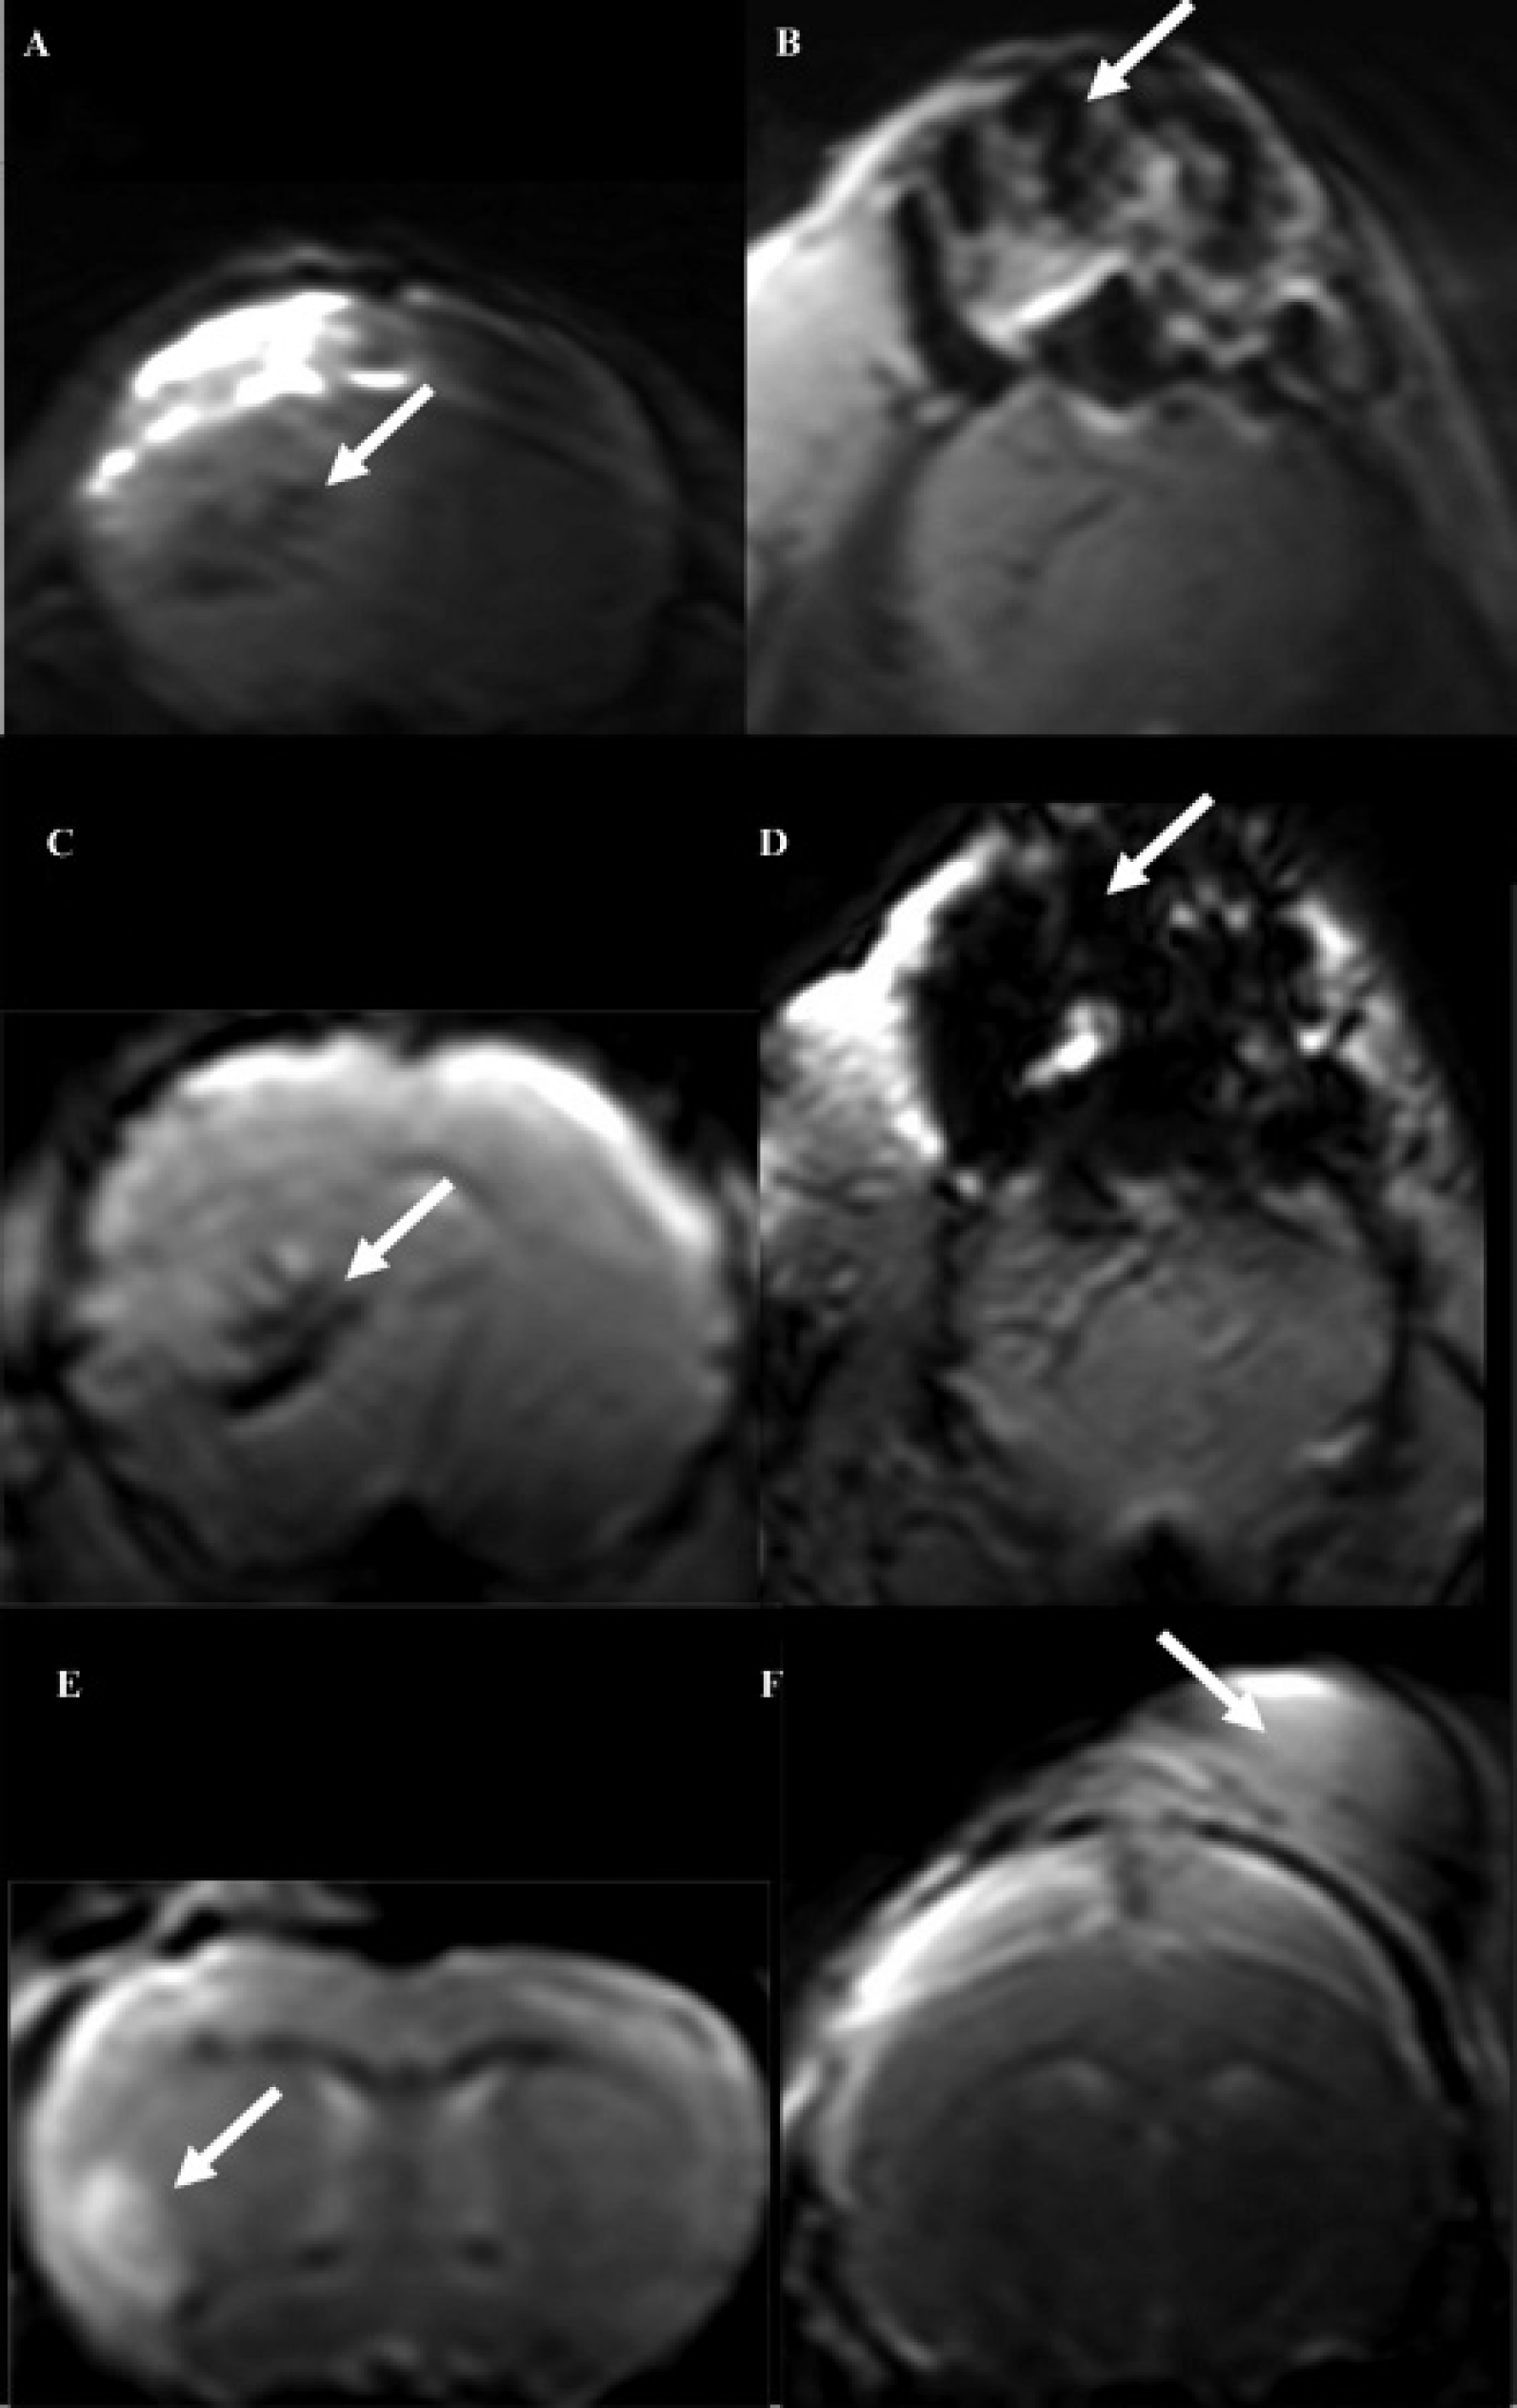
B-cell lymphoma in vivo imaging using SPIO covalently conjugated to antibodies. B-cell lymphoma–affected mice injected with 250 nm SPIO conjugated to monoclonal anti-B220 antibody (dextran matrix) show large hypointense regions identified in T2* MRI. Anatomic TSE T2 sequences are shown in A and B. In comparison, hypointense areas identified in T2* scans colocalized with the tumor whether the tumor grew intracranially (C) or extracranially (D). No hypointense areas are detected in T2* scans of mice affected by glioma after injection with 250 nm SPIO conjugated to anti-B220 antibody (E) or a B-cell lymphoma–affected mouse injected with 250 nm SPIO conjugated with isotype control antibody (F). In all panels, tumors are indicated by arrows.
We next investigated if this approach was able to highlight accumulation of as few as 100 cells, as in brain inflammatory infiltrates. We thus tried to image T-cell lymphocytes in vivo in EAE-affected mice. EAE is the murine model of multiple sclerosis and is characterized by the massive presence of encephalitogenic T-cell lymphocyte in the CNS of affected mice. This feature makes EAE a suitable model for in vivo imaging of lymphocytes infiltrating the brain. EAE-affected mice injected with 250 nm superparamagnetic particles (dextran matrix) conjugated to monoclonal anti-CD3 antibody showed several low signal areas throughout the brain in T2* MRIs (Figure 3A). The position of the hypointense spots correlated well with the infiltrates' location identified in anti-CD3 IHC (Figure 3, C–E). Electron microscopic analysis of the pathology slides identified small dark dots around some of the cells, indicating binding of the particles to lymphocytes in the CNS lesions in vivo (Figure 3F). Furthermore, mice injected with the same SPIO particles conjugated to control antibody displayed a lower number of hypointense spots in the MRIs (Figure 3B).
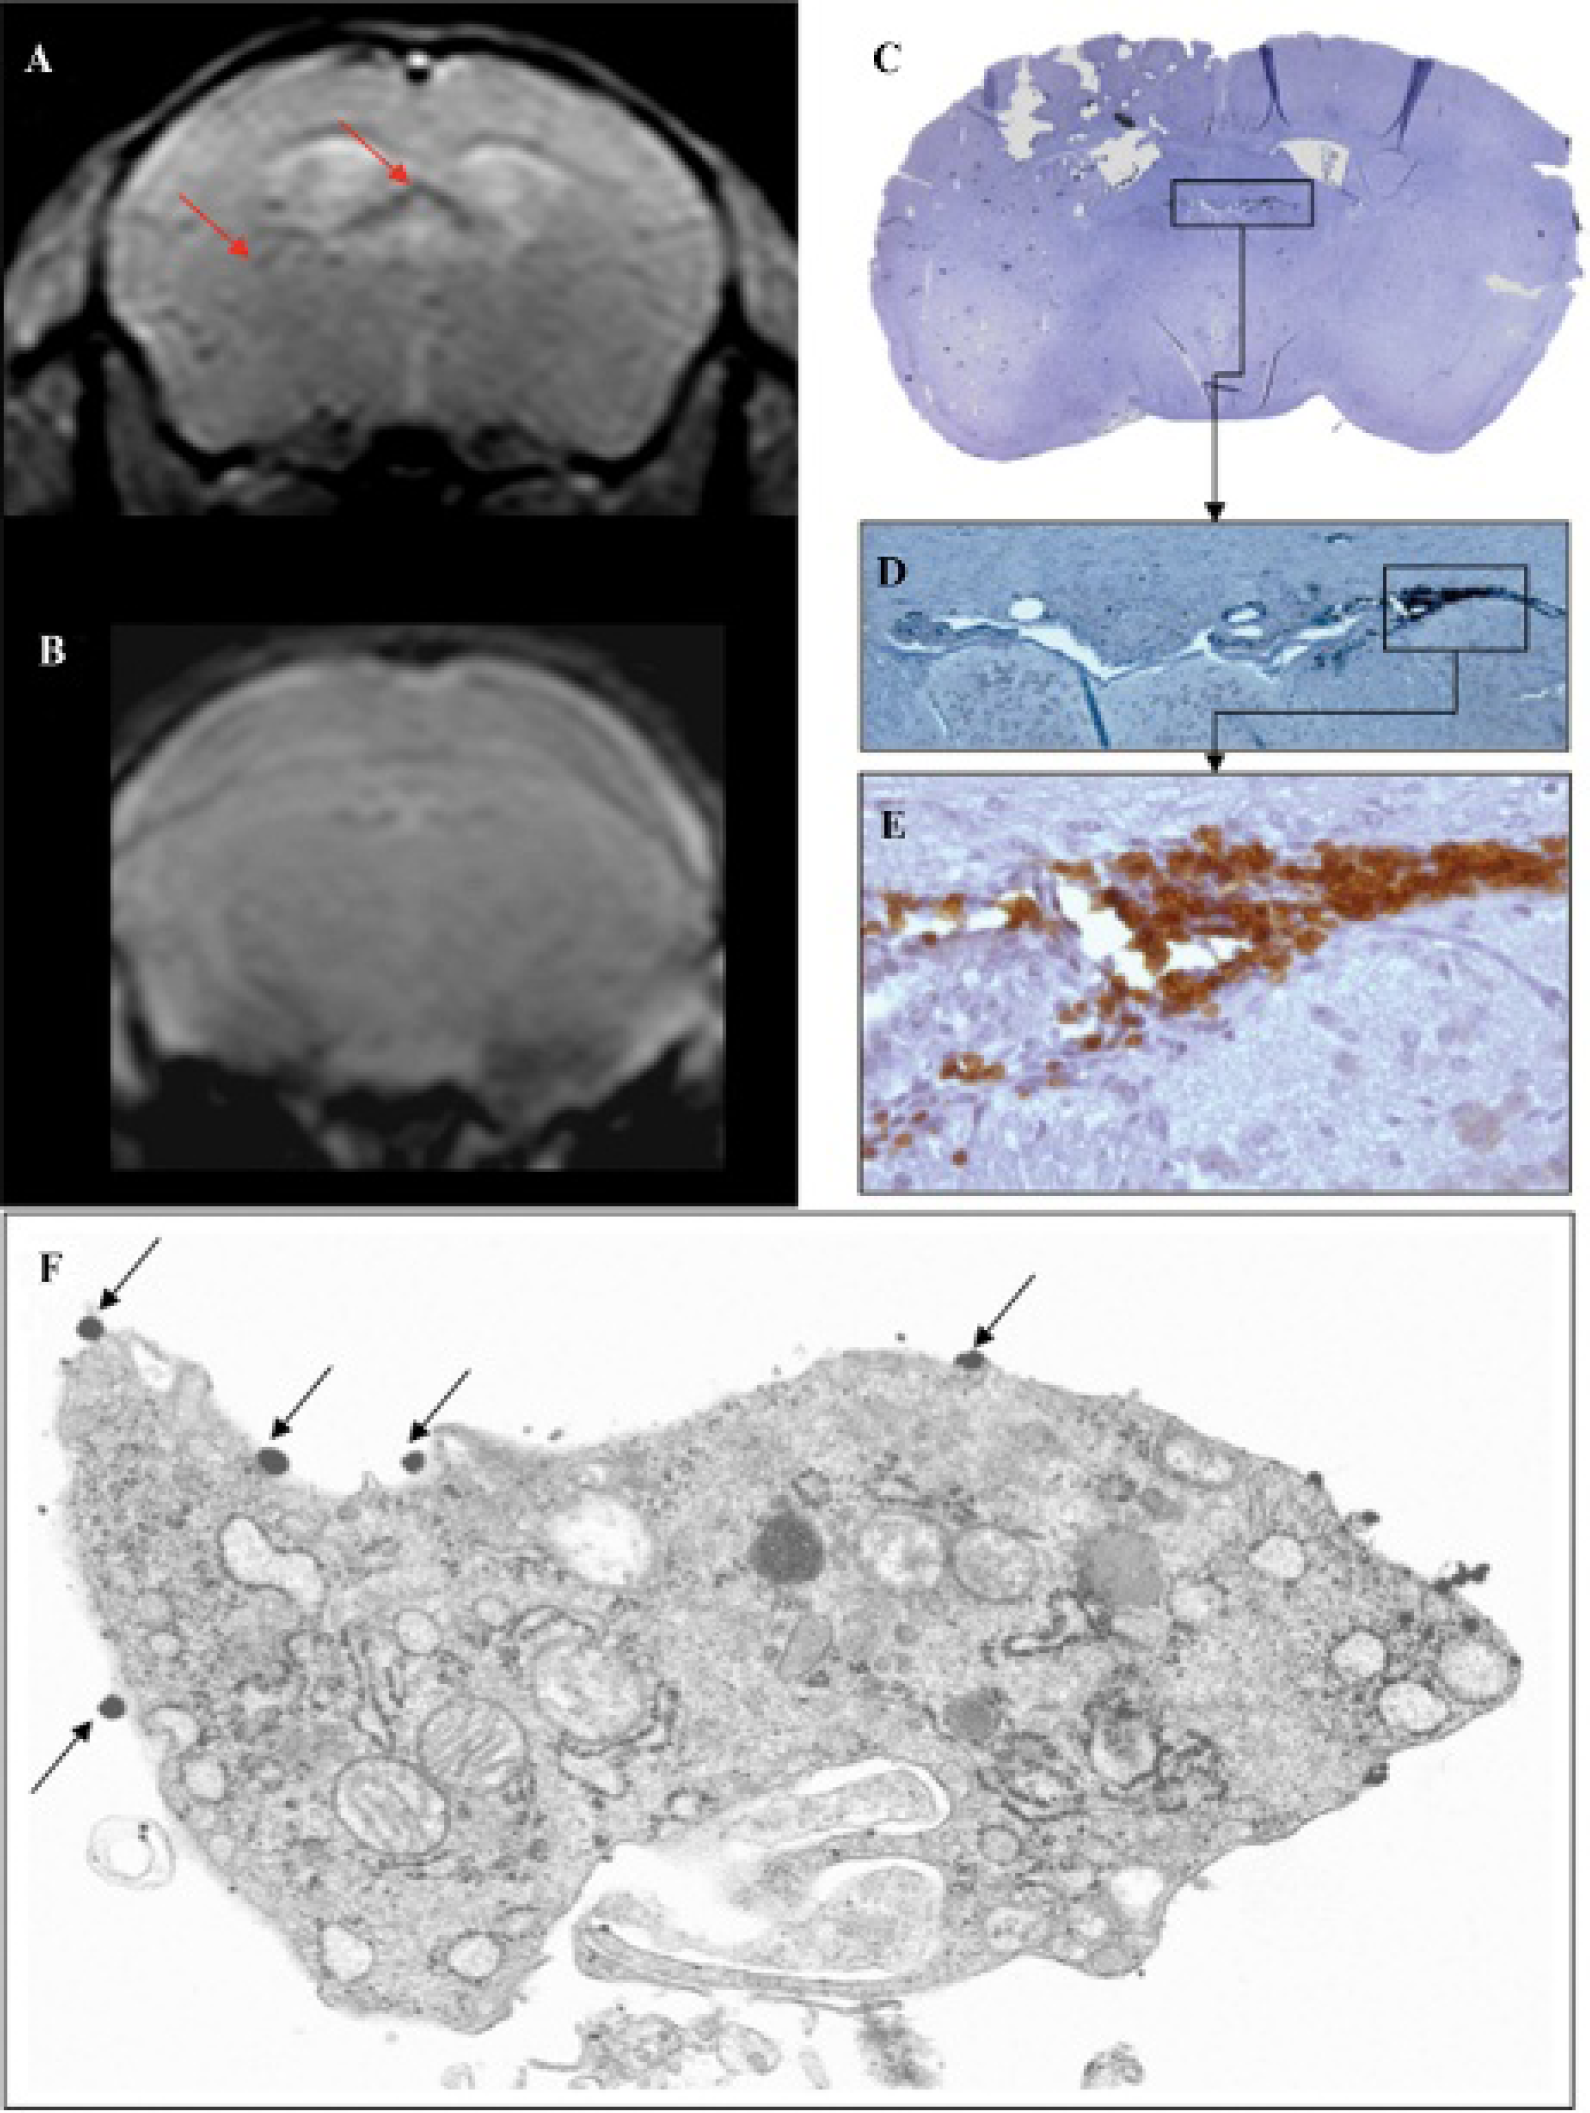
T-cell lymphocytes in vivo imaging in experimental autoimmune encephalomyelitis (EAE)-affected mice using SPIO covalently conjugated to antibodies. EAE-affected mice injected with 250 nm anti-CD3 antibody conjugated particles to monoclonal anti-CD3 antibody (dextran matrix) show several low signal areas (red arrows) throughout the brain in T2* MRIs (A). Fewer hypointense spots are detected in the brain MRIs of mice injected with isotype control conjugated particles (B). The position of magnetic resonance hypointense spots can be correlated with the location of lymphocyte infiltrates indentified through anti-CD3 immunostaining of fixated tissue (C, D, E; 4×, 10×, 40× original magnification, respectively). Electron microscopic analysis of brain slices from mice injected with anti-CD3-conjugated SPIO particles: superparamagnetic particles can be identified as small dark dots (black arrows) around the surface of the lymphocyte.
The same experiment was performed with another type of particle: the 300 nm streptavidinated particles (propylene matrix). Particles were incubated with either biotinylated anti-CD3 antibody or biotinylated irrelevant antibody. Diffused magnetic resonance hypointense spots could be detected in both mice (red arrows), with a higher density of hypointense spots being recorded from the anti-CD3 particle–injected mouse (Figure 4, A and B). A correlation between magnetic resonance hypointense signals and the real presence of infiltrates was then confirmed by anti-CD3 IHC (Figure 4, B and C). Our conclusion is that EAE-disseminated lesions can be imaged by employing antibody-vectorialized SPIO particles.

T-cell lymphocyte in vivo imaging in experimental autoimmune encephalomyelitis (EAE)-affected mice using streptavidinated SPIO plus biotinylated antibodies. Low-intensity spots (red arrows) detected in T2* MRIs of EAE-affected mice injected with 300 nm streptavidinated particles (propylene matrix) combined with biotinylated anti-CD3 antibody (A) and in mice injected with the same streptavidinated particles combined with an isotype control antibody (B). Correlation between the position of magnetic resonance hypointense spots and the histology of T lymphocyte infiltrates identified in anti-CD3 immunohistochemistry (C).
Assessment of the In Vivo Sensitivity and Specificity of Antibody-Vectorialized SPIO Particles
We compared the efficiency of the two particles that we tested in vivo. To assess the sensitivity and specificity of different particles, we developed a matching system to compare magnetic resonance information and histology information. The matching system was designed with the goal of generating numerical values of sensitivity as output while being as reproducible as possible.
The matching system consists of reporting the location of detected histology infiltrates and detected magnetic resonance hypointense spots blinded on the same mouse brain atlas (Figure 5A). After that, the distance between each single infiltrate spot and its nearest magnetic resonance hypointense spot was recorded. These data were used to generate a graph quantifying the sensitivity of the technique in relation to the approximation used to distinguish matches from mismatches.

Comparison between the sensitivity and specificity of the antibody vectorialized SPIO particles used in vivo. Magnetic resonance to histology matching system: locations of detected magnetic resonance hypointense spots (red) and histology infiltrates (green) are recorded on the same anatomic atlas (A). All distances between infiltrate spots and their closest magnetic resonance hypointense spots are recorded. To discriminate matches (true positives) from mismatches (false negatives), we decided to assume a certain distance threshold (DT) and considered all infiltrates within the DT of the magnetic resonance spots to be matches. As such, we can draw a graph describing the percentage of true positives (sensitivity) against the DT we assume. This analysis was applied to the 250 nm anti-CD3 antibody covalently conjugated particles (dextran matrix) (B) and the 300 nm streptavidinated particles (propylene matrix) (C). Blue lines represent animals injected with anti-CD3-conjugated particles; red lines represent animals injected with isotype control–conjugated particles. The difference in the sensitivity curve is statistically significant only for the 300 nm streptavidinated particles, suggesting that the antibody was successful in vectorializing this type of particle but not the 250 nm covalently conjugated ones.
It is not possible to directly evaluate specificity because our model does not allow us to measure true negatives. However, the efficiency of the conjugated antibodies in specifically vectorializing our particles can be assessed by comparing the graphs generated by the data obtained from mice injected with control particles to the data generated from mice injected with anti-CD3-conjugated particles.
Of the anti-CD3-conjugated particles, both the streptavidinated propylene matrix one and the covalently conjugated dextran matrix one showed similar sensitivity against distance threshold curves. Sensitivity values look promising despite the approximations; for example, if we consider a threshold approximation of 1 mm, then both particles have a sensitivity of about 80%. This means that around 80% of the infiltrates recorded by postmortem histology are within 1 mm of the hypointense spots identified by T2* MRIs of the same mouse after injection of the vectorialized SPIOs.
However, when we compare the behavior of the isotype antibody control–conjugated particles, a difference emerges. Dextran matrix, covalently conjugated particles show the same curve behavior for anti-CD3 or control-conjugated particles. On the contrary, a significant difference between the curves for the anti-CD3 and the control can be recognized in the propylene matrix, streptavidinated particles. This suggests that both particles are colocalizing to the lymphocyte infiltrates; however, only in the case of the propylene particles was this due to the vectorialization by the attached antibody rather than the particles being taken up by macrophages regardless of the antibody coating it.
These results show how our matching system is able to give a numerical assessment of the particle's sensitivity and allow us to estimate the particle's specificity relative to other particles tested. The system we employed is reproducible and has a mathematical basis that takes into account the approximations owing to the technical limitations of the matching method.
Discussion
Noninvasive CNS imaging is critical for patient management and for research in medicine. MRI is considered one of the most potent techniques for this type of task.
To gather more information through the MRI technique, a number of contrast agents have been developed. These contrast agents answer specific clinical needs and allow for the visualization of biologically relevant targets in MRI. One of the most widely used contrast agents for MRI clinical practice, gadolinium, allows the identification of regions where the blood-brain barrier is damaged and/or leaky. 12
Another widely used contrast agent is SPIO. SPIO generates a loss of signal in T2 and T2* sequences. SPIO is naturally taken up by the reticuloendothelium system, 13 thus acting as a negative contrast agent by reducing the T2/T2* signal generated by organs such as healthy liver and spleen. These uses of the contrast agents are, however, limited by the reliance on natural properties of the contrast agent, such as its biodistribution. 14 More recently, these contrast agents have been refined by developing molecular techniques to target the contrast-inducing agent to specific biologic targets of interest.
One of the common strategies to vectorialize these agents is to encapsulate them into a biodegradable polymer matrix sphere or bead and coat the surface of the bead with monoclonal antibodies specific to the biologic target of interest. Attempts at vectorializing gadolinium using antibodies have proven to be technically challenging because over 1,000 gadolinium atoms need to be attached to a single antibody. This caused a low degree of specificity in this technique.15,16
SPIO particles have also been studied as a cell-labeling contrast agent. Once injected in the bloodstream, SPIO particles are taken up mostly by professional phagocyte cells, such as macrophages. However, it is also possible to label cells that are not professional phagocytes by incubating them ex vivo with the SPIO. This allows for the use of SPIO as an in vivo tool to study the immune system, but owing to the low uptake of the particles by lymphocytes,13,17 this technique is mostly limited to macrophage imaging.
In this work, we investigated the use of SPIO as a lymphocyte-specific contrast agent by conjugating the particles to lymphocyte-specific antibodies. This topic is relevant owing to the current lack of an efficient technique to image lymphocytes in vivo18,19 and the limited literature available on this vectorialization approach so far, in particular regarding in vivo imaging of lymphocytes that are infiltrating the CNS. 20 We have used the antibody-vectorialized SPIO particles to image two different populations of lymphocytes within the CNS. We have been able to detect B-cell lymphoma masses as hypointense regions in T2* MRI of affected mice injected with anti-B220-conjugated particles (see Figure 2). The specificity of the imaging is supported by the absence of hypointense regions in the same mice injected with control antibody–conjugated particles or the glioma-affected mouse injected with the anti-220 particles. This is an encouraging result and a proof of principle for the use of SPIO particles as a B cell–specific contrast agent in the CNS in vivo, which could represent the basics for a technique that could be further developed into a tool for differential diagnosis of CNS ailments.
However, a few caveats must be mentioned. The lymphoma model that we have used is different from the form that commonly affects humans. In the model we used, the B cells tend to grow as a defined, uniform cluster, whereas normally occurring lymphoma tends to be more infiltrating and inhomogeneous and, as such, harder to distinguish using a negative contrast agent. Furthermore, the blood-brain barrier is usually disrupted around a tumor. We have not investigated how the properties of the blood-brain barrier change in our model and if the changes are comparable to those undergone in normal tumors. Blood-brain barrier disruption is a critical step to allow the particles to reach the site of the tumor and influences the efficiency of the imaging technique as a result.
We also tested the use of antibody-vectorialized SPIO particles as a cellular contrast agent for the imaging of T-cell lymphocytes infiltrating the CNS. For this study, we used a murine model of multiple sclerosis, EAE. This disease model is well characterized in the literature21–23 and generates a diffused immune cell infiltration of the CNS rather than the single cluster of cells of interest generated in the B–cell lymphoma model. This feature allows us to use the model to evaluate the efficiency of different particles at detecting T-cell lymphocyte infiltrates. Indeed, after injecting EAE-affected animals with antibody-vectorialized SPIO particles, several hypointense spots could be identified. A first comparison with postmortem anti-CD3 IHC also confirmed that the brains of these animals are infiltrated by T-cell lymphocytes (see Figure 3 and Figure 4), but only a methodical comparison of infiltrate distribution from the IHC with the hypointense spots recorded in magnetic resonance can give an assessment of the technique's sensitivity and specificity.
In performing this match, we were faced with a number of technical challenges. Magnetic resonance coronal sections and IHC coronal sections have different border shapes. To compare the two maps, one of them has to be manually replicated on the other (blinded). This generates a first approximation. Second, to have a perfect comparison, the magnetic resonance and IHC slides need to be parallel to each other. This is generally not the case because of a certain inclination on the coronal plane when slicing at the cryostate. This causes further approximation on the final map. To determine the sensitivity of the technique, we needed a system to distinguish true positives (IHC infiltrates correctly identified by the MRI) from false negatives (IHC infiltrates that failed to be identified by the MRI) while taking into account the influence of an unknown amount of approximation. To answer this question, we needed to decide which value of distance should be assumed to consider two spots (an IHC infiltrate spot and a magnetic resonance hypointense spot) close enough to match. In the absence of an experimental basis to assign a numerical value to this distance, we decided to solve the problem by generating a graph that describes the percentage of matches that can be obtained using any of the possible values that can be assumed for distance threshold. These graphs can be used as a tool to quantitatively compare the efficiency of different particles or the same particles in different conditions. A significant limitation to the technique remains the fact that MRI and IHC slides cannot be coregistered but have to be manually matched during the analysis. However, as long as the experimental conditions are the same in all experiments, then similar approximations will be affecting the various graphs, making a fair comparison possible.
Another important issue when using EAE as an imaging model to test T-cell lymphocyte–specific SPIO particles is the fact that macrophages also abound at the sites of lymphocyte infiltration. As previously mentioned, SPIO particles are naturally phagocytized by macrophages. 24 This means that the signal we are observing could depend on SPIO internalization by macrophages rather than antibody-mediated vectorialization to the lymphocytes. To assess whether the antibody specificity is generating any impact on the particle's homing to its intended cellular target, we can take the graphs we generated and use them to compare data from EAE-affected mice injected with either anti-CD3-vectorialized SPIO particles or isotype control antibody–conjugated SPIO particles (see Figure 5). As long as both mice used have a similar density of infiltrates in their brain, the comparison between the anti-CD3 and control curves can describe how effective the antibody has been at vectorializing the particle. This represents a novel tool to study the efficiency of SPIO particles as a cell-specific contrast agent.
By employing this matching system on two of the particles we tested in vivo, we detected a significant difference in the vectorialization of the two specific antibody-conjugated particles compared to their controls. Without the help of the graphs, this difference would have probably gone unnoticed because in both cases, a lower number of total magnetic resonance hypointense spots were detected in EAE-affected mice injected with the control particles (data not shown). The different vectorialization between the 250 nm dextran matrix and the 300 nm propylene matrix particles could be due to a number of reasons. In the 250 nm particles, the antibody is chemically conjugated to the particle; in the 300 nm particles, the bead is coated with streptavidin, which links the particle to biotinylated antibodies. This could give more steric freedom to the antibody, augmenting its possibility of correctly interacting with the antigen to bind to it. This also allows increased density of antibody to be coated on the surface. Another possibility is that the matrix material the particles are made of (dextran vs propylene) influences macrophage's affinity to the SPIO particle internalization. However, no data in the literature support such a dramatic difference in binding capacity, unless the dextran is positively charged. 25
Conclusion
We further characterized the use of SPIO as a cell-specific magnetic resonance contrast agent and suggested a system to quantify the particle's imaging efficiency. We have also tested different types of particles to determine the optimal solutions for our cellular contrast needs. Many aspects can still be improved to mitigate the amount of approximation generated in our matching system. This could be achieved, for example, by taking into account the third dimension during the matching process. All map comparisons happen on a two-dimensional plane (the atlas slices). Magnetic resonance slice thickness is about 0.6 mm, so the closest matching spot could be on the slice anterior or posterior to the one that is being analyzed. Calculating distances in three dimensions is doable: the distance becomes the hypotenuse of a right triangle, whose two legs are (1) the slice thickness (0.7 mm) and (2) the distance between the two spots. Once this technique is refined, it might be interesting to employ SPIO particles in the tracking of changes in lymphocyte concentration and distribution within the brain of EAE-affected animals throughout the various phases of the disease.
Our work suggests that further development of antibody-vectorialized SPIO holds promise as a way to increase diagnostic power and research opportunities of brain MRI.
Footnotes
Acknowledgment
Financial disclosure of authors: This work has been supported by the Institute of Experimental Neurology-INSpe.
Financial disclosure of the reviewers: None reported.