
Abstract
β-Glucuronidase (β-GUS) plays an important role in inflammation and degenerative processes. The enzyme has also been investigated as a target in prodrug therapy for cancer. To investigate the role of β-GUS in pathologies and to optimize β-GUS-based prodrug therapies, we recently developed a positron emission tomographic (PET) tracer, 1-O-(4-(2-fluoroethyl-carbamoyloxymethyl)-2-nitrophenyl)-O-β-D>-glucopyronuronate ([18F]FEAnGA), which proved to be selectively cleaved by β-GUS. Here we present the in vivo evaluation of [18F]FEAnGA for imaging of β-GUS in a tumor/inflammation model. Ex vivo biodistribution of [18F]FEAnGA was conducted in healthy rats. PET imaging and pharmacokinetic modeling were performed in Wistar rats bearing C6 tumors of different sizes and sterile inflammation. The biodistribution studies of [18F]FEAnGA indicated low uptake in major organs and rapid excretion through the renal pathway. MicroPET studies revealed three times higher uptake in the viable part of larger C6 gliomas than in smaller C6 gliomas. Uptake in inflamed muscle was significantly higher than in control muscle. The distribution volume of [18F]FEAnGA in the viable part of the tumor correlated well with the cleavage of the tracer to [18F]fluoroethylamine and the spacer 4-hydroxy-3-nitrobenzyl alcohol. [18F]FEAnGA is a PET tracer able to detect increased activity of β-GUS in large solid tumors and in inflamed tissues.
β-G LUCURONIDASE (β-GUS) (EC 3.2.1.31) is a lysosomal enzyme that catalyzes the hydrolysis of the β-glucuronic acid residue from the glycosaminoglycans. Therefore, β-GUS is an essential enzyme for the normal restructuring of the extracellular matrix. The enzyme is localized intracellularly in lysosomes and microsomes, and its activity is hardly detectable in human blood in normal conditions. 1 However, increased levels of extracellular β-GUS have been reported in various inflammatory pathologies, where it plays a role in the degenerative processes. 2 It is known that tumors also have high extracellular levels of β-GUS owing to secretion of the enzyme by invading monocytes and granulocytes and release from necrotic tumor cells. 3
The extracellular β-GUS in tumors has been exploited as a target for new anticancer therapies. Conventional cancer chemotherapy is associated with severe dose-limiting side effects, which often restrict the therapeutic efficacy of drugs. To increase the therapeutic index, the drug could be modified into a nontoxic prodrug (PD) that is converted in situ to the active drug by an enzyme that is selectively expressed at the target site. β-GUS has been investigated as an endogenous PD-converting enzyme.
Glucuronide prodrugs exhibit low toxicity owing to their hydrophilic nature, which prevents them from entering normal cells and thus from being activated by lysosomal β-GUS. However, in large tumors, the intracellular enzyme is released from necrotic tumor cells and macrophages, resulting in activation of glucuronide PDs by the extracellular β-GUS present at the tumor site.4–6 Encouraging in vivo results were obtained with PDs such as N-[4-doxorubicin-N-carbonyl (oxymethyl) phenyl] O-β-glucuronyl carbmate (DOX-GA3); N-[4-β-glucuronyl-3 nitrobenzyloxycarbonyl] doxorubicin (HMR 1826); and 9-aminocamptothecin (9ACG).7–9 These PDs were able to release the active drug (either doxorubicin or camptothecin) after enzymatic cleavage of the glucuronide moiety by extracellular β-GUS, inducing superior or equal tumor growth inhibition (70 to 80%) over the toxic parent drug (40–80%) in human tumor xenografts. These results suggest that bioactivation of glucuronide PDs by β-GUS is an attractive approach in PD therapy.
However, interindividual and intertissue variability of β-GUS activity, as well as factors modulating the enzyme's expression and activity, are key determinants for the success of these PD therapeutic strategies.10,11 Therefore, monitoring enzyme activity in larger animals and, ultimately, in humans using specific radiotracers combined with nuclear imaging techniques such as positron emission tomography (PET) would lead to a better understanding of the metabolic conversion of PDs and improvement in β-GUS-targeted therapy.12,13
Recently, Tzou and colleagues designed a PET tracer, [124I]-phenolphthalein glucuronide ([124I]-PTH-G), for β-GUS imaging. 14 This tracer selectively accumulated in a genetically modified β-GUS expressing tumor compared to a control tumor. Fluorine 18 has superior imaging properties over iodine 124; therefore, we designed an 18F-labeled PET tracer for β-GUS, 1-O-(4-(2-fluoroethyl-carbamoyloxymethyl)-2-nitrophenyl)-O-β-D-glucopyronuronate ([18F]FEAnGA). 15 This tracer has a structure similar to the HMR 1826 PD, with the doxorubicin moiety replaced by a [18F]fluoroalkylamine group (Figure 1). This tracer has proven to be selectively cleaved by β-GUS in vitro. A preliminary in vivo study in mice bearing genetically modified CT26mβGUS (overexpressing GUS) and CT26 tumors (control) suggests that extracellular β-GUS efficiently cleaves the tracer in vivo, resulting in higher radioactivity accumulation in tumors that express extracellular β-GUS. Here we present an in vivo evaluation of [18F]FEAnGA as a PET tracer for imaging of β-GUS in a less artificial model, that is, rats bearing C6 gliomas with different dimensions and in sterile muscle inflammation. The inflammation was induced by injection of turpentine, which is known to result in exudation of plasma and infiltration of neutrophils within 24 hours. The infiltrating leukocytes are thought to release β-GUS in the inflamed muscle. The C6 glioma is a rapidly growing tumor that becomes necrotic when it grows larger than 1 g. In the necrotic tumor areas, β-GUS is released by the necrotic tumor cells and infiltrating white blood cells. Thus, the large C6 tumors and the inflamed muscle, both with increased extracellular β-GUS levels, are expected to show enhanced [18F]FEAnGA accumulation.
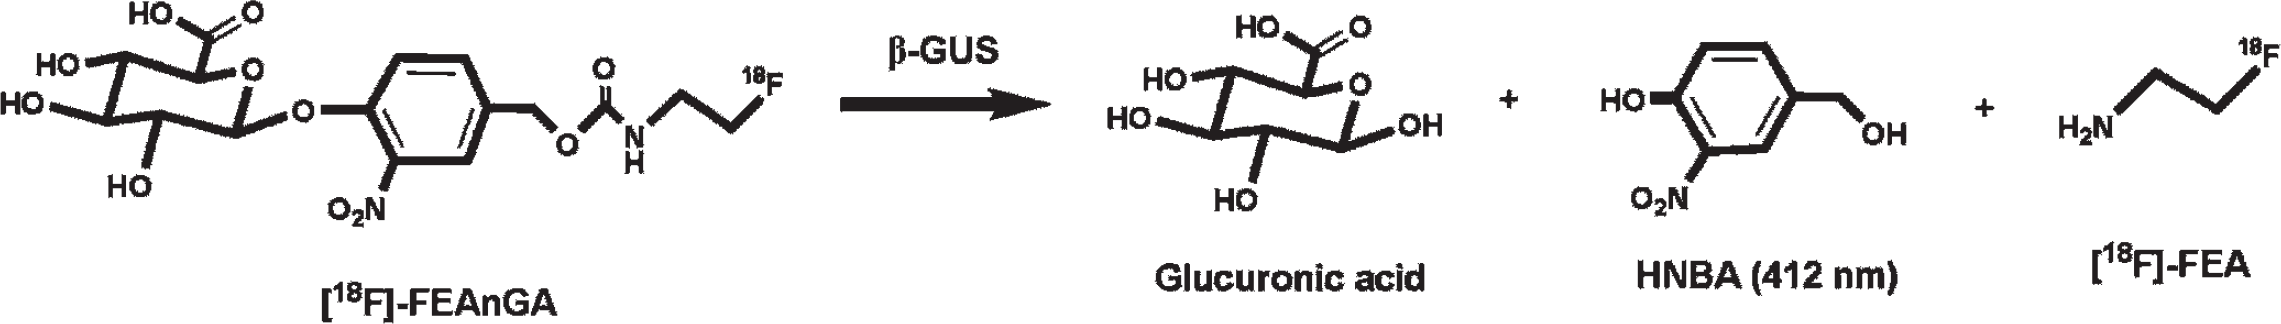
Cleavage of [18F]FEAnGA by β-GUS. The radioactive product [18F]FEA is locally trapped, and the released HNBA can be measured photospectrometrically.
Materials and Methods
Reagents and solvents were obtained from commercial suppliers (Sigma-Aldrich and Fluka, Zwijndrecht, the Netherlands and Merk, Darmstadt, Germany) and used without further purification.
Preparation of [18F]FEAnGA
[18F]FEAnGA was prepared from [18F]fluoroethylamine ([18F]FEA) as described previously. 15 The tracer was purified by high-performance liquid chromatography (HPLC) using a semipreparative Prodigy C18 reversephase column (5 μ, 10 ™ 250 mm; Phenomenex) with 10% ethanol in 2.5 mM sodium phosphate buffer as the eluent (flow rate: 4 mL/min; retention time: [18F]FEAnGA = 10 minutes, [18F]FEA = 5 minutes). At the end of synthesis, quality control was performed by HPLC with a Symmetry C18 column (5 μm, 4.6 × 150 mm) with 5% acetonitrile in sodium phosphate buffer 2.5 mM as the eluent (flow rate: 1 mL/min; retention time: [18F]FEAnGA = 23 minutes). The specific activity of [18F]FEAnGA was 15 ± 6 GBq/mmol, and the radiochemical purity was always > 95%.
Culturing of C6 Rat Glioma Cells
C6 rat glioma cells obtained from the American Type Culture Collection were maintained in Dulbecco's Modified Eagle Medium (DMEM, Invitrogen, Carlsbad, CA) supplemented with 7.5% fetal bovine serum in 25 cm3 culture flasks. All cells were grown in a humidified atmosphere containing 5% CO2 and passaged every 3 to 4 days.
Induction of Subcutaneous C6 Tumors in Wistar Rats
Wistar rats (6–8 weeks old) were obtained from Harlan (Lelystad, the Netherlands). The animals were provided with standard laboratory chow and tap water ad libitum. All studies were carried out in compliance with the local ethical guidelines for animal experiments. The protocols were approved by the Animal Ethics Committee of University of Groningen. The tumor/inflammation model was described previously by van Waarde and colleagues. 16 Briefly, C6 glioma cells (2–3 × 10⁶ in a 1:1 mixture of Matrigel [BD Bioscience, Franklin Lakes, NJ] and DMEM containing 7.5% fetal bovine serum) were subcutaneously injected into the right shoulder of male Wistar rats. At day 12, 0.1 mL of turpentine was intramuscularly injected into the thigh of the left hindleg of the same animal.
BiodistributionStudies in Healthy Wistar Rats
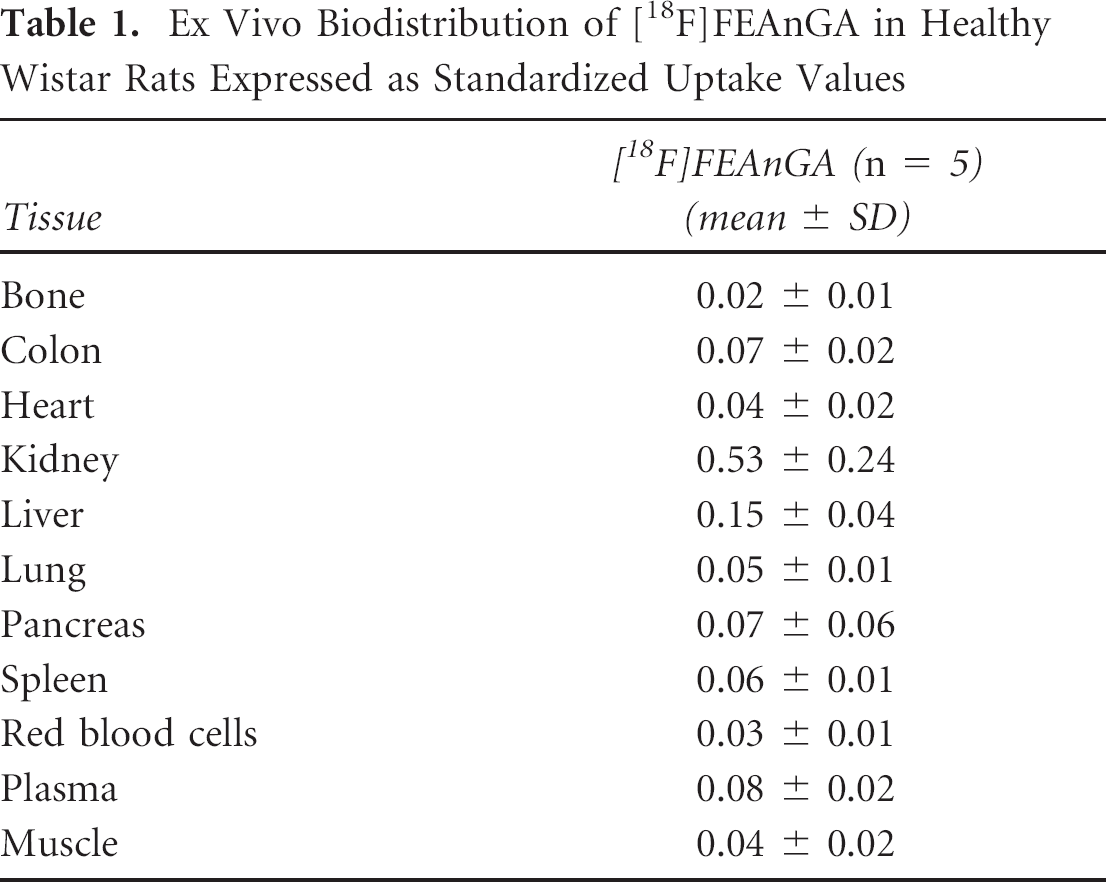
A group of healthy Wistar rats (n = 5) was anesthetized with 2% isoflurane (Pharmachemie BV, Haarlem, The Netherlands) in medical air. The unconscious animals were injected into the penile vein with 5.04 ± 1.80 MBq of [18F]FEAnGA. The animals were sacrificed 60 minutes postinjection by extirpation of the heart while still under deep anesthesia. The main tissues were excised (Table 1). Blood was collected, and plasma and red cells were obtained from the blood sample by centrifugation (10 minutes at 6,000 rpm). All samples were weighed, and the respective amount of radioactivity was determined with a gamma counter (LKB Wallac, Turku, Finland). Tracer uptake is expressed as a standardized uptake value (SUV), which is defined as tissue activity concentration (MBq/g) ± body weight (g)/injected dose (MBq).
Ex Vivo Biodistribution of [18F]FEAnGA in Healthy Wistar Rats Expressed as Standardized Uptake Values
PET Imaging of Tumor Accumulation of [18F]FEAnGA
In the tumor/inflammation model (n = 8), PET scans were performed in the same animal on day 8 (tumor only) and on day 13 (tumor + inflammation). The rats were anesthetized with 2% isoflurane (Pharmachemie BV) and positioned in the small-animal PET camera (MicroPET Focus 220, Siemens Medical Solutions USA, Inc., Malvern, PA) with the tumor in the field of view. The linear spatial resolution in the center of the field of view of the camera is < 1.3 mm, corresponding to a volumetric resolution < 2.5 μL. A transmission scan of 515 seconds with a Co-57 point source was obtained for the correction of attenuation and scatter by tissue. After the transmission scan was completed, 12.5 ± 4.7 MBq of the PET tracer [18F]FEAnGA was injected via the penile vein. Simultaneously with the injection of the PET tracer, an emission scan of 60 minutes was started. After completion of the emission scan on day 8, the animals were placed back in their cages and allowed to wake up. After the scan on day 13, the rats bearing a C6 tumor and sterile inflammation were sacrificed by extirpation of the heart while still under deep isoflurane anesthesia. The complete tumor was removed and separated from muscle and skin. Inflamed muscle could be distinguished from the surrounding tissue by its pale color and the strong odor of turpentine. The inflamed region was excised from the affected thigh. Tumor and control and inflamed muscle were weighed, and the respective amount of radioactivity was measured with a gamma counter.
PET Imaging of [18F]FEAnGA Pharmacokinetics in Tumor-Bearing Rats
In a group of Wistar rats (n = 13) bearing a C6 tumor (8 days after inoculation) or a C6 tumor and inflammation (13 days after inoculation), a cannula was inserted into the femoral artery for collecting blood samples. A dynamic PET scan was performed as described above. During the PET scan, blood samples of 0.1 mL were taken at 15, 30, 45, 60, 75, 90, 120, 150, 300, 450, 600, 1,800, and 3,600 seconds after tracer injection. After a blood sample was taken, 0.1 mL of heparinized saline was injected via the artery cannula to prevent large changes in blood pressure. The blood samples were centrifuged at 6,000 rpm for 10 minutes, and 50 μL of plasma was collected. The activity in plasma was measured with a gamma counter (LKB Wallac). The plasma-activity curves were corrected for decay. The rats were sacrificed after the scans, and the tumors and inflamed and healthy muscles were excised and weighed. The radioactivity in the tissues was measured with a gamma counter and converted into SUV.
PET Data Reconstruction and Data Analysis
The list mode data of the emission scans were separated into 17 frames. Emission sinograms were iteratively reconstructed (two-dimensional ordered subsets expectation maximization [OSEM], four iterations, 16 subsets) after being normalized, corrected for attenuation, and corrected for radioactive decay. Three-dimensional regions of interest (ROI) were generated automatically based on Intensity threshold method using Inveon Research Workplace software (Siemens Medical Solutions USA, Inc., Molecular Imaging, Knoxville, TN).17,18 Briefly, the last nine frames (10–60 minutes) were summed, and an ROI of the viable part of the tumor was generated automatically with a 50% threshold using a region-growing method; that is, only pixels with tracer uptake > 50% of the maximum value within the lesion were included. The resulting ROI were used on the original data to create the corresponding time-activity curves (TACs). A second ROI was drawn around the whole tumor to obtain the total tumor volume (Vt; cm3) using standard software (Inveon). In those animals in which plasma input curves were obtained through arterial sampling, pharmacokinetic modeling of the tissue TACs was performed using standard software (Inveon). The graphic Logan model was used to determine the distribution volume, DVT, and a two tissue-compartment model (2TCM) fit was used to calculate the K1-k4 with a free blood volume. The binding potential (BPND) was defined as k3/k4. The kinetic modeling was performed using the metabolite plasma radioactivity curve as input function.
Metabolite Analysis of [18F]FEAnGA in Plasma
Two and a half microliters of each plasma sample was collected and applied on a thin layer chromatography (TLC) plate (F-254 silica gel plates, Merck, Darmstadt, Germany) and eluted with acetonitrile and water (7:3) (Rf [18F]FEA = 0.57, Rf [18F]FEAnGA = 0.89). After elution, radioactivity on TLC plates was analyzed by phosphor storage imaging. Exposed screens were scanned with a Cyclone phosphor storage system (PerkinElmer Life and Analytical Science, (Downers Grove, IL)), and the percentage of conversion of [18F]FEAnGA as a function of the tracer distribution time was calculated by ROI analysis using OptiQuant software (PerkinElmer Life and Analytical Science).
Ex Vivo Analysis of the Conversion of [18F]FEAnGA into [18F]FEA by Measurement of the Release of HNBA
Part of the tumors (0.08 ± 0.04 g), inflamed muscle (0.11 ± 0.05 g), and healthy muscle (0.09 ± 0.03 g) excised from the sampled animals was homogenized in 2 mL of phosphate-buffered saline (PBS). The homogenates were centrifuged (10 minutes, 3,000 rpm, 4°C), and the supernatant was collected and kept on ice. To the supernatant, 2 mL of cold MeCN was added to precipitate the remaining proteins. The samples were vortexed for 30 seconds and centrifuged at 3,000 rpm for 10 minutes at 4°C. A volume of 1.5 mL of the supernatant was added to 1.5 mL of cold NaOH 0.25 M, and ultraviolet absorption was measured (Waters Corporation, Milford, MA, 2487 dual wavelength absorbance detector, 412 nm). Absorption was converted in concentration using an 4-hydroxy-3-nitrobenzyl alcohol (HNBA, Acros Organics, Geel, Belgium) calibration curve and corrected for the weight of the tumor sample. The measurements were performed in duplicate.
Ex Vivo Analysis of Tracer Specificity by Inhibition of β-GUS
To prove that [18F]FEAnGA cleavage is mediated by β-GUS, inhibition experiments were performed using the specific β-GUS inhibitor D-glucaro-1,4-lactone (saccharolactone). Tumors were excised and directly homogenized in 1 mL of PBS. Either 1 mL of 50 μM of saccharolactone in PBS (β-GUS inhibition) or 1 mL of PBS alone (control) was added to the homogenates. After 5 minutes at 37°C, approximately 250 kBq of [18F]FEAnGA was added and the homogenates were incubated at 37°C for another hour. During this period, samples were taken at different time points and analyzed by radioTLC, as described above for the metabolite analysis.
Histology of Tumor Necrosis
The frozen excised tumors were cut serially in sections of 20 μm thickness. Central sections of the tumor (containing a mixture of the rim and the necrotic core) were stained with hematoxylin and eosin using standard procedures and photographed with an Olympus photomicroscope.
Statistical Analysis
Statistical analysis was performed using Excel 2003 (Microsoft) and SigmaPlot version 10.0 (SPSS, Inc, Chicago, IL). Tumors were divided into two groups based on their sizes using the mean volume of all tumors (1.5 cm3, n = 15) as the discriminator. Tumor size ranged from 0.4 to 1.4 cm3 for the small tumor group (n = 8) and from 1.5 to 3.8 cm3 for the large tumor group (n = 7).
Interestingly, PET images of tumors larger than 1.5 cm3 showed nonviable areas with poor perfusion, whereas such areas were not observed in tumors smaller than 1.5 cm3. Differences in tracer accumulation between both groups of C6 tumors were analyzed using the two-sided unpaired Student t-test. Differences in tracer accumulation between inflamed and healthy muscle were studied in the same animal to reduce variability between animals and therefore were analyzed using the two-sided paired Student t-test. Significance was reached when the p value was < .05. Correlations were calculated with the linear regression algorithm in SigmaPlot and were considered statistically significant whenever R2 was > .5 and p was < .05.
Results
Biodistribution of [18F]FEAnGA in Healthy Wistar Rats
The normal biodistribution of [18F]FEAnGA was evaluated in healthy Wistar rats at 60 minutes postinjection. Data are displayed in Table 1. [18F]FEAnGA exhibits low uptake in all investigated organs, with the highest uptake in the kidneys (SUV 0.53 ± 0.24) and liver (SUV 0.15 ± 0.04). These findings suggest that the tracer is rapidly excreted mainly through the renal pathway, resulting in low background.
PET Studies
Two microPET scans were performed on each animal (eight animals), on day 8 and on day 13, to evaluate tracer uptake in small and large tumors, respectively. Small tumors are known to have low expression of extracellular β-GUS compared to larger tumors, which are known to have higher levels of extracellular β-GUS.4–6 In the PET images, the small C6 gliomas (Vt < 1.5 cm3) revealed a homogeneous [18F]FEAnGA uptake, whereas in the large tumors (Vt > 1.5 cm3), higher [18F]FEAnGA uptake in the viable part of the tumor and low uptake in the nonviable part of the tumor are clearly visible (Figure 2).

MicroPET images of a rat made on day 8 (A) and day 13 (B) after inoculation of C6 cells. The position of the tumor is indicated by the ellipse.
The TACs of the tumors revealed different kinetics of [18F]FEAnGA in larger tumors (> 1.5 cm3) compared to smaller tumors (< 1.5 cm3). The accumulation of radioactivity in smaller C6 tumors reached a maximum at 1.5 minutes postinjection and afterward decreased exponentially, with a half-life of 12 ± 3 minutes, whereas in large C6 tumors, the accumulation of radioactivity in the viable part of the tumor decreased, with a half-life of 24 ± 13 minutes (Figure 3). These differences in accumulation of radioactivity between tumors are significant at intervals ≥ 25 minutes after the injection of [18F]FEAnGA (p < .05). Furthermore, the area under the curve (AUC) of [18F]FEAnGA in large tumors is 1.7 times higher when compared to the AUC of [18F]FEAnGA in small tumors (p = .05).

Kinetics of [18F]FEAnGA-derived radioactivity in the viable part of the tumors of different sizes. *p < .05 compared to small C6 tumors.
At the end of the second scan (day 13) excision of the tumors, inflamed and control muscles was performed to evaluate the accuracy of the PET experiments and to evaluate whether there was any difference in radioactivity accumulation in inflammation lesions compared to control muscle. In the excised C6 tumors, [18F]FEAnGA uptake (SUV) was 0.13 ± 0.09 at 1 hour after injection. The accumulation of radioactivity in the excised inflamed muscle (0.07 ± 0.05) was significantly higher than in healthy muscle (0.04 ± 0.03, p < .05).
Pharmacokinetic Modeling
The sampled rats were divided into two groups (one group where Vt was < 1.5 cm3 and a second group where Vt was > 1.5 cm3) to evaluate the tracer's pharmacokinetics in large heterogeneous and small homogeneous tumors, respectively.
By applying 50% of maximum SUV as the threshold, an ROI was obtained corresponding to the viable part of the tumor to obtain [18F]FEAnGA TACs of the viable part of the tumor. The SUVs of [18F]FEAnGA in the viable part of the tumor, obtained from the last 10 minutes of the PET scan, correlated well with the ex vivo biodistribution of [18F]FEAnGA in the whole tumor (including necrosis) (y = 1.9058× − 0.077, R2 = .78, p < .0001). However, this correlation depends strongly on a single point on the top right-hand side of the graph (Figure 4). If this point is excluded, only a much weaker correlation is observed (y = 0.8246× + 0.0179, R2 = .32, p = .04). These TACs, together with an individual metabolite-corrected plasma radioactivity curve, were used for pharmacokinetic modeling.
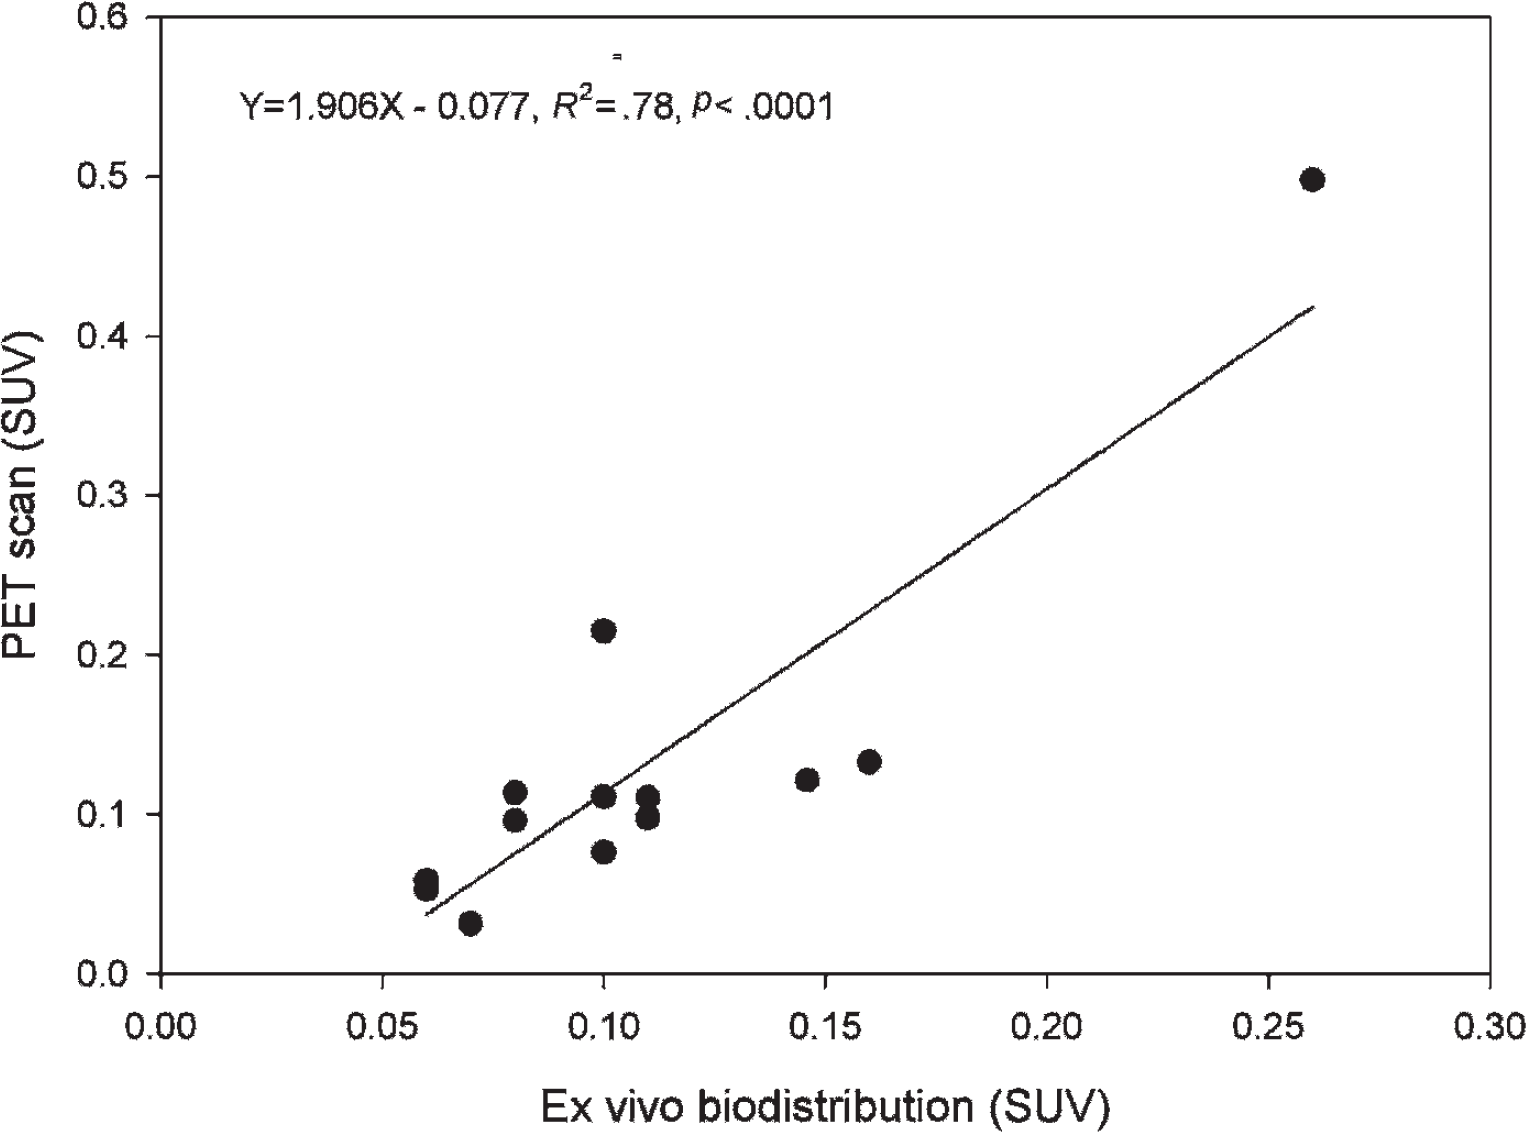
Correlation between tumor uptake of radioactivity (SUV) determined in vivo by PET and ex vivo by gamma counting.
As an initial approach toward pharmacokinetic modeling, Logan and Patlak graphic analyses were applied to evaluate the reversibility of [18F]FEAnGA uptake in the viable part of C6 tumors. It was visually found to be a better fit of [18F]FEAnGA TACs of the viable part of the tumor to the Logan analysis when compared to the Patlak analysis (delay time 10 minutes from injection; data not shown).
The distribution volume, DVT, of [18F]FEAnGA in the viable part of C6 tumors > 1.5 cm3 (0.64 ± 0.13), obtained with the Logan analysis, was found to be 1.6 times higher than the distribution volume of [18F]FEAnGA in smaller tumors (< 1.5 cm3) (0.39 ± 0.08, p = .001).
The distribution volume of [18F]FEAnGA on the viable part of the tumors obtained with the 2TCM was found to be 1.8 times higher (p = .0002) in larger tumors when compared to smaller tumors. Figure 5A shows virtually no overlapping of the estimated distribution volumes in both groups. Furthermore, the distribution volume estimated with the 2TCM is in agreement with that estimated with Logan graphic analysis (y = 1.0309× − 0.0388, R2 = .98, p < .0001) (Figure 5B). No statistically significant differences were found in the influx of [18F]FEAnGA (K1) in one-tissue compartment model (1TCM) as well as in K1/k2 in the 2TCM in any sampled tumors. A significantly higher [18F]FEAnGA binding potential (k3/k4) was found in the tumors > 1.5 cm3 (1.4 ± 1.1) than in tumors < 1.5 cm3 (0.6 ± 0.2, p < .05). Moreover, the Aikake information criterion (AIC) 19 values were found to be lower for the 2TCM when compared to the 1TCM (online version only).

A, Tracer distribution volume (DVT) in the viable part of the tumors calculated from a two-tissue compartment model (2TCM) fit. B, Correlation between DVT calculated from a 2TCM fit and estimated by Logan graphic analysis of PET data.
Measurement of β-GUS Activity
β-GUS activity can be assessed by measurement of the release of the spacer, HNBA, or the radioactive moiety [18F]FEA. However, owing to the lack of activity at the end of the experiments, it was not possible to measure the released [18F]FEA; therefore, the β-GUS activity was assessed only by measurement of the release of HNBA from [18F]FEAnGA. β-GUS activity was analyzed from the homogenates of the excised tumors and inflamed and control muscles. The conversion was 1.5 times higher in tumors > 1.5 cm3 (4.33E-04 ± 1.33E-04) than in tumors < 1.5 cm3 (2.95E-04 ± 0.7E-04).
Furthermore, there was a significant correlation between HNBA formation and the distribution volume in the viable part of the tumors (Figure 6A). The conversion of [18F]FEAnGA in muscle was found to be 1.7 times higher in inflamed muscle (2.40E-04 ± 0.88E-04) when compared to healthy muscle (1.42E-04 ± 0.23E-04). Moreover, there was a significant correlation between HNBA formation and radioactivity accumulation (SUV) in inflamed muscle (Figure 6B).

Correlation between (A) DVT of [18F]FEAnGA in the viable part of the tumors calculated from a model fit or (B) uptake of [18F]FEAnGA in inflamed muscle tissue (SUV) and rate of tracer cleavage determined in tissue homogenate.
To prove that [18F]FEAnGA conversion is β-GUS-mediated, tumor homogenates were incubated in the presence or absence of the specific β-GUS inhibitor saccharolactone. In the absence of saccharolactone, 56 ± 5% of [18F]FEAnGA in the tumor homogenate was converted into [18F]FEA after 1 hour of incubation. In contrast, the formation of [18F]FEA was completely blocked in the presence of 50 μM of saccharolactone (Figure 7). Therefore, nonspecific cleavage of the tracer can be excluded.

Conversion of [18F]FEAnGA into [18F]FEA in tumor homogenates in the presence or absence of the specific β-GUS inhibitor saccharolactone.
Histology of the C6 Tumor
Histologic examination of the excised C6 tumors presented very distinct profiles in large and small tumors (Figure 8). In the large tumors, extensive necrotic regions were found. These regions are characterized by the loss of the integrity of the nuclei, whereas in smaller tumors, the nuclei remain intact, indicating no signs of necrosis.

Microscopic image of a specimen of rat tumor: (A) smaller and (B) larger than 1.5 cm3 (hematoxylin-eosin stain; ×400 original magnification).
Discussion
The extracellular β-GUS in tumors has been exploited to develop new PD therapies. In spite of encouraging preclinical results, this therapy is still unsuccessful in a clinical setting. A major obstacle for clinical usefulness is the remaining interindividual and intertissue variability of β-GUS activity. Thus, with a proper PET tracer, it would be possible to evaluate the extent and distribution of extracellular β-GUS activity, providing more information about the factors that modulate the enzyme's expression and activity.
Our previous study, in which we tested [18F]FEAnGA as a microPET probe in β-GUS-expressing tumors (CT26m-βGUS), showed preferential radioactivity accumulation in these tumors when compared to normal CT26 tumors. 15 Our results were in agreement with those obtained with the 124I-PTH-G probe synthesized in Tzou and colleagues' group, indicating that glucuronide probes are good candidates for the evaluation of β-GUS expression in tumors. 14 Tzou and colleagues also found increased radioactivity accumulation in normal CT26 tumors where necrosis was present, suggesting that 124I-PTH-G might also be used to evaluate extracellular β-GUS activity in normal tumors. Thus, the aim of this study was to explore whether [18F]FEAnGA could be a suitable PET tracer to detect normal β-GUS levels present in solid tumors. Furthermore, we also tested this probe in inflammation lesions to evaluate whether in this situation the secretion of β-GUS could be detected by [18F]FEAnGA.
A preliminary ex vivo biodistribution of [18F]FEAnGA in normal Wistar rats showed that the tracer was very rapidly excreted, mainly through the renal pathway, owing to its hydrophilic nature. 15 The tracer showed little background uptake in almost all tissues. The biodistribution in rats was in agreement with the biodistribution in mice that we observed previously.
In this study, two microPET scans were performed in each animal on different days (8 and 13 after C6 cell inoculation) to evaluate whether there were any significant changes in the uptake of [18F]FEAnGA in tumors with different sizes. The present PET study showed that tumors could clearly be visualized in the PET images owing to the low background in normal tissues. The TACs of the viable parts of the tumors revealed that tumors > 1.5 cm3 exhibit two times longer tracer retention than tumors < 1.5 cm3. This increased retention can be ascribed to the higher conversion of the tracer into [18F]FEA in large tumors that contain more extracellular β-GUS. [18F]FEA is retained better in tumors than the intact tracer. We previously performed an in vitro efflux study with [18F]FEA in C6 cells showing that about 50% of [18F]FEA remains trapped in the cells after 60 minutes' incubation in an activity-free medium. We also performed a pilot study to investigate the tumor retention of [18F]FEA in three Wistar rats bearing C6 tumors. This pilot study showed rapid accumulation of the [18F]FEA in the tumor in the first 10 minutes postinjection. The activity remained trapped in the tumor for the remaining 50 minutes of the PET scan (data not shown). These data support the conclusion that the increased retention of activity in larger tumors is due to the released [18F]FEA, which remains trapped in the tumor.
The SUVs obtained in small C6 gliomas at the last 10 minutes of the PET scan were, on average, lower than the values obtained from ex vivo biodistribution probably caused by partial volume effects and spillover owing to the limited spatial resolution of the PET scanner (1.35 full-width at half-maximum in the center of the field of view). 18 Partial volume effects can lead to a spreading out of high activity to surrounding areas, resulting in an underestimation in the measurements of [18F]FEAnGA uptake. However, in large C6 gliomas, where some tumors presented a large necrotic area, the apparent uptake values obtained by PET of the viable part of the tumors were, on average, higher than the values obtained in the biodistribution of the whole tumors. Nevertheless, the values obtained in the distribution were not significantly different from the ones obtained from the PET scan.
In the present ex vivo study, it was shown that the SUV of [18F]FEAnGA is significantly higher not only in the large C6 tumors but also in the inflamed muscle compared to control muscle. This suggests that there is an increased release of β-GUS within 24 hours after the induction of the sterile inflammation.
Although the SUV is widely used to quantify the uptake of tracers, it does not correct for the activity in plasma and thus not for tracer delivery to the tissue. This could lead to a wrong interpretation of the data when comparing the tracer in different conditions. Ideally, the binding potential or distribution volume of the tracers should be determined using plasma input on different time points during the scan. Thus, in the present study, we further explored quantification of [18F]FEAnGA uptake by pharmacokinetic modeling.
The result of curve fitting by the 2TCM was more accurate than that of the 1TCM, indicating that the state of equilibrium between free and bound tracer cannot be considered to be reached instantly. The values of AIC were significantly lower for the 2TCM, which was therefore selected for further analysis. As shown in Figure 5, the estimated distribution volume from kinetic analysis with the 2TCM was found to be significantly different in the two groups (small tumors vs large tumors).
The compartment analysis was consistent with the Logan graphic analysis. The estimated distribution volume from kinetic analysis with Logan plot analysis and the 2TCM were well correlated, which indicated that both methods provided a stable estimation of the distribution volume. Moreover, analysis of tumor homogenates revealed 1.5 times higher amount of cleaved spacer, HNBA, in larger tumors when compared to smaller tumors. The amount of HNBA correlated well with the distribution volumes in the viable part of the tumors obtained from Logan plots as well as the 2TCM, suggesting that the distribution volume reflects β-GUS activity. Given that metabolite analysis indicated that [18F]FEAnGA is stable in plasma, with 90% of the tracer remaining unmetabolized during the time of the PET scan, we can attribute this enhanced cleavage of [18F]FEAnGA to HNBA and [18F]FEA only to the release of β-GUS into the extracellular space of the tumors. Furthermore, complete blocking of the conversion of the tracer in tumor homogenates with saccharolactone demonstrated that the conversion of [18F]FEAnGA into HNBA and [18F]FEA is specifically mediated by β-GUS.
Conclusion
In the present study, we were able to demonstrate that despite relatively low absolute uptake, [18F]FEAnGA is a PET tracer able to detect an increased release of β-GUS in large solid tumors and in inflammatory lesions. Therefore, [18F]FEAnGA could help obtain better understanding of the metabolic conversion of glucuronide PDs in tumors or in inflammatory diseases.
Footnotes
Acknowledgments
We thank J.W.A. Sijbesma, V. di Gialleonardo, and J. Doorduin for their help in the in vivo studies; K. Stojanov for providing the C6 glioma cells; and J. Georgieva for performing the histochemical staining.
Financial disclosure of authors and reviewers: None reported.