
Abstract
Labeling of RGD peptides with near-infrared fluorophores yields optical probes for noninvasive imaging of tumors overexpressing αvβ3 integrins. An important prerequisite for optimum detection sensitivity in vivo is strongly absorbing and highly emissive probes with a known fluorescence lifetime. The RGD-Cy5.5 optical probe was derived by coupling Cy5.5 to a cyclic arginine–glycine–aspartic acid–
IN RECENT YEARS, various imaging technologies have been used to monitor noninvasive biologic processes related to tumor progression in vivo in preclinical research. Functional imaging employing techniques such as positron emission tomography (PET), 1 single-photon emission computed tomography (SPECT), 2 and optical imaging with fluorescence and bioluminescence signal generation 3 allows for the discrimination between healthy and malignant cells that overexpress certain cancer-related biomarkers. 4 Radionuclide-labeled probes in combination with PET and SPECT are widely used for the visualization of cancer foci in vivo, yet the synthesis of radionuclides is expensive, and these techniques require special safety measures. Interesting alternatives are optical imaging techniques, which use light to visualize the optical characteristics of tissue via measurement of absorption, scattering, or fluorescence. Especially promising is near-infrared fluorescence (NIRF) imaging owing to its comparative ease of use and low costs and its high sensitivity, enabling, for example, in vivo detection of early stages of cancer and/or the monitoring of drug treatment. 5
At the core of fluorescence imaging are fluorophores absorbing and emitting in the near-infrared (NIR; 650–900 nm) wavelength region, which can be used either directly as nontargeted contrast agents or as fluorescent reporters in modularly built, targeted optical probes directed against cancer-specific biomarkers.6–9 The suitability of optical probes and the achievable sensitivity for tumor detection are determined by the target specificity of the ligand and the optical properties of the fluorescent reporter, that is, the molar (decadic) absorption coefficient of the ligand-conjugated fluorophore at the chosen excitation wavelength and its fluorescence quantum yield that presents a measure for its fluorescence efficiency.
One of the key limitations of fluorescence imaging is autofluorescence of living organisms that can easily lead to misinterpretation of data and can hamper detection sensitivity.10,11 One elegant strategy to enhance the selectivity and, thus, the overall sensitivity presents fluorescence lifetime imaging with time-gated emission analysis. Here the probe-specific fluorescence lifetime is exploited for the discrimination of probe-derived fluorescence from undesired background emission, including autofluorescence and nonspecific fluorescence.11,12 Moreover, in contrast to the fluorescence intensity, the fluorescence lifetime is relatively insensitive to the excitation intensity and fluorophore concentration and thus less prone to systematic errors. Lifetime-based imaging has been increasingly employed13–15; only recently, a novel method, diffuse optical tomography, has been used to image the lifetimes of cypate-labeled RGD. 16 However, it should be considered that the full potential of time domain NIRF imaging and generation of reliable data require previous spectroscopic characterization of the chosen optical probe under application-specific conditions as the fluorescence lifetime—similar to the molar absorption coefficient and the fluorescence quantum yield—is sensitive to the microenvironment.
To underline the need for spectroscopically well-characterized contrast agents and to highlight the potential of lifetime-weighted analysis of fluorescence intensity for in vivo imaging, we applied the optical probe RGD-Cy5.5. This probe consists of a cyclic arginine–glycine–aspartic acid–
The peptide ligand RGDfK was chosen because of its reported selective recognition of the cell surface receptor αvβ3 integrin,17,18 which is significantly overexpressed in certain tumor types, such as glioblastoma, melanoma, and ovarian, breast, and prostate tumors, and in activated endothelial cells in newly synthesized blood vessels. 22 Accordingly, this peptide can serve as a ligand for the detection of tumor cells and monitoring of tumor angiogenesis1,2,4 similar to other peptides, such as LXY1 (leucine–random amino acid–tyrosine 1), which targets a different type of integrin, α3β1 integrin. 23 Moreover, in contrast to the majority of ligands, such as antibodies, which typically contain different labeling sites and can therefore yield in multilabel systems with varying dye to protein ratios, this RGD peptide contains only a single dye labeling site, thereby circumventing contributions from dye–dye interactions within the molecule.9,24
In this study, we carefully characterized the fluorimetric properties of RGD-Cy5.5, such as fluorescence quantum yield and lifetime, in comparison to the nonconjugated fluorophore Cy5.5. Here we especially focused on measurements under application-relevant conditions, for example, in protein-containing solution and after subcutaneous (SC) injection. Subsequently, we performed comparative in vivo NIRF imaging experiments in the intensity and lifetime domain and employed the lifetime property to select only probe-derived signals in whole-body measurements. With the example of RGD-Cy5.5, we showed that an extensive spectroscopic characterization of optical probes under application-relevant conditions followed by incorporation of these measurements in the analysis of in vivo NIRF imaging data is important for sensitive and effective imaging of human tumor xenografts in preclinical settings.
Materials and Methods
Synthesis of RGD-Cy5.5
Cyclic RGDfK peptides were synthesized, 19 and the aminohexanoic acid spacer was coupled to these peptides as previously described. 25 Coupling of monomeric RGD peptides to Cy5.5 via the aminohexanoic acid spacer was performed in cooperation with Squarix Biotechnology (Marl, Germany).
Spectroscopic Studies and Thermal Stability
The absorption and the fluorescence emission spectra as well as fluorescence quantum yields of the optical probe RGD-Cy5.5 and nonconjugated Cy5.5 were determined in duplicate in phosphate-buffered saline (PBS) and in PBS containing 5% bovine serum albumin (BSA). The absorption spectra were recorded on a CARY 5000 spectrometer (Varian Inc., Palo Alto, CA). The fluorescence emission spectra were measured with the SML Aminco spectrofluorometer 8100 (Spectronics Instruments, Westbury, CT). 26 The emission was excited at 620 nm (absorbance of 0.015) to minimize fluorescence-reducing and -distorting inner filter effects and reabsorption. For the measurement of the fluorescence quantum yields (Φ f ) using oxazine 1 (Lambda Physik GmbH, Göttingen, Germany) in ethanol as the quantum yield standard (ΦF = 0.15), 27 Glan Thompson polarizers placed in the excitation and emission channels were set to 0° and 54.7°, respectively. The fluorescence quantum yields were calculated from integrated, blank, and spectrally corrected emission spectra as previously described. 28
Typical uncertainties (standard deviations) of fluorescence quantum yield measurements (determined from six replicates) are ± 5% (for Φ f > 0.4) and ± 10% (for 0.2 > Φ f > 0.02).28,29 The thermal stability of RGD-Cy5.5 in PBS at 37°C was determined gravimetrically (correction for loss of solvent) and photometrically for up to 36 hours. Standard deviations of typical absorption measurements in the absorbance range of 0.01 to 1 are up to 2%, based on six independent measurements of transparent dilute solutions.
Cell Culture
U87MG glioblastoma cells stably expressing a codon-optimized firefly luciferase for parallel monitoring of tumor growth (data not shown) were generated as previously described. 30 Cells were propagated in Dulbecco's Modified Eagle's Medium containing 10% fetal calf serum and 0.2 mg/mL G-418 and grown 24 hours without G-418 to ≈80% confluence before being harvested for injection into mice.
Tumor Xenograft Model
All animal procedures were performed in compliance with protocols that had been approved by the administration of Lower Saxony, Germany; 2 × 10⁶ U87MG cells in 100 μL PBS were injected SC into the left flank of male athymic nude (NMRI-Fox***lnu/nu) mice. Mice were inspected daily, and imaging was started 3 to 5 weeks after tumor implantation when tumors had reached an adequate size. Mice received a low-fluorescence diet (GLP Nafag feed 890, Provimi Kliba AG, Kaiseraugst, Switzerland) before NIRF imaging. Throughout all imaging sessions, mice were anesthetized with vaporized isoflurane at 1.8 to 2.0 volume percent. At the end of the study, mice were sacrificed and tumors as well as the liver, kidneys, spleen, and stomach were excised.
NIRF Imaging
The time domain fluorescence imager Optix MX2 (ART, Montreal, QC) 31 was used for intensity and lifetime imaging in the NIR region. This device measures the time between every excitation pulse and the detection of the first fluorescence photon using a single-photon counting detector. The resulting photon time-of-flight histogram, termed temporal point spread function (TPSF), obtained for each scan point, is used to calculate the lifetime of the emissive species as an exponent of the slope of the decay by underlying a monoexponential model. The system also calculates the quality of the lifetime measurement to prove that the assumption of a monoexponential decay is fulfilled in the present TPSF. 12
Imaging was carried out using an excitation wavelength of 670 nm and a 700 nm longpass emission filter. Scans were performed with a 1.5 to 2.5 mm (whole-body scans) or 0.5 to 1.0 mm (regions of interest) raster and a scan time of 0.2 to 1.0 seconds per scan point. Data were analyzed with OptiView software (ART, Montreal, QC). Intensity values were calculated in normalized counts, which are independent of laser power and integration time and allow comparison of data sets obtained with different parameters. The contrast to noise ratio (CNR) was calculated as the difference between the average fluorescence intensity over the tumor and over a chosen background region divided by the standard deviation of the background signals. The tumor to background ratio (TBR) was calculated as the average fluorescence intensity over the tumor divided by the average signal intensity over a selected background region.
The in vitro fluorescence lifetime of 0.5 nmol RGD-Cy5.5 and its parent fluorophore were measured in 500 μL PBS and PBS-BSA. To calculate the lifetime of the fluorescent probe in vivo, 0.2 nmol RGD-Cy5.5 dissolved in 50 μL 0.9% NaCl was administered SC in healthy nude mice and the resulting fluorescence was measured 1 hour after probe injection.
For in vivo imaging experiments, tumor-bearing mice were scanned before administering the fluorescent agent. Mice were injected with 0.5, 1.5, or 3.0 nmol RGD-Cy5.5, each dissolved in 150 μL of PBS. Injections were applied into the tail vein. The binding specificity of RGD-Cy5.5 to tumor cells was proved by blocking the integrin cell surface receptors with an excess of unlabeled cyclic RGDfK peptides2,32–34 (100- to 1,000-fold) added prior to the injection of 0.5 nmol RGD-Cy5.5. Images were acquired 2 to 72 hours after injection of the fluorescent probes. After sacrifice of the animals at the end of the study, various organs were explanted and subsequently scanned with the NIRF imager.
Results
Spectroscopic Properties Demonstrate the Suitability of Cy5.5-Conjugated RGD Probe for In Vivo NIRF Imaging
The optical probe RGD-Cy5.5 (Figure 1A) and its parent fluorophore Cy5.5 were compared with regard to their spectroscopic properties (Table 1). As shown in Figure 1, B and C, the absorption and fluorescence emission spectra of both probes are identical.
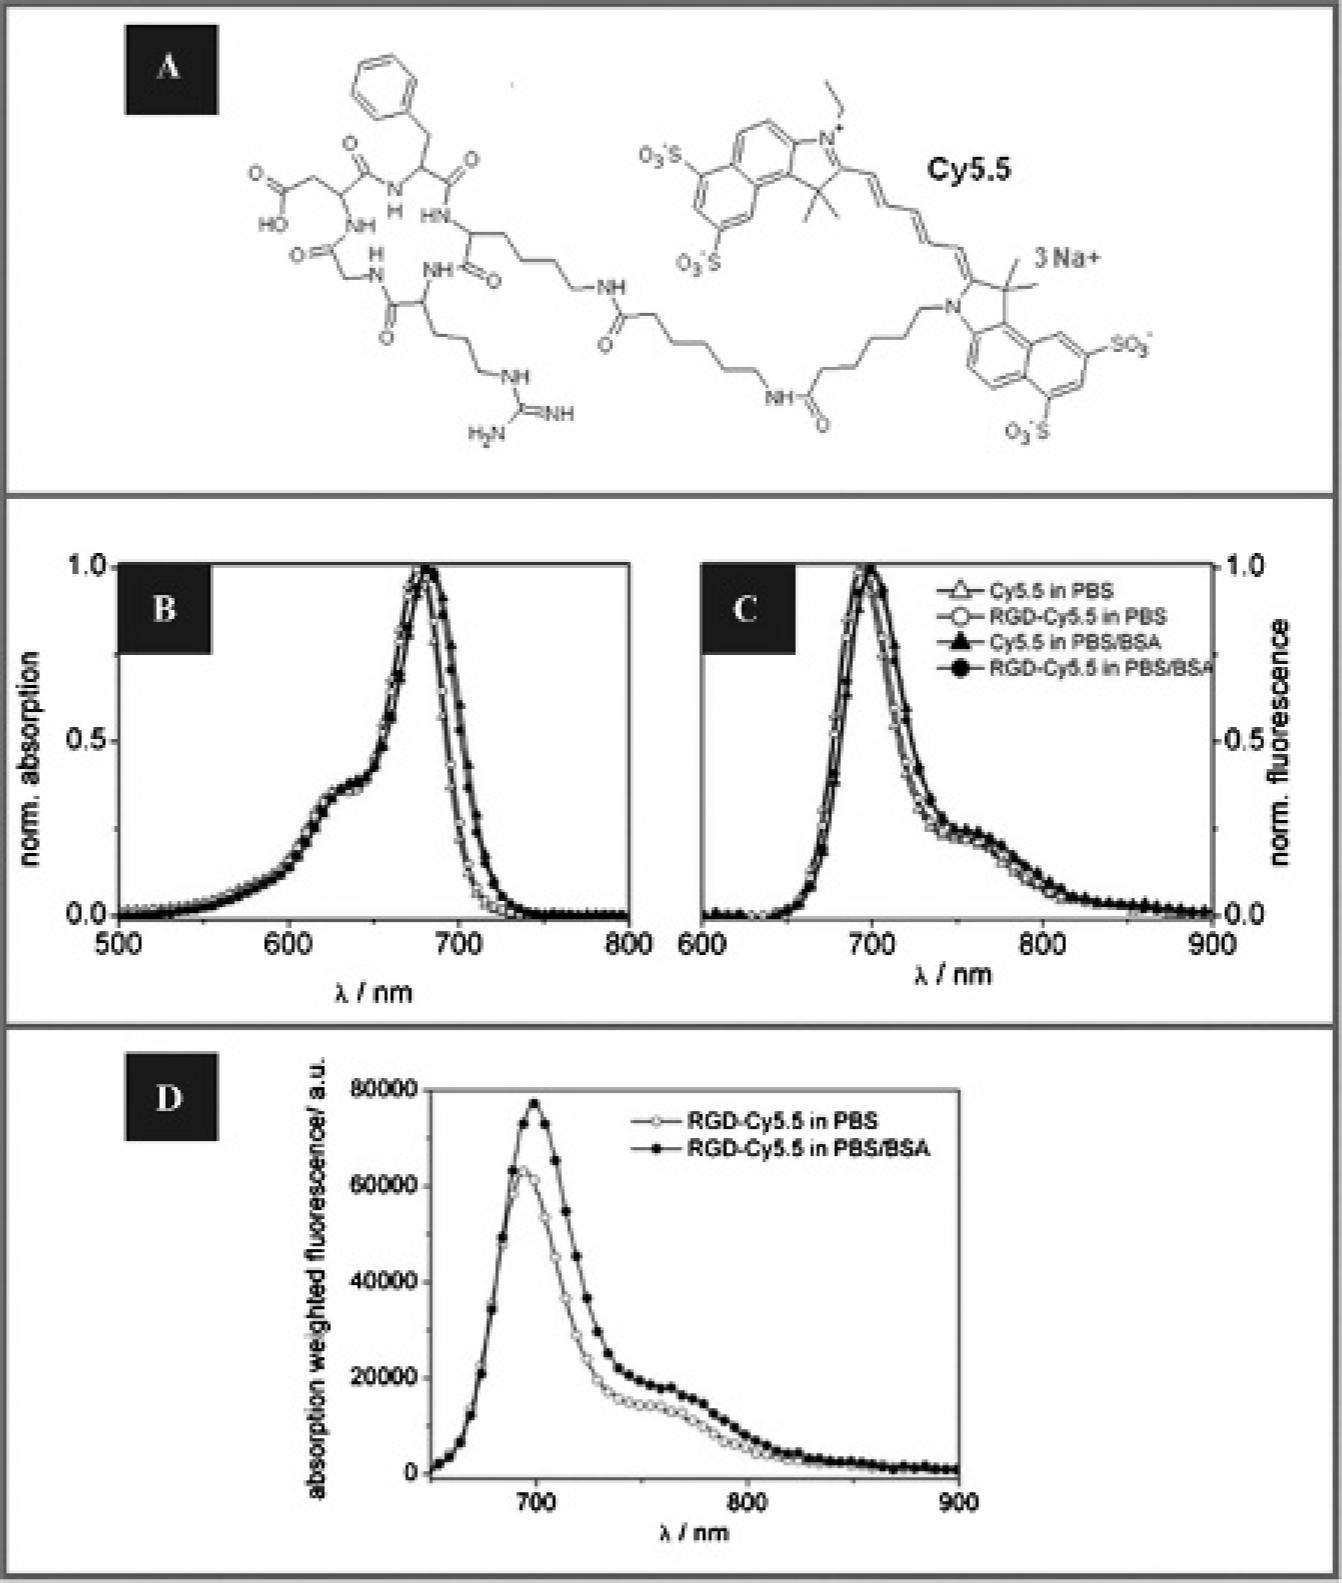
Spectroscopic characterization of RGD-Cy5.5 in PBS and PBS-BSA in comparison to nonconjugated Cy5.5. A, Structure of the cyclic RGDfK peptide linked via an aminohexanoic acid spacer to the NIR dye Cy5.5 (RGD-Cy5.5). B, Normalized absorption and, C, normalized emission spectra (n = 2) of Cy5.5 (triangles) and RGD-Cy5.5 (circles) in PBS (open symbols) and in PBS-BSA (filled symbols). D, Absorption-weighted fluorescence spectra of RGD-Cy5.5 in PBS (open circles) and PBS-BSA (filled circles). The absorption-weighted fluorescence spectra are proportional to the respective fluorescence quantum yield showing an increased fluorescence of RGD-Cy5.5 in the presence of proteins.
The interaction of optical probes with plasma proteins is of particular relevance not only for the resulting pharmacokinetics and biodistribution, yet this interaction can also considerably influence the spectroscopic properties of fluorophores. 8 Accordingly, we also determined the absorption and emission properties of the probe not only in aqueous solution (PBS) but also in the presence of BSA. BSA was chosen as serum albumin presents the main plasma protein (60%) in human. 35 In PBS-BSA, the absorption and emission spectra of Cy5.5 and RGD-Cy5.5 undergo a small red shift (shifts of 7 and 5 nm for Cy5.5 and RGD-Cy5.5, respectively; see Figure 1, B and C) and the fluorescence quantum yield increases by a factor of ≈1.5 and ≈1.3, respectively (see Table 1). The RGD-Cy5.5 fluorescence enhancement is illustrated in Figure 1D comparing the absorption-weighted emission spectrum (that is proportional to the respective fluorescence quantum yield) in PBS to that in PBS-BSA.
RGD-Cy5.5 is stable in PBS and in PBS-BSA at 37°C over a period of at least 72 hours; that is, no spectral or intensity changes in absorption and emission were found during this time interval (data not shown) used later for fluorescence imaging in mice.
Spectroscopic Properties Demonstrate the Suitability of Conjugated RGD for In Vivo Imaging in the Lifetime Domain
Lifetime measurements of Cy5.5 and RGD-Cy5.5 revealed a slight increase in fluorescence lifetime (Φf) of the fluorophore in RGD-Cy5.5 (Φf = 1.17 ns) compared to the free dye (Φf = 1.04 ns) measured in PBS (see Table 1). The presence of BSA leads to an increase in fluorescence lifetime for RGD-Cy5.5 (Φf = 1.91 ns) and Cy5.5 ((Φf = 2.15 ns), thereby reflecting the observed enhancement in fluorescence quantum yield.
Spectroscopic Properties of RGD-Cy5.5 in PBS and PBS-BSA in Comparison to Nonconjugated Cy5.5

BSA = bovine serum albumin; PBS = phosphate-buffered saline; λabs = longest wavelength absorption maximum, λfl = emission maximum, Φf = fluorescence quantum yield, τf = fluorescence lifetime. All measurements were performed in duplicate.

Characterization of RGD-Cy5.5 intensity and lifetime by temporal point spread function (TPSF) analysis. A, Fluorescence intensities and, B, lifetimes of 0.5 nmol RGD-Cy5.5 in vitro in PBS-BSA (n = 3) were calculated from, C, the TPSF showing a monoexponential decay and an average fluorescence lifetime of 1.91 ns. D, Fluorescence intensity of RGD-Cy5.5 after subcutaneous injection of 0.2 nmol in the left shoulder (white circular area) of a nude mouse (n = 4). E, Corresponding lifetime map. F, The monoexponential TPSF was used to calculate 1.83 ns as an average fluorescence lifetime of RGD-Cy5.5 in tissue.
The fluorescence intensity (Figure 2A) and lifetime (Figure 2B) of RGD-Cy5.5 were calculated from TPSFs. TPSF analysis of RGD-Cy5.5 in PBS-BSA revealed a monoexponential decay with an average lifetime of 1.91 ns (Figure 2C). To determine the fluorescence lifetime of RGD-Cy5.5 in vivo, the probe was injected SC in healthy nude mice (n = 4). This yielded a fluorescence signal (Figure 2D) with a lifetime of 1.83 ns measured as an average over the selected area in each mouse (Figure 2E). When comparing the intensity (see Figure 2D) and the lifetime (see Figure 2E) images of RGD-Cy5.5, it can be seen that the same fluorescence lifetime can be determined not only in areas with high signal intensities corresponding to high concentration of the injected probe (toward the center of the white circular area) but also in areas where the signal intensities and probe concentration are considerably lower (toward the margin of the white circular area). This indicates that the lifetime calculation is relatively insensitive to the fluorescence intensity, thereby underlining the robustness and reliability of fluorescence lifetime analysis.
Time Domain NIRF Imaging Allows Identification of RGD-Cy5.5-Derived Signals in Tumor-Bearing Mice
To study the distribution of RGD-Cy5.5 in tumor-bearing mice, fluorescence signals before (Figure 3A; n = 10) and after intravenous (IV) application of RGD-Cy5.5 (Figure 3B; n = 6) were analyzed. All mice showed autofluorescence, especially in the area of the stomach and gut (see Figure 3A). After IV injection of RGD-Cy5.5, strong fluorescence intensities over the tumor region and increased intensities over the stomach and gut were detected (see Figure 3B). For a more precise characterization of the detected signals, the TPSFs of the tumor, stomach, and gut regions were investigated (see Figure 3B). Only over the tumor could a monoexponential decay of the histogram and an average lifetime of 1.9 ns be measured. This is analogous to the histogram of RGD-Cy5.5 measured in vitro in PBS-BSA and in vivo after SC injection (see Figure 2, C and F), confirming accumulation of the injected probe within the tumor. In contrast, measurements of the stomach- and gut-derived fluorescence revealed nonmonoexponential decays of the histograms for which longer lifetimes were calculated as poor quality, strongly suggesting non–RGD-Cy5.5-derived fluorescence. As relatively strong fluorescence was measured over the stomach area both before and after probe injection, those unspecific signals were additionally analyzed ex vivo. Fluorescence intensity maps of the opened and empty stomachs of an untreated (Figure 3C) mouse and an RGD-Cy5.5-treated (Figure 3D) mouse and of the corresponding gastric contents (Figure 3, E and F, respectively) illustrate that the highest fluorescence intensity derives from the gastric contents rather than from the stomach itself and seems to be independent of RGD-Cy5.5 treatment. TPSF analysis of fluorescence measured over the open stomachs (see Figure 3D) and gastric contents (see Figure 3F) of an RGD-Cy5.5-treated mouse and an untreated mouse (data not shown) revealed strong nonmonoexponential shapes of the histograms for which no reliable lifetime calculations could be applied.

Temporal point spread function (TPSF) analyses enable identification of RGD-Cy5.5-derived signals in vivo. A and B, Representative fluorescence intensity maps of tumor-bearing mice before and after RGD-Cy5.5 treatment, displayed in normalized counts (NC). A, In untreated mice (n = 10), prominent autofluorescence was measured mainly in the area over the stomach and gut. B, Twenty-four hours after application of 0.5 nmol RGD-Cy5.5 (n = 6), a strong fluorescence over the tumor was detected, as well as an increase in the intensity over the background, including that in the area of the stomach and gut. Corresponding TPSFs (right panel) show a monoexponential decay and a lifetime of 1.9 ns observed only over the tumor. This is comparable to the TPSFs of RGD-Cy5.5 in PBS-BSA and after subcutaneous injection in mice. TPSF analyses of the stomach and gut both show nonmonoexponential decays and longer lifetimes calculated as poor quality. C–F, Ex vivo analysis of the stomach-derived fluorescence displayed in NC. Much lower fluorescence intensity was measured over the opened stomachs of both (C) an untreated (n = 1) and (D) an RGD-Cy5.5-treated mouse (0.5 nmol; n = 2) when compared to the relatively high intensities of the gastric contents of (E) the untreated and (F) the treated mouse, respectively. Corresponding TPSFs for signals over (D) the stomach and (F) gastric contents after RGD-Cy5.5 treatment revealed strong nonmonoexponential shapes.
By applying time domain imaging, we could clearly identify RGD-Cy5.5-derived fluorescence only over the tumor. Moreover, TPSF analyses clearly revealed that the fluorescence detected over stomach and gut is unspecific and independent of the applied probe.
Time Domain NIRF Imaging Reveals Specific Binding of RGD-Cy5.5 to Glioblastoma In Vivo
A critical issue of in vivo NIRF imaging is the application of the optimal amount of the fluorescent probe. The administered dose must be high enough to allow quantitative binding of the probe to the target but low enough to minimize signals owing to nonspecific accumulation of the probe in nontargeted tissues. Thus, the CNR was determined 3 hours after probe injection as a function of probe dose after administering 0.5, 1.5, or 3.0 nmol of RGD-Cy5.5 to tumor-bearing mice (n = 3). In this case, the CNR evaluates the difference between tumor and background as well as the influence of noise and is a frequently reported measure comparing image qualities. 36 The highest CNR was measured after application of 0.5 nmol RGD-Cy5.5 (data not shown). Consequently, this dose was used for the subsequent imaging studies.
Specific binding of different RGD-based probes to glioblastoma in vivo has been studied previously, for example, using an excess of unlabeled peptides before application of the imaging probe.2,32–34 To confirm the specificity of the RGD-Cy5.5 probe used in this study, we performed blocking experiments (n = 4) by injecting an excess of unlabeled RGD peptides before application of RGD-Cy5.5, as previously described.2,32–34 Here imaging and the subsequent lifetime-weighted analysis were performed 24 hours after IV application of the fluorescent probe to ensure that the majority of unbound RGD-Cy5.5 is removed from the circulation and to reduce its contribution to the measured background.
In comparison to untreated mice (n = 10), which show autofluorescence especially in the area of the stomach and the gut (Figure 4A), a strong fluorescence was detected over the tumor region (Figure 4B) 24 hours after injection of 0.5 nmol RGD-Cy5.5 (n = 6). The fluorescence over the tumor was noticeably reduced in all mice (n = 4), which received an excess of unlabeled RGD peptides before application of RGD-Cy5.5 (Figure 4C). The corresponding fluorescence lifetime maps (Figure 4, D–F) illustrate an RGD-Cy5.5-specific lifetime of 1.9 ns only over the tumor, whereas the areas of the stomach and gut show longer lifetimes of approximately 2.0 to 2.1 ns. The remaining background yields inhomogeneous fluorescence with shorter lifetimes around 1.6 to 1.8 ns (see Figure 4, E and F). When gating the fluorescence intensity maps to the RGD-Cy5.5-characteristic lifetime, thereby monitoring only fluorescence in the lifetime range of 1.82 to 1.92 ns (Figure 4, G–I), prominent fluorescence is observed only over the tumor (see Figure 4, H and I). Gating of the fluorescence intensity maps had no considerable effect on the total fluorescence intensity measured over the tumor area. For the example shown in Figure 4, only a slight decrease in tumor intensity after RGD-Cy5.5 treatment from 19 × 104 total counts (see Figure 4E; ungated) to 18 × 104 total counts (see Figure 4H; gated), but no change in the tumor intensity of the blocking experiment before and after gating, was measured (11 × 104 total counts; see Figure 4, F and I). In contrast, signals over the stomach and gut as well as autofluorescence are strongly suppressed after gating, showing that lifetime-weighted analysis of the fluorescence intensity is a very effective method for identification and analysis of probe-derived fluorescence in vivo.
Ex Vivo Scans of Excised Organs Confirm Specific Binding of RGD-Cy5.5 to Glioblastoma
Ex vivo scans of excised organs (n = 7; Figure 5) were performed to validate the in vivo fluorescence measurements. Principally, such measurements allow a more precise analysis of probe distribution because, unlike in the in vivo situation, fluorescence is not absorbed by surrounding tissues. Twenty-four hours after injection of RGD-Cy5.5, remarkably stronger fluorescence was observed over the tumor compared to signals over the other organs (see Figure 5A). In comparison, after blocking of the integrins with unlabeled RGD peptides in vivo, the excised glioblastoma showed noticeably reduced fluorescence intensity (see Figure 5B). Only fluorescence measured over the tumors ex vivo revealed a monoexponential decay of the histogram and a lifetime of 1.9 ns characteristic for RGD-Cy5.5. The lifetime of 1.9 ns was found over the whole tumor region, independent of the local concentration of RGD-Cy5.5. Fluorescence lifetimes could also be determined in areas with low RGD-Cy5.5 signal intensities (see Figure 5, C and D; white circular area). In contrast, fluorescence lifetimes measured in the liver, kidney, and spleen displayed values lower than 1.3 ns (see Figure 5, C and D) with poor quality.
Binding Kinetics of RGD-Cy5.5 to Glioblastoma In Vivo
For analysis of the binding kinetics, RGD-Cy5.5-derived fluorescence was measured in tumor-bearing mice at distinct times after probe injection during a period of 2 to 72 hours (Figure 6). TBRs were calculated from the tumor area and the background area chosen over the left hindlimb. Following probe application, a TBR of 2.4 ± 0.6 (n = 6) and 2.9 ± 0.6 (n = 5) was calculated after 2 and 4 hours, respectively, whereas the best TBR of 3.1 was calculated after 5 hours (3.1 ± 0.9; n = 3), 24 hours (3.1 ± 0.4; n = 6), and 48 hours (3.1 ± 0.8; n = 4). After 72 hours, a TBR of 2.4 ± 0.4 (n = 3) was still detectable (see Figure 6A). The time course of the fluorescence intensity distribution of RGD-Cy5.5 in a representative mouse 2 to 72 hours after probe injection is shown in Figure 6B. When gating the fluorescence intensity maps to the RGD-Cy5.5-characteristic lifetime, thereby monitoring only fluorescence in the lifetime range of 1.82 to 1.92 ns (see Figure 6C), prominent fluorescence was observed only over the tumor, whereas signals over the stomach and gut as well as the overall background were strongly suppressed. Gating had no considerable effect on the total fluorescence intensity measured over the tumor area as total fluorescence intensity counts remained the same before and after gating with exception of the 24-hour time point, where a slight decrease in tumor intensity was measured after gating (from 16 × 104 to 15 × 104 total counts). The corresponding fluorescence lifetime maps of the tumor (see Figure 6D) illustrate an RGD-Cy5.5-specific lifetime of 1.9 ns that remained unchanged from 2 to 72 hours after probe application.
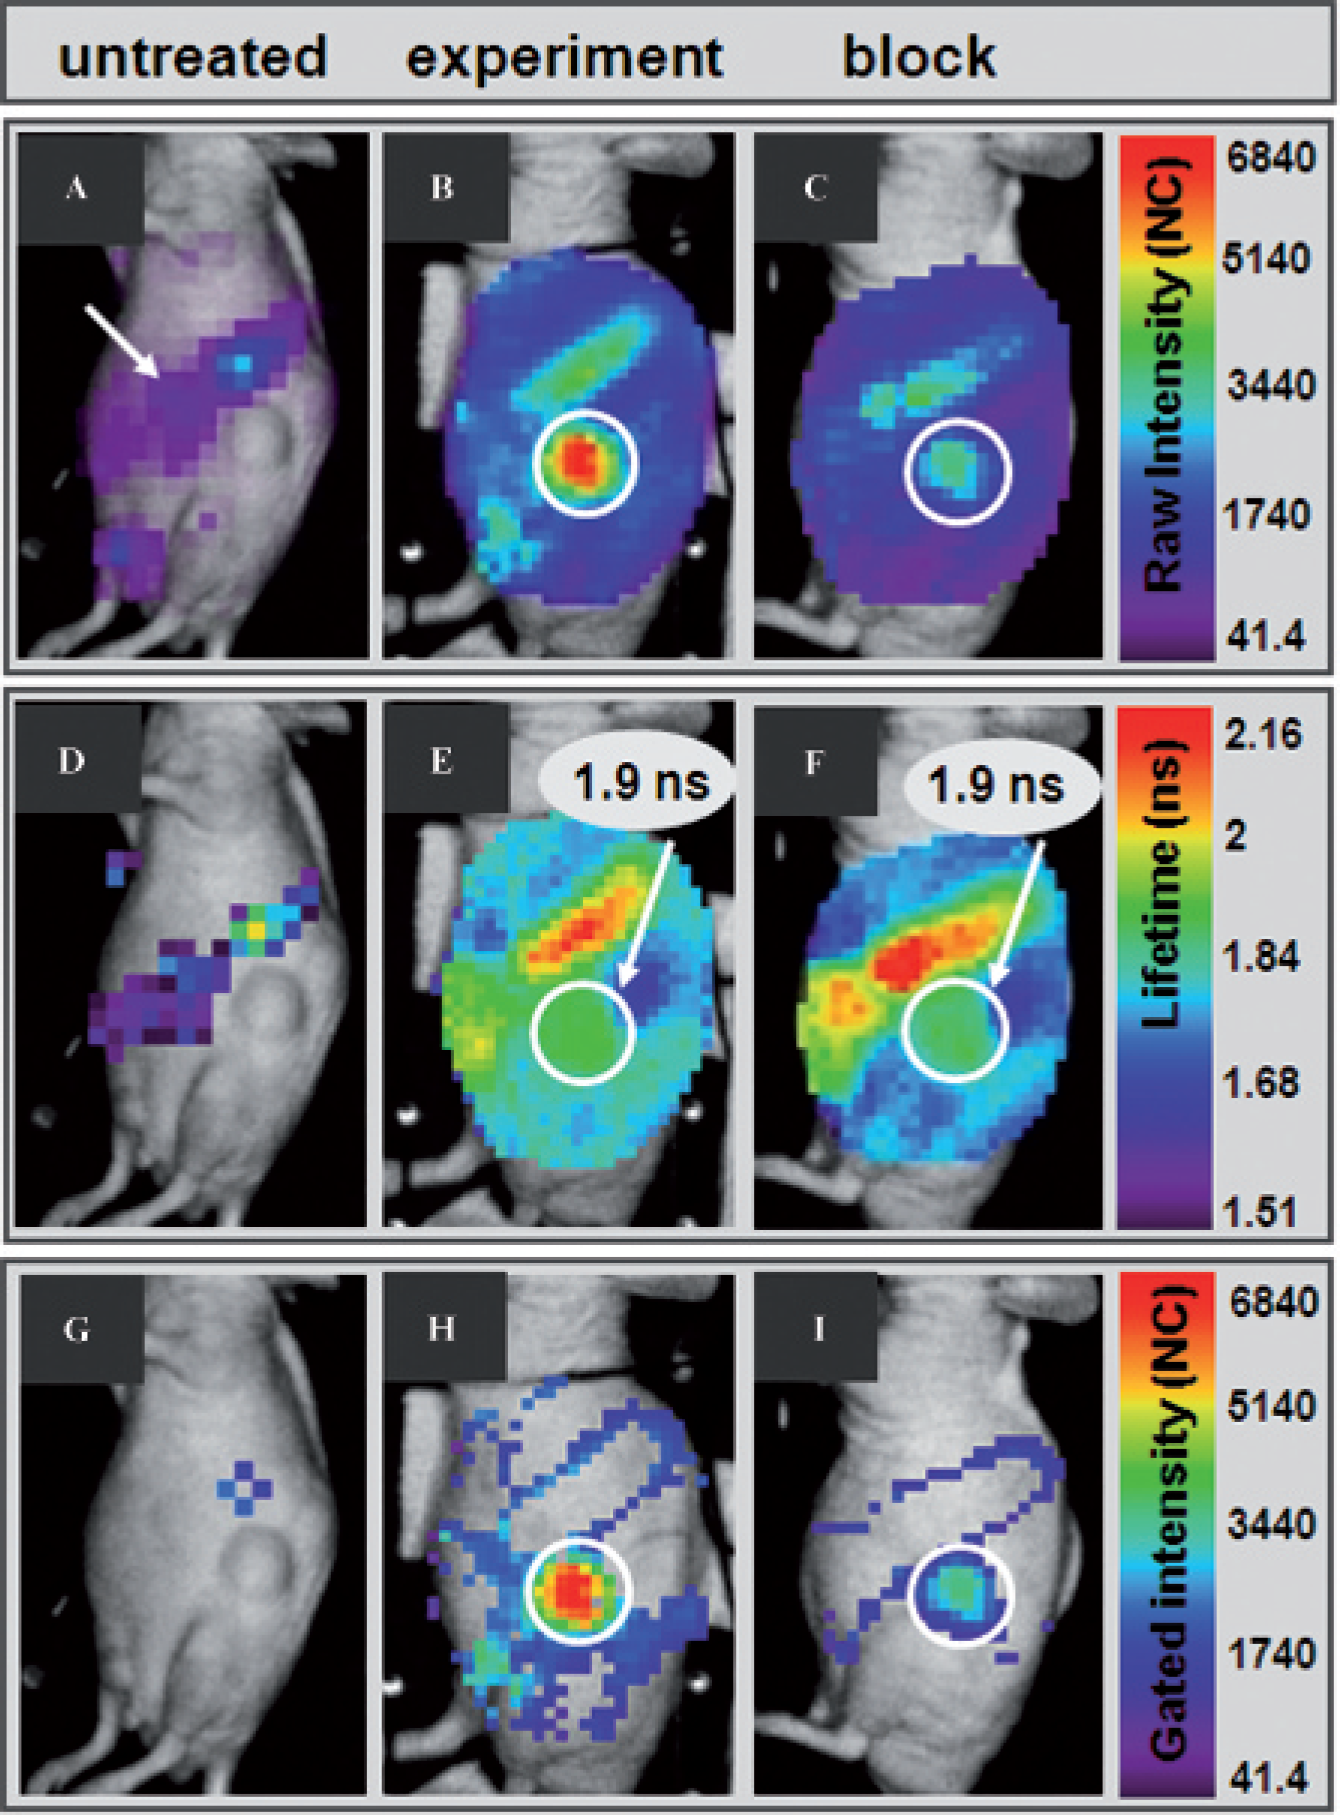
Lifetime-weighted analysis for sensitive and selective detection of RGD-Cy5.5-derived signals in vivo. A, An untreated mouse, revealing autofluorescence mainly over the stomach and gut (white arrow; n = 10). B, Twenty-four hours after intravenous injection of RGD-Cy5.5, a strong signal is observed over the tumor region (white circular area; n = 6). C, Reduced fluorescence intensity (white circular area) over the tumor after blocking of probe binding sites with a 100-fold excess of unlabeled RGD peptides (n = 2). D–F, Corresponding lifetime maps. Note that lifetimes below 1.5 ns are not shown. Lifetimes were calculated as poor quality in untreated mice (D); an average lifetime of 1.9 ns is measured over the tumor (E and F). G–I, Corresponding lifetime-gated fluorescence intensity maps where only signals with a RGD-Cy5.5-characteristic lifetime of 1.82 to 1.92 ns are illustrated. Almost no fluorescence can be observed in the untreated mouse (G), whereas after RGD-Cy5.5 application (H and I), a prominent signal can be detected only over the tumor.

Time domain analysis of biodistribution and binding specificity of RGD-Cy5.5 ex vivo. Selected organs (k = kidney; l = liver; s = spleen) and glioblastoma (t = tumor; white circular areas) of seven mice were scanned after excision at various times after application of RGD-Cy5.5. A and B, Fluorescence intensity maps. Representative fluorescence intensities of organs 24 hours after injection of 0.5 nmol RGD-Cy5.5 (n = 6) (A) and fluorescence intensities 24 hours after in vivo application of a 1,000-fold excess of unlabeled RGD peptides given prior to injection of 0.5 nmol RGD-Cy5.5 (n = 1) (B). The signals over the tumor region are considerably decreased. C and D, Corresponding fluorescence lifetimes. Fluorescent signals over the tumors show lifetimes of 1.9 ns, which are characteristic for RGD-Cy5.5.
Tumor-free control mice (n = 3), which were injected with 0.5 nmol RGD-Cy5.5, showed no specific accumulation of the probe in any organ. Although mice were fed with special chlorophyll-depleted food, fluorescence signals were observed over the gut and stomach (data not shown).
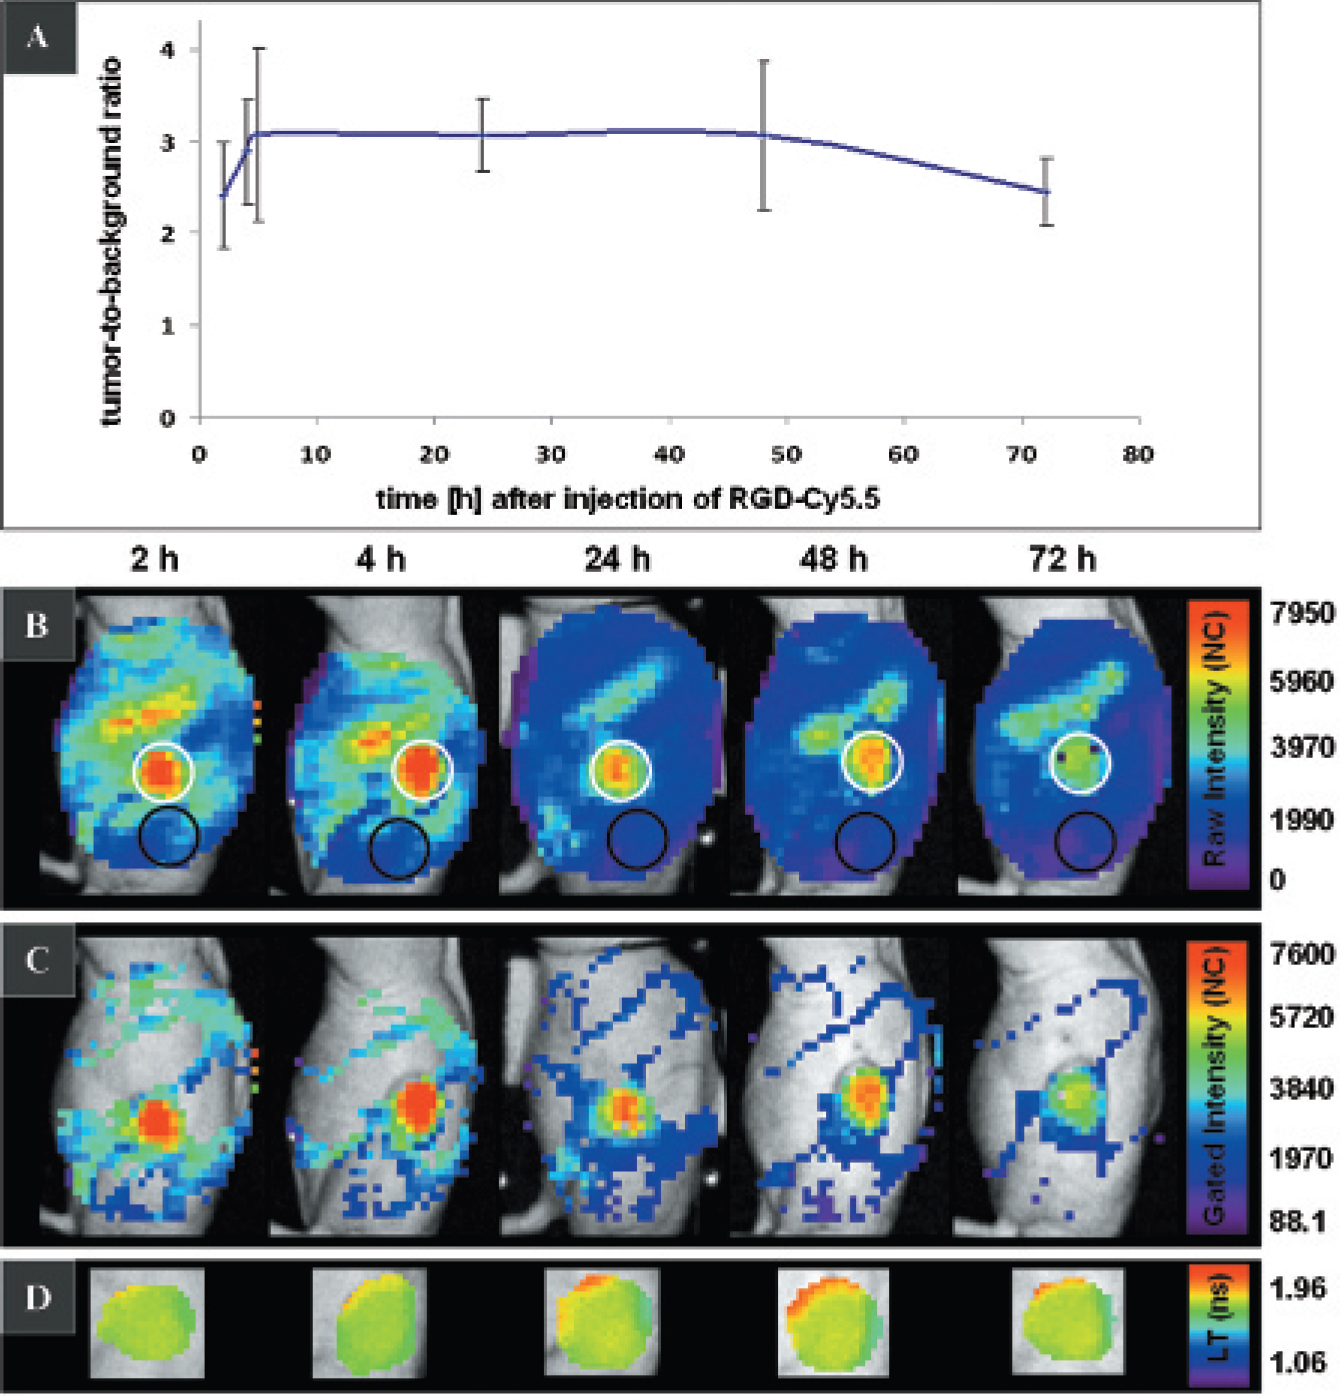
Kinetics of RGD-Cy5.5 in vivo. A, Tumor to background ratios (TBRs) 2 to 72 hours after injection of 0.5 nmol RGD-Cy5.5 (n = 6). Best TBRs were calculated 5, 24, and 48 hours after probe application. The bars indicate standard deviations. B, Fluorescence intensities in a representative tumor-bearing mouse after injection of 0.5 nmol RGD-Cy5.5. The tumor region is indicated with white circles. The areas used for background signal calculations are marked with black circles. C, Corresponding fluorescence intensity maps gated to the RGD-Cy5.5-characteristic lifetime of 1.82 to 1.92 ns. Prominent signals can be detected only over the tumor. D, Corresponding lifetime maps of the tumor area (see white circle in B) showing a constant lifetime of 1.9 ns over time.
Discussion
For tumor imaging, avβ3 integrins represent excellent target structures as they are upregulated in many tumor types, including glioblastoma, as well as in tumor blood vessels. 22 Specific binding of cyclic RGD peptides to αvβ3 integrins and their use for tumor imaging are well described by different groups.17,18,32–34 Furthermore, αvβ3 integrins are found in angiogenesis, including during the process of inflammation and specifically on hematopoietic cells, such as lymphocytes, macrophages, and platelets. As inflammation is associated with tumor development, distinguishing tumor cells and inflammatory processes in the tumor is not feasible with the use of RGD-optical probes. 37
In this study, by applying lifetime-gated NIRF imaging, we optimized the specificity and thus the overall detection sensitivity of RGD-Cy5.5-derived signals to visualize αvβ3 integrins expressing glioblastoma xenografts in nude mice. The cyclic RGD pentapetide was chosen for this study owing to its high activity (1,000 times higher than the linear GRGDPS) for integrin αvβ3.
22
To circumvent any interaction of the fluorescent label with the integrin, we introduced an aminohexanoic acid spacer between the RGDfK peptide and Cy5.5. The
In this study, we characterized RGD-Cy5.5 as a strongly emissive and stable optical probe. Especially attractive is the fact that for our probe, conjugation of Cy5.5 to the RGD does not decrease the dye's fluorescence quantum yield but even yields a small enhancement. This is contrary to the majority of cases, where attachment of a dye to a biomolecule results in a decrease in dye fluorescence quantum yield even for very low labeling densities, for example, as observed for Cy5.5 and Cy5 bound to IgG. 24 The observed increase can suggest a slightly reduced flexibility of the fluorophore in the RGD conjugate. The BSA-induced enhancement in the fluorescence quantum yield of both Cy5.5 and RGD-Cy5.5, which is accompanied by an increase in fluorescence lifetime, can be ascribed to different effects. This includes electrostatic and hydrophobic interactions between the fluorophore and the protein, leading to a rigidification of the flexible dye molecules, prevention of close contact between the fluorophore and water molecules, and a reduction in the polarity of the fluorophore's local environment. Such effects have been observed for other cyanine dyes as well.8,21,38 The comparatively high fluorescence quantum yield of RGD-Cy5.5 in conjunction with the reportedly high molar absorption coefficient of Cy5.5, which also seems to be barely affected on RGD conjugation, as suggested by the identical absorption spectra of free and conjugated Cy5.5, is the prerequisite for high fluorescence signals from the probe site. 7
The very similar fluorescence lifetimes of RGD-Cy5.5 in PBS-BSA, and after subcutaneous injection, but not of RGD-Cy5.5 in PBS alone, that match the probe's lifetime in the tumor region seem to underline the importance of protein-containing solutions as a model system for the assessment of the spectroscopic properties of fluorescent probes prior to in vivo measurements at the binding site. However, to derive the general suitability of this model system for the assessment of the in vivo spectroscopic features of newly evolving fluorophores and probes, more experiments with different fluorophores and probes are required as it is possible that fluorescence-affecting parameters such as pH, tissue density, and the concentration of certain ions can vary among different tissues. 10 In this context, spectroscopic characterization in model systems that contain proteins of diverse nature and charge, compared to a relatively “neutral” protein such as BSA, could lead to a more accurate interpretation of the in vivo spectroscopic features of fluorescent probes.
Comparative binding studies blocking integrin binding sites with unlabeled RGD peptides confirmed specific binding of RGD-Cy5.5 to the tumor site. These results are in accordance with previous reports by Chen and colleagues demonstrating specific targeting of U87MG cells by fluorescent RGDyK peptides in vivo using a continuous wave optical imaging system.32,34,39 However, by applying time domain imaging, we could characterize fluorescence signals in vivo in more detail as time-gated emission analysis allowed a more sensitive identification of RGD-Cy5.5-derived signals and its separation from unspecific background.
The remaining intratumoral fluorescence observed in our study, despite blocking, was also reported by other groups 32 and could be due to target-independent enrichment of the probe in the highly vascularized tumors, whose vessels are more permeable than normal vessels. The slight increase in fluorescence intensities observed over the stomach and gut after application of RGD-Cy5.5 compared to untreated mice may be due to free circulating unbound probe and/or scattered fluorescence photons deriving from the tumor-bound RGD-Cy5.5 nearby.
With the aid of time-gated fluorescence measurements, analyzing only the fluorescence intensity within a narrow time window comprising the probe's lifetime, we could almost completely suppress unspecific fluorescence in mice. This leads to an increase in tumor to background contrast and thus to an improved detection sensitivity of probe-derived signals when compared to conventionally used imaging in the intensity domain. This highlights the correspondingly high sensitivity of fluorescence lifetime imaging, especially as the fluorescence lifetime could be reliably calculated even for areas where only weak signals were measurable in the intensity domain. The potential of this technique can be further enhanced using fluorescent reporters with longer emission lifetimes, such as quantum dots (five to hundreds of nanoseconds), thereby allowing a better discrimination of probe-derived fluorescence from autofluorescence via time-gated measurements. 7 Fluorescent reporters that display an increase in lifetime only when located in the tumor microenvironment might be attractive tools. Whether this could be achieved with the aid of, for example, targeted functional probes that are sensitive to, for example, proteolytic cleavage or pH changes in the tumor remains to be shown.
Conclusion
The characterization of the spectroscopic properties of optical probes under application-relevant conditions represents a mandatory prerequisite for a reliable time-gated analysis in vivo. When applied to animal tumor models, time-resolved NIRF imaging provides improved sensitivity compared to conventional NIRF imaging performed only in the intensity domain. The high sensitivity of the lifetime-weighted quantification of fluorescence intensity can pave the road for the detection of metastases, for example. In the future, time-resolved NIRF imaging might also be of considerable use to evaluate and optimize the concept of anticancer therapies and diagnostic tools via αvβ3 integrin antagonists.
Footnotes
Acknowledgments
We would like to acknowledge Sarah Greco, Roswitha Streich, and Johanna Widera for excellent technical assistance. We also thank Ariane Söling for kindly providing the U87MG cells.
Financial disclosure of authors: This work was supported by a grant from the Deutsche Forschungsgemeinschaft, Sonderforschungsbereich 416, to F. Alves and L.-F. Tietze.
Financial disclosure of reviewers: None reported.