
Abstract
Molecular imaging (MI) with ultrasonography relies on microbubble contrast agents (MCAs) adhering to a ligand-specific target for applications such as characterizing tumor angiogenesis. It is projected that ultrasonic (US) MI can provide information about tumor therapeutic response before the detection of phenotypic changes. One of the limitations of preclinical US MI is that it lacks a comprehensive field of view. We attempted to improve targeted MCA visualization and quantification by performing three-dimensional (3D) MI of tumors expressing αvβ3 integrin. Volumetric acquisitions were obtained with a Siemens Sequoia system in cadence pulse sequencing mode by mechanically stepping the transducer elevationally across the tumor in 800-micron increments. MI was performed on rat fibrosarcoma tumors (n = 8) of similar sizes using MCAs conjugated with a cyclic RGD peptide targeted to αvβ3 integrin. US MI and immunohistochemical analyses show high microbubble targeting variability, suggesting that individual two-dimensional (2D) acquisitions risk misrepresenting more complex heterogeneous tissues. In 2D serial studies, where it may be challenging to image the same plane repeatedly, misalignments as small as 800 microns can introduce substantial error. 3D MI, including volumetric analysis of inter- and intra-animal targeting, provides a thorough way of characterizing angiogenesis and will be a more robust assessment technique for the future of MI.
MOLECULAR IMAGING (MI) allows for the detection of specific cellular markers expressed by diseased tissues.1–4 The principle behind ultrasonic MI is to introduce acoustically active bubbles fitted with a high-affinity targeting ligand into a subject's bloodstream and allow them to circulate systemically.2,4–6 Integrin or other ligand expression on the diseased tissue allows the circulating targeted microbubble contrast agents (MCAs) to adhere to the endothelial surfaces within the diseased tissue, thus facilitating detection with ultrasonography.3,5,6 Once bound to their targets, these MCAs enhance the acoustic signal from pathologic tissue that might otherwise be difficult to distinguish from normal tissues with conventional B-mode imaging. 1 In recent years, targeted agents have been successfully used in a large range of applications, including, but not limited to, in vivo imaging of tumor angiogenesis, dysfunctional endothelium, inflammation, and thrombus, as well as the diagnosis of myocarditis and the evaluation of myocardial infarction.2,7–10
Contrast agents typically used in ultrasonic MI studies include perfluorocarbon emulsion nanoparticles, 11 echogenic liposomes,6,12,13 and MCAs,1,14,15 with the most commonly used agent being the MCA. MCAs are both highly echogenic and nonlinear in their response to ultrasonic stimulation.16,17 This allows various pulsing and signal processing strategies, such as (but not limited to) the cadence pulse sequencing (CPS) mode used by Siemens, to detect the backscattered signal from contrast agents with high sensitivity and display it separately from tissue. CPS is a nondestructive contrast-specific imaging mode that has been used for both perfusion and MI studies.14,18–20
Given that MI typically provides information prior to the appearance of gross phenotypic changes, it is proposed that ultrasonic MI can facilitate early assessment of disease progression or response to therapy.1,3,21,22 Currently, MI is most commonly implemented in preclinical and clinical settings with nuclear and optical imaging techniques.1,21,22 However, owing to ultrasonography's advantage of being portable, safe, real time, and relatively inexpensive, there is significant merit in the advancement of traditional two-dimensional (2D) ultrasonic MI.
One of the biggest limitations with ultrasound imaging, compared to other imaging modalities, is that the field of view is less comprehensive. 23 Recently, three-dimensional (3D) ultrasound imaging has become available, largely for cardiac and obstetric applications24,25 and more recently for contrast-enhanced perfusion applications.26–29 However, MI with ultrasonography has traditionally been used only with 2D image acquisition owing to the widespread use of one-dimensional array transducers and the lack of commercially available ultrasound systems with high-resolution contrast-specific imaging modes implemented on 3D probes.
Our hypothesis is that the application of MI in 3D space will provide a more robust evaluation of disease progression than current methods. In this article, we demonstrate the application and potential of 3D ultrasonic MI of angiogenesis in vivo using a clinical ultrasound scanner with a custom mechanically scanned transducer system. Microbubble targeted images were fused with B-mode images in 3D space to allow for characterization and localization of αvβ3 integrin molecular marker expression with respect to tumor volume. Finally, a postmortem immunohistochemical analysis performed on multiple tissue slices was compared to the ultrasonic data.
Materials and Methods
Microbubble Contrast Agents
MCAs designed to target αvβ3 integrins were created with a 9:0.5:0.5 molar ratio of 1,2 distearoyl-sn-glycero-3-phosphocholine (DSPC) (Avanti Polar Lipids, Alabaster, AL), 1,2-distearoyl-sn-glycero-3-phosphoethanolmine-N–[methoxy-(polyethylene glycol)-2000] (DSPE-PEG2000) (Avanti Polar Lipids), and DSPE-PEG2000 cross-linked to a cyclic RGD peptide (Cyclo-Arg-Ala-Asp-D-Tyr-Cys) (Peptides International, Louisville, KY) in a 90 mL solution of phosphate-buffered saline (PBS) (Fisher Scientific, Pittsburgh, PA). The cyclic RGD peptide has been previously shown to target αvβ3 integrin–expressing vasculature, which is characteristic of angiogenic tumors.5,18
MCAs with a large, preferentially selected mean diameter (3.3 ± 1.9 μm) have been shown to produce greater backscatter intensities18,30,31 in MI studies compared to vial-shaken, unsorted polydisperse distributions. Therefore, all MCAs in this study were sorted via the method first introduced by Feshitan and colleagues. 32 Briefly, using a sonic dismembrator (Model 500, Fisher Scientific, Hampton, NH), MCAs were generated via acoustic emulsification and our desired MCA size distribution was isolated by multiple centrifugation steps.
Initial concentrations and size distributions of MCA solutions were determined using an Accusizer 780A (Particle Sizing Systems, Santa Barbara, CA). Using these measurements, the MCAs were diluted with PBS to a concentration of 8.0 × 10⁸ bubbles/mL prior to intravenous administration.
Animal Preparation and Contrast Administration
Fischer 344 rats (Charles River Laboratories, Wilmington, MA) were used for MI experiments using a fibrosarcoma tumor model. All animal studies were performed in accordance with protocols approved by the University of North Carolina School of Medicine's Institutional Animal Care and Use Committee.
During MI studies, animals were anesthetized with 2.5% inhaled isoflurane anesthesia mixed with oxygen and their body temperature was maintained through the use of a temperature-controlled heating pad. The area to be imaged was shaved, further depilated using a chemical hair remover, and then coupled to the ultrasound transducer using a water-based acoustic coupling gel as previously described. 18
A 24-gauge catheter was inserted into the tail vein of the animal for the administration of MCAs. In all experiments, bolus MCA injections of 100 μL were delivered followed by an immediate flush of at least 200 μL sterile saline to clear any remaining MCAs from the catheter. Animals received less than 1.5 mL of total fluid volume through the tail vein within any 24-hour period.
Tumor Models
Tumor models were established from propagated tumor tissue provided by the Dewhirst Laboratory at Duke University. 33 Prior to implantation, rats were anesthetized using isoflurane and their left flank was shaved and disinfected. A 2 mm incision was made above the quadriceps muscle and an ≈1 mm3 piece of tumor tissue was placed subcutaneously. The incision was closed with a single suture. Imaging was performed on tumors after their longest axis had grown to approximately 1 cm. Eight rats were imaged for this study.
3D Imaging Apparatus
A Siemens imaging system (Acuson Sequoia 512, Mountain View, CA) was used to acquire all ultrasound images in this study. B-mode images were collected at 15 MHz using a 15L8 linear array transducer to provide images for selecting the region of interest (ROI) in each imaging plane. Targeted MCAs were imaged in CPS mode, a nondestructive contrast-specific imaging technique operating at 7 MHz (mechanical index = 0.18, CPS gain = —3 dB).
To create volumetric 3D images, the transducer was stepped elevationally using a linear motion stage (Model UTS150PP, Newport, Irvine, CA) as previously described. 20 A custom LabView (National Instruments, Austin, TX) program was interfaced to both the motion stage and the ultrasound system, enabling the control of step sizes and triggering the capture of ultrasound video data at every discrete step. Both B-mode and contrast images were saved in Joint Photographic Experts Group (JPEG) compressed Digital Imaging and Communications in Medicine (DICOM) file format and later analyzed and registered offline using custom Matlab (The Mathworks, Natick, MA) scripts and functions.
Image Acquisition
Prior to imaging angiogenic tumors with targeted contrast agents, background intensity data measured in decibels was taken in both B-mode and CPS mode to optimize elevational scan length and to ensure the absence of bubbles within the coupling gel. After the initial background scans were performed, the system was paused and a 100 μL bolus injection of contrast agents was administered through the catheter followed by a 200 μL flush with sterile saline. Twenty minutes was determined to be an adequate length of time for this volume of freely circulating contrast agents to be cleared from an animal's system. This was done by examining perfusion washout curves for animals with similar weights and given the same dose of MCAs (data not shown). After the MCAs had cleared, one image frame of video data was collected every 800 μm as the transducer was stepped across the tumor. The video intensity (decibel units) of targeted agents retained in vivo was observed over 30 seconds using CPS at a mechanical index of 0.18, and no loss in signal intensity was observed, indicating that our imaging parameters were nondestructive (data not shown). The adherent bubbles were then destroyed using a high-energy pulse sequence (mechanical index = 1.9) scanned elevationally across the tumor. The tumor was imaged again every 800 μm with the initial CPS parameters to collect background image intensity data (decibel units) at each location previously imaged with adherent MCAs. This served two purposes: to ensure that no freely flowing contrast agents were present and to determine the background signal for quantification of the bound contrast agents. Within each data set, the gain and transmit power were kept constant. ROIs were drawn within the perimeter of the tumor boundaries in each image plane using B-mode imaging data collected prior to contrast administration to maintain consistency. With custom Matlab scripts, the difference in mean pixel intensity between the predestruction pulse image (the image with adherent MCAs) and the background image was determined for each image plane as a measure of αvβ3 targeting, similar to previous MI studies with ultrasonography.6,18,34 The pixel intensities of images acquired of adherent MCAs were assumed to be proportional to the degree of molecular marker expression.
Multislice Immunohistochemical Analysis
Tissue Fixation, Processing, Embedding, and Sectioning
After ultrasonic MI was performed, the fibrosarcoma tumors were extracted for immunohistochemical analysis staining for neovessel angiogenesis using a CD31 antibody as previously discussed.8,35 Before extraction, the tumor was spot-cauterized on the dorsal and left tumor surfaces along the anterior to posterior axis (elevational direction) (Figure 1). These cauterized marks were used to preserve the spatial orientation of the tumor after it was removed, such that the tissue face would be perpendicular to the elevational scanning direction (posterior to anterior) of the ultrasound transducer. Thus, when processed, the histology slides would approximately correspond to the image displayed with the ultrasound system. After extraction, the tumor was segmented into multiple 2 to 3 mm tissue blocks. Finally, each segment was cauterized at a central dorsal position of the tissue face to preserve the orientation of the tumor in later processing steps (see Figure 1).
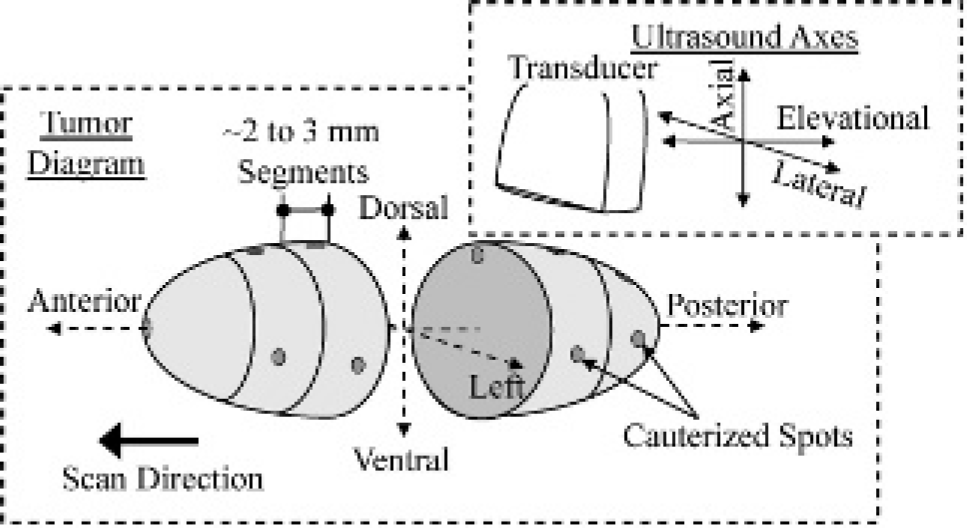
Three-dimensional tumor diagram illustrating the anatomic terminology and directional orientation with respect to the transducer for multislice histologic analyses.
Tumor slices were fixed overnight with 4% paraformaldehyde (Electron Microscopy Sciences, Hatfield, PA) in phosphate-buffered saline (PBS). Fixed tissue was washed for 2 days in PBS prior to being processed into paraffin. Tumor slices were embedded in paraffin blocks while preserving the orientation of the ultrasound scan using the cauterized marks. Lastly, tissue sections were mounted on charged slides for histology and immunohistochemistry processing.
Histology and Immunohistochemistry
Standard methods for histology and immunohistochemistry were used. Briefly, tissue was deparaffinized through toluene and rehydrated through a graded series of ethanol and PBS. Nascent vasculature was localized using an antiserum against Pecam-1 (CD31, sc-1506) raised in goat (Santa Cruz Biotechnology, Santa Cruz, CA) diluted 1:200 in normal rabbit serum to a final concentration of 1 μg/mL. The Pecam-1 IgG was detected using a biotinylated rabbit antigoat antiserum (BA-5000) (Vector Laboratories, Burlingame, CA) diluted 1:300 in normal rabbit serum to a final concentration of 5 μg/mL. The antigoat IgG was localized using streptavidin-peroxidase and 3,3-diaminobenzidine tetrahydrochloride (DAB) (Zymed Laboratories, San Francisco, CA) according to the manufacturer's directions. Antibody incubations were for 1 hour at room temperature.
Photomicrographs were captured using a BX51 microscope (Olympus, Center Valley, PA) equipped with a motorized 2D stage driven by a ProScanII controller (Prior Scientific, Rockland, MA). Individual fields were captured at 100× magnification with a DP72 digital camera (Olympus) as 1,360 by 1,024 pixel TIF files and were assembled into a final image using version 7.7.0.0 of MetaMorph Basic software (Molecular Devices, Downingtown, PA). The original photomicrographs were captured at a resolution of 1.02 μm per pixel. The final photomicrograph montages used for analysis were compressed using the JPEG algorithm to reduce their file size and to facilitate their analysis with Matlab software.
Neovascular Quantification
Owing to the extremely large file sizes (≈250 MB), the high-resolution images of the stained tissues were resized to 20% of the original image size. Subsequently, the images were imported into a custom Matlab program for counting neovasculature. First, a user-defined ROI was drawn within the perimeter of the tumor similar to the ultrasonic MI analysis. At random, 10 nonoverlapping 1 mm × 1 mm image blocks within the ROI were displayed. Lastly, the stained blood vessels were manually counted in each image. Means and standard deviations corresponding to the number of new blood vessels per unit area were evaluated and compared within each tumor segment as well as between the multiple sections acquired across the tumor.
Data and Statistical Analysis
The amount of microbubble targeting in each 2D image was quantified as the difference between the mean pixel intensity within the user-defined ROI for a given slice with adherent targeted microbubbles and the mean pixel intensity at the same location after the bubbles were destroyed. The spread or the range in the data was calculated as the difference between the image with the highest mean targeting intensity value minus the image with the smallest mean targeting intensity.
Volumetric targeting data were assessed in several different ways. To compare the differences in microbubble targeting between different animals, the mean of the pixel intensity within all ROIs in a tumor was computed and displayed as a box plot for each animal. To compare different regions within individual tumors, the mean of the pixel intensities within each ROIs in a tumor was computed and displayed as a bar plot. Finally, the variance of the volumetric targeting data for the different animals was taken to be the mean of the squared differences between each individual image's mean and the overall volumetric mean. All pixel intensity values are quoted as the decibel units output by the log-compressed video data from the ultrasound system.
Significance between distributions was analyzed in Excel using a two-sided Student t-test with equal variance. Significance between two different distributions was considered at a value of p < .05.
Results
Intratumor Analysis
3D MI analyses of eight different animals demonstrated large variations in slice-to-slice mean pixel intensities across different animals' tumors (animal 6: mean = 0.07, spread = 0.04; animal 5: mean = 0.78, spread = 0.68) (Figure 2). To further assess intratumor variation, mean pixel intensity, normalized to the 2D acquisition with the most MCA targeting, was plotted as a function of distance relative to the tumor centers for two of the eight most dissimilar animals imaged (animal 5 = A, animal 3 = B) (Figure 3) to illustrate how microbubble targeting varied spatially between the two. Mean video intensity (normalized to both tumors' maximum intensity) and standard deviations were 0.77 ± 0.18 and 0.71 ± 0.10, respectively.

Box plots of the mean pixel intensity distributions for each of the eight animals imaged. All values were normalized to the 2D acquisition with the most microbubble contrast agent targeting. The “x” symbol represents imaging slices, which were outliers from the distribution.

Mean pixel intensity per 2D slice acquisition demonstrating the spatial microbubble contrast agent (MCA) targeting variability within two different animals. All values were normalized to the 2D acquisition with the most MCAs targeting in each of the two animals. A corresponds to animal 5 and B corresponds to animal 3.
In addition to slice-to-slice analysis, the degree to which a single imaging plane could misrepresent the entire volume of tissue was determined by calculating the discrepancy between the mean targeted intensity value at the center of the tumor and the mean intensity across all slices in the tumor. This discrepancy was plotted as a percent difference (Figure 4) with respect to the mean targeted intensity value at the center of the tumor. Our data indicate that volumetric microbubble targeting could have been underestimated by 28% or overestimated by as much as 16% if only the center slice was acquired.
Percent difference between mean pixel intensity at the center of tumor and mean pixel intensity for all 2D slices of the same tumor relative to the center value.
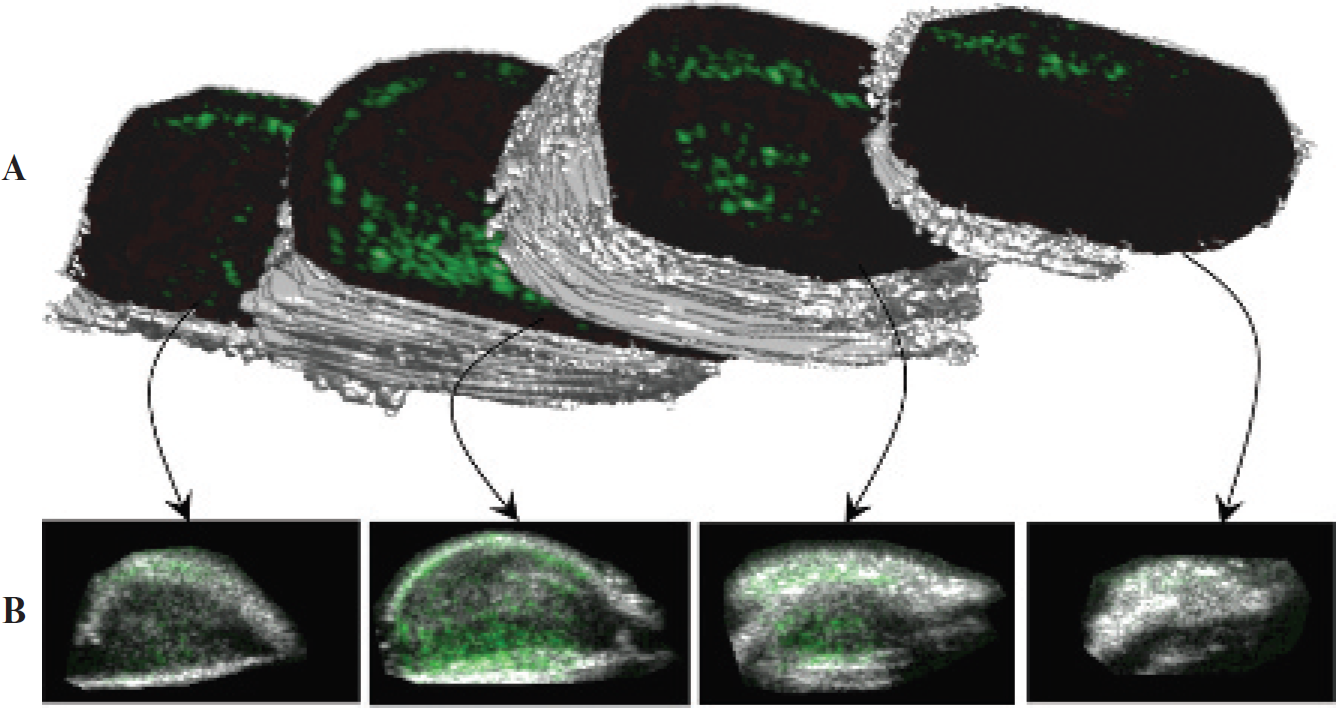
Lastly, an example 3D rendering of a heterogeneous tumor (animal 5) qualitatively illustrates the spatial variation of angiogenic marker expression (Figure 5). Figure 5A shows 3D isosurfaces of the tumor divided at various locations to illustrate the targeting variation in each user-defined region. Figure 5B shows each associated targeted acquisition overlaid onto the corresponding B-mode image (traditional 2D representations).
A 3D rendering of an angiogenic tumor with targeted contrast overlaid on B-mode images. This image was created in Matlab by forming an isosurface from the user-defined regions of interest in each 2D acquisition plane. Reproduced with permission from Gessner R and Dayton PA.
4
Intertumor Analysis
The distributions of intensity values for all 2D acquisitions across each animal are compared to each other in the form of box plots normalized to the acquisition with the most microbubble targeting (see Figure 2). The variance of the mean pixel intensity for the most heterogeneous (animal 5) and least heterogeneous (animal 6) tumors was 0.032 and 0.0001, respectively.
Animals 2 and 7 had video intensities that were similar at the center location of each respective tumor (0.10 in animal 2 vs 0.09 in animal 7). It is important to note that although the mean targeted intensity values were similar at the center position, the ranges in targeting between the two different animals were significantly different (p < .05).
Approximating Error in Analogous 2D Study
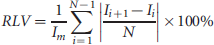
In this study, we estimated the magnitude of potential misalignment error in applications where the transducer is moved from a fixed clamp and repositioned. The potential error was obtained by calculating the absolute value of the difference in mean targeting between all adjacent imaging planes relative to the volumetric mean of the tumor, as indicated by the following equation:
Relative local variability (RLV), or average slice-to-slice variation, expressed as a percentage of the volumetric mean microbubble contrast agent targeting. Error bars are standard deviations of the adjacent slice relative differences.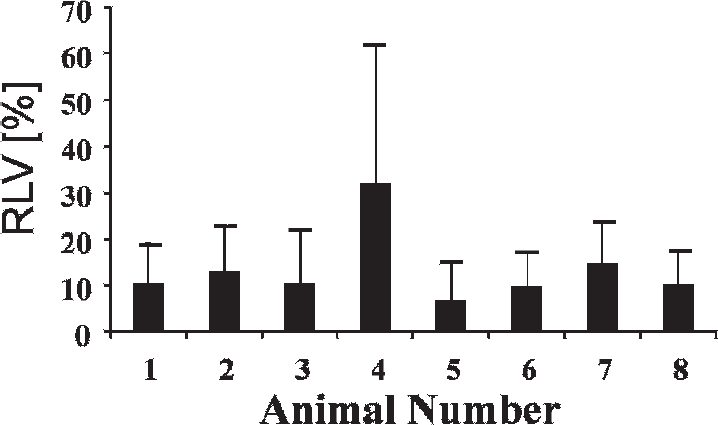
Multislice Immunohistochemical Analysis
CD31 staining was performed on three different fibrosar-comas to corroborate the conclusion drawn from the ultrasonic MI data that tumor tissue is heterogeneous. The number of CD31-stained blood vessels per unit area for each segment was compared to the ultrasonic data (Table 1). All histologic data were normalized to the segment that contained the largest mean blood vessel density. All ultrasonic MI data were normalized to the mean pixel intensity of the acquisition with the most MCA targeting. The data show that there is large variation in neovasculature in intra- and intertumor analyses.
Immunohistochemistry data demonstrate that there is a large variation in the quantity of neovasculature and that it roughly correlates to the amount of microbubble targeting in the ultrasonic MI data (Figure 7). Data show that the normalized mean pixel intensity of the ultrasound acquisitions has a trend similar to that of the histologic analysis. Furthermore, targeted MCA overlays on B-mode images illustrate the variability in microbubble targeting to αvβ3 integrin along with representative images of the stained histology. Exact alignment and orientation between the tumor segments and the ultrasonic MI data were unattainable owing to the difficulty of perfectly registering histology and image data; thus, a more rigorous and quantitative correlation between ultrasonography and histology was not attempted and was considered to be outside the scope of this project.
Upper left panel: Distributions of new blood vessel density at each tumor segment in boxplot format. The data were normalized to the slice B mean so that the scales were similar to the corresponding ultrasonic molecular imaging (MI) analysis. The approximate elevational distance from the tumor center is indicated below the distribution. Upper right panel: Normalized mean pixel intensity per 2D slice acquisition for ultrasonic MI analysis. Data were normalized to the 2D acquisition with the most targeting. Bottom panel: The top images are targeted overlays on B-mode images illustrating microbubble targeting to αvβ3. The bottom images are representative of the stained histology samples at the approximate locations specified. Dark red color indicates neovasculature stained for CD31.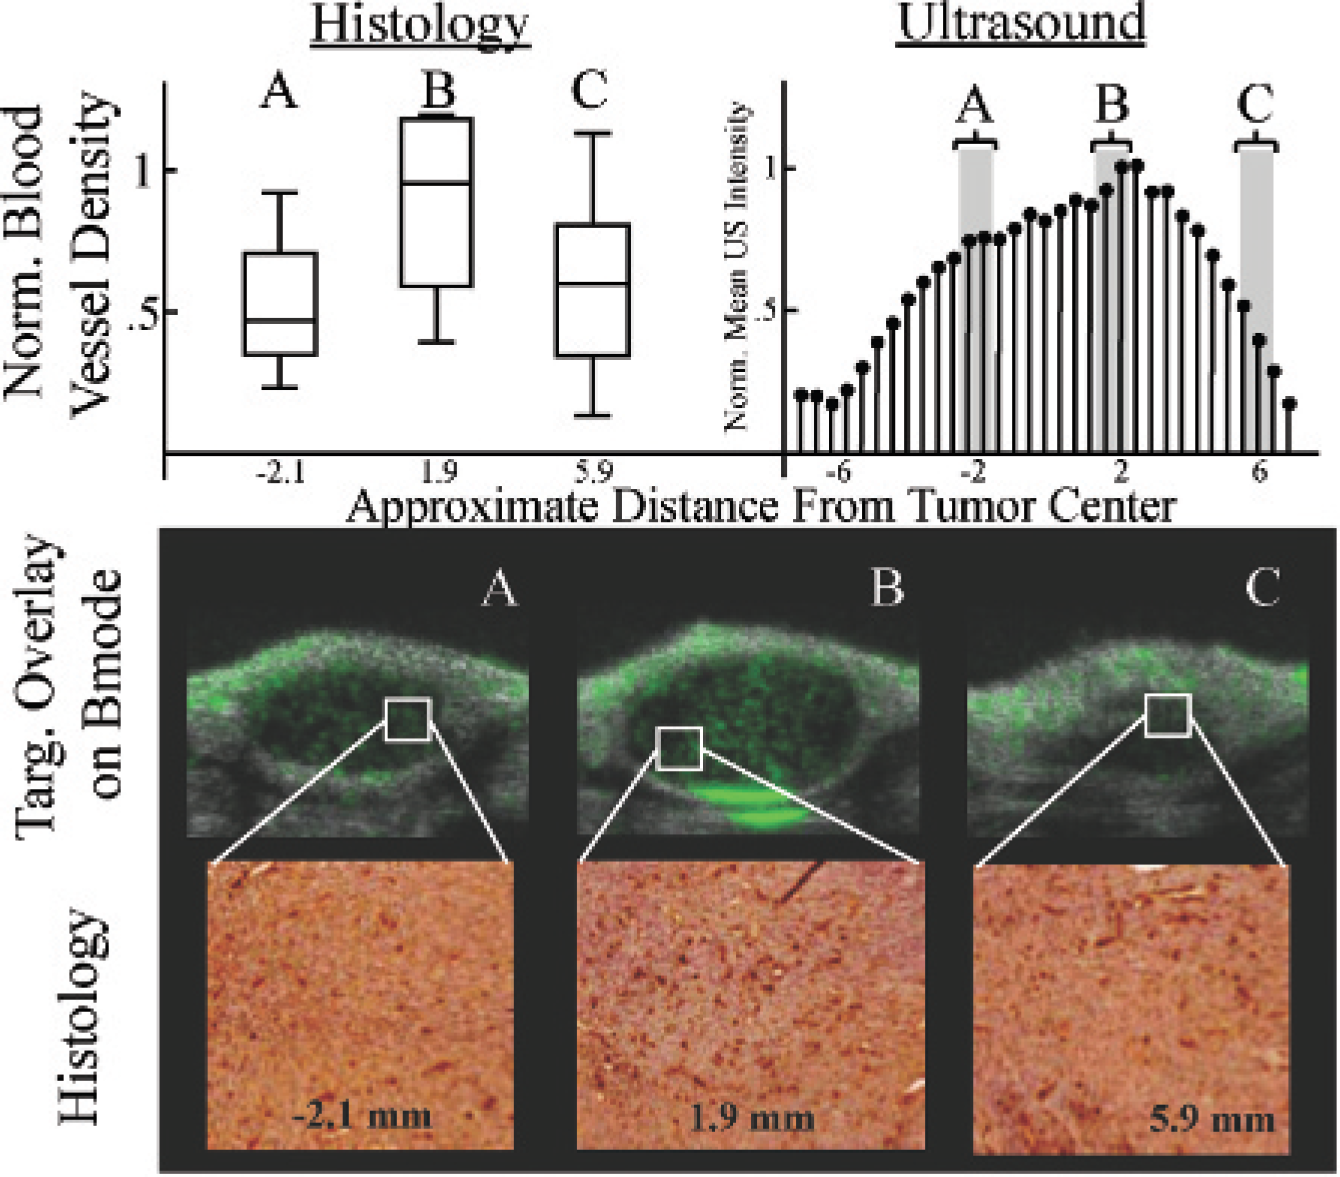
Discussion
Until recently, traditional B-mode or nontargeted contrast imaging has been predominantly 2D. However, this has not been a limiting factor for applications in which the user is imaging anatomic structures because adjusting the transducer manually can vary the image plane. Given that MI with ultrasonography typically uses a more precise subtraction method for quantifying molecular marker expression, image acquisitions are obtained by placing the transducer in a fixed clamp on an anesthetized animal.8,9,14,15,34,36 For over a decade, this 2D MI method has provided valuable insight into the detection of biomolecular markers for numerous applications previously mentioned. In this article, we illustrate the advantages of MI in 3D.
Data illustrated that 3D ultrasonic MI presents a more robust assessment of molecular marker expression throughout the tumors than standard 2D ultrasonography. In the case of nonhomogeneous tumors (which is common 37 ), it is easy to incorrectly assess the tumor characteristics based on only a single cross-sectional ultrasound slice. An example of 3D tumor rendering (see Figure 5) illustrated this point through visualization of four different targeted imaging planes with unique spatial distributions of αvβ3 integrin expression. In a traditional 2D analysis, it is possible that any one of these acquisitions would be used to assess the angiogenesis throughout the entire tumor. However, it is evident that the mean MCA targeting in that single plane is not the same in all areas of the tumor, which was confirmed by the relatively large variations in targeting across the tumors of each of the eight different animals. The importance of a 3D targeted imaging approach was further corroborated by the analysis of the percent difference between targeting at the center of the tumor relative to the overall mean targeting throughout the tumor. This analysis, which approximates the error between the mean targeting of a 2D and a 3D MI study, indicates that quantification of angiogenesis can be significantly underestimated or overestimated by 2D imaging. Therefore, implementing a 3D system for MI with ultrasonography provides comprehensive details that would otherwise be missed with a traditional 2D analysis.
We also compared traditional 2D ultrasonic MI and its effectiveness by analyzing the variance, and therefore the variation in angiogenic marker expression, in individual tumors. We showed that some tumors had similar mean targeting values over the volume of the tumor, whereas the range and variance of targeting for the tumor were significantly dissimilar. Consequently, a single-slice 2D targeting analysis could lead to conclusions based on incomplete data when comparing two different tumors owing to the large targeting variations between them and therefore incur additional error.
To further examine the error potentially caused by undersampling in 2D MI with ultrasonography, we analyzed the RLV in MCA targeting between all adjacent imaging planes. In 2D serial studies, slice position and orientation are essential in maintaining a consistent sequential study. Therefore, using the RLV metric, we quantified the potential error associated with applications in which the transducer is removed from a fixed clamp and repositioned. In this study, the RLV was approximately 13%. Although this approximated error may seem low, a 3D analysis would inherently include all microbubble targeting, thus eliminating the possibility for this type of error.
In this study, we performed a multislice immunohistologic analysis on three different tumors. These data corroborated our conclusion that the angiogenesis within our tumors was heterogeneous, thus necessitating a more comprehensive volumetric analysis for adequate characterization. Similar to ultrasonic MI, variation in mean blood vessel density was considerable in some locations and modest in others, thus reaffirming our conclusion. It is important to note that although we saw a general trend between MI and histology, it was too difficult to correlate directly. This was due to several factors. First, although CD31 expression and αvβ3 integrin expression are biomarkers for neovasculature, they are not equivalent. However, this substitution for CD31 instead of αvβ3 integrin immunohistology was chosen owing to the challenge of obtaining specific antibodies directed against rat αvβ3 integrin. 38 Second, it was not possible to exactly match the imaging plane of the histologic sample to the ultrasound data set owing to the complex orientation and alignment issues and tissue deformations associated with extraction. Regardless, the histology results led us to the same conclusion as the ultrasonic MI analyses: a single-slice 2D analysis of neovasculature could easily misrepresent the true value exhibited by the entire volume of the tumor.
Blood Vessel Density (Mean and SD) for Each Tumor Segment for Each Tumor Compared to the Corresponding Targeted Intensity Obtained with Ultrasonic Molecular Imaging
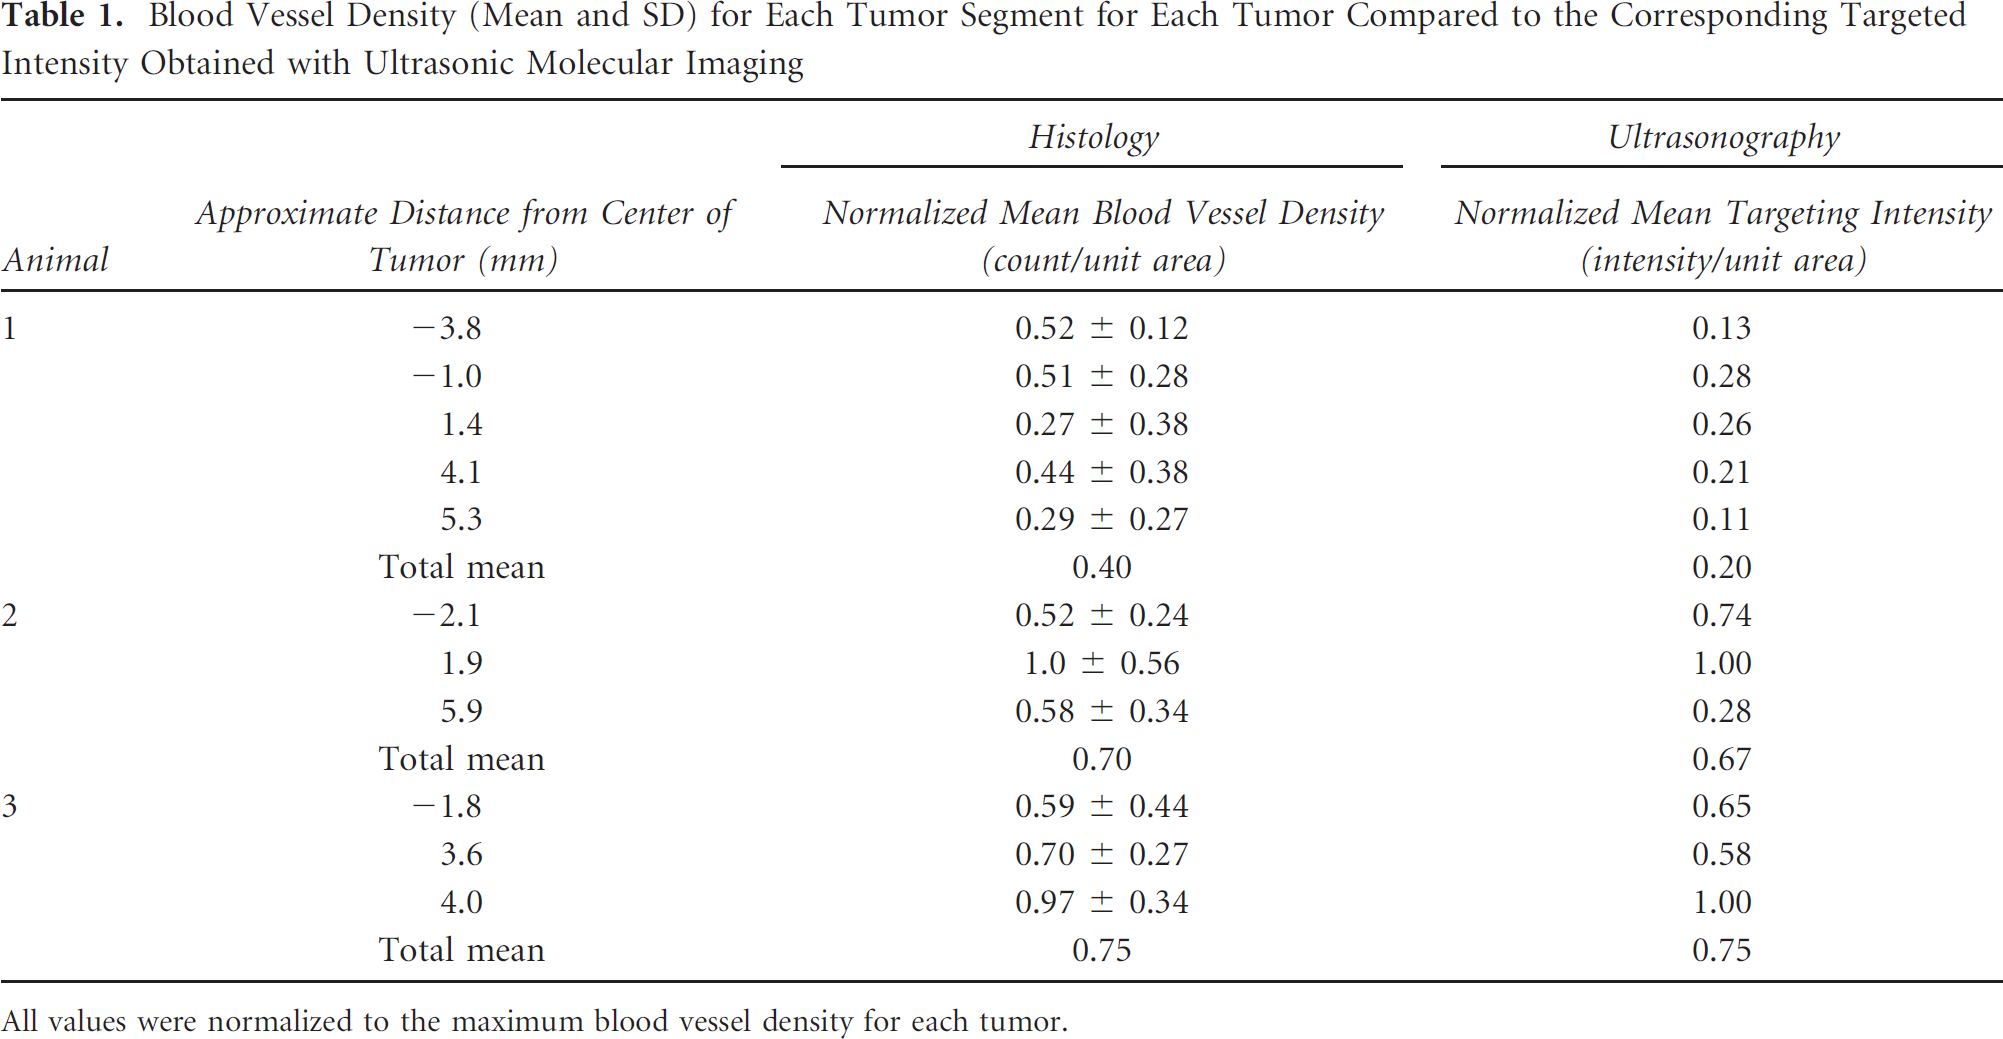
All values were normalized to the maximum blood vessel density for each tumor.
We have demonstrated the potential of 3D ultrasonic MI of angiogenesis in vivo. Although other clinically relevant applications were not explored, the extension of MI with ultrasonography to 3D provides an opportunity to improve the quality of data collected, as well as the accuracy of conclusions drawn from these studies. Based on these demonstrated advantages, we hypothesize that 3D MI will become more commonplace as high-resolution 3D transducers with nonlinear contrast imaging capability become more widely available on commercial ultrasound systems.
Footnotes
Acknowledgment
This research was financially supported by the NIH Roadmap for Medical Imaging, R21EB005325, NIH R01EB009066, and a grant from the UNC Lineberger Cancer Center. Dr. Paul A. Dayton is a member of the Scientific Advisory Board for Targeson. The authors wish to thank Ismayil Guracar from Siemens for assistance interfacing the ultrasound system with the motion stage for 3-D imaging.
Financial disclosure of reviewers: None reported.