
Abstract
In patients with World Health Organization (WHO) grade III glioma with a lack of or minimal (< 1 cm3) magnetic resonance imaging (MRI) contrast enhancement, the volume of the metabolically active part of the tumor was assessed by [ 11 C]-methionine positron emission tomography (MET-PET). Eleven patients with WHO grade III gliomas underwent MET-PET and MRI (contrast-enhanced T1-and T2-weighted images). To calculate the volumes in cubic centimeters, threshold-based volume of interest analyses of the metabolically active tumor (MET uptake index ≥ 1.3), contrast enhancement, and the T2 lesion were performed after coregistration of all images. In all patients, the metabolically active tumor volume was larger than the volume of gadolinium–diethylenetriamine pentaacetic acid (Gd-DTPA) enhancement (20.8 ± 18.8 vs 0.29 ± 0.25 cm3; p < .001). With the exception of one patient, the volumes of contrast enhancement were located within the metabolically active tumor volume. In contrast, in the majority of patients, MET uptake overlapped with the T<sb>2 lesion and reached beyond it (in 10 of 12 MRIs/MET-PET scans). The present data suggest that in patients with WHO grade III glioma with minimal or a lack of contrast enhancement, MET-PET delineates metabolically active tumor tissue. These findings support the use of combined PET-MRI with radiolabeled amino acids (eg, MET) for the delineating of the true extent of active tumor in the diagnosis and treatment planning of patients with gliomas.
MAGNETIC RESONANCE IMAGING (MRI) plays the most important role in the diagnostic workup of patients with brain tumors. Malignant high-grade gliomas most commonly show a heterogeneous pattern of enhancement on MRI associated with significant edema, necrosis, and/or hemorrhage. 1 The presence of contrast enhancement is often regarded to separate high-grade (ie, World Health Organization [WHO] grades III and IV) from low-grade tumors (ie, WHO grades I and II). However, this approach is limited by observations that 14 to 45% of nonenhancing supratentorial gliomas are proven to be malignant WHO grade III gliomas, whereas some enhancing gliomas have been shown to be WHO grade I or II.1–5 Hence, there are substantial proportions of MRIs with a lack of contrast enhancement, especially in WHO grade III gliomas, and others with contrast enhancement in WHO grade II gliomas, which may result in both false-negative and false-positive diagnostic and treatment decisions. In daily practice, neuro-oncologists are commonly confronted with ill-defined and ambiguous MRI findings in WHO grade III glioma, especially with non—contrast-enhancing lesions 6 or lesions with minimal abnormalities 7 (eg, nodular enhancement < 1 cm3).
To further investigate this issue, we identified a subgroup of patients with histologically proven WHO grade III glioma in which MRI displayed minimal or even a lack of contrast enhancement. We employed [ 11 C]-methionine positron emission tomography (MET-PET) in these patients to assess the metabolically active tumor volume. We hypothesized that volumetric assessment of MET-PET can be used to detect additional subareas of active tumor volumes, complementary to the information provided by gadolinium—diethylenetriamine pentaacetic acid (Gd-DTPA) enhancement or T2-weighted images alone.
Materials and Methods
A retrospective review of medical records from 2003 to 2006 was performed on all patients with histologically proven WHO grade III glioma who had undergone MET-PET imaging and in which MRI displayed minimal (< 1 cm3) or even a lack of contrast enhancement. We identified 11 patients (6 females and 5 males; mean age 41 ± 11 years; median age 37 years; range 24–60 years) with histologically proven WHO grade III glioma (astrocytoma [n = 5], oligoastrocytoma [n = 3], oligodendroglioma [n = 3]) (Table 1). The histologic diagnosis was based on either a resected (three patients) or a stereotactic (eight patients; Table 2) biopsy specimen. In seven patients, the tumor was newly diagnosed and hitherto untreated. In four patients, the tumor was pretreated (see Table 2). Of these four patients, two had suffered from secondary malignant transformation from a low-grade glioma (patients 7 and 10; see Table 2). MRI and MET-PET were performed in one patient twice (patient 9; see Table 1 and Table 2).
Patient Characteristics and Results of MET Uptake Ratios, Metabolically Active Tumor Volumes, Volumes of Gd-DTPA Enhancement, and T2 Lesion

A = astrocytoma; Gd-DTPA = gadolinium–diethylenetriamine pentaacetic acid; MET = [ 11 C]-methionine; MV = mean value; OA = oligoastrocytoma; ODG = oligodendroglioma; SD = standard deviation; WHO = World Health Organization.
*Patient was examined twice.
Treatment Overview
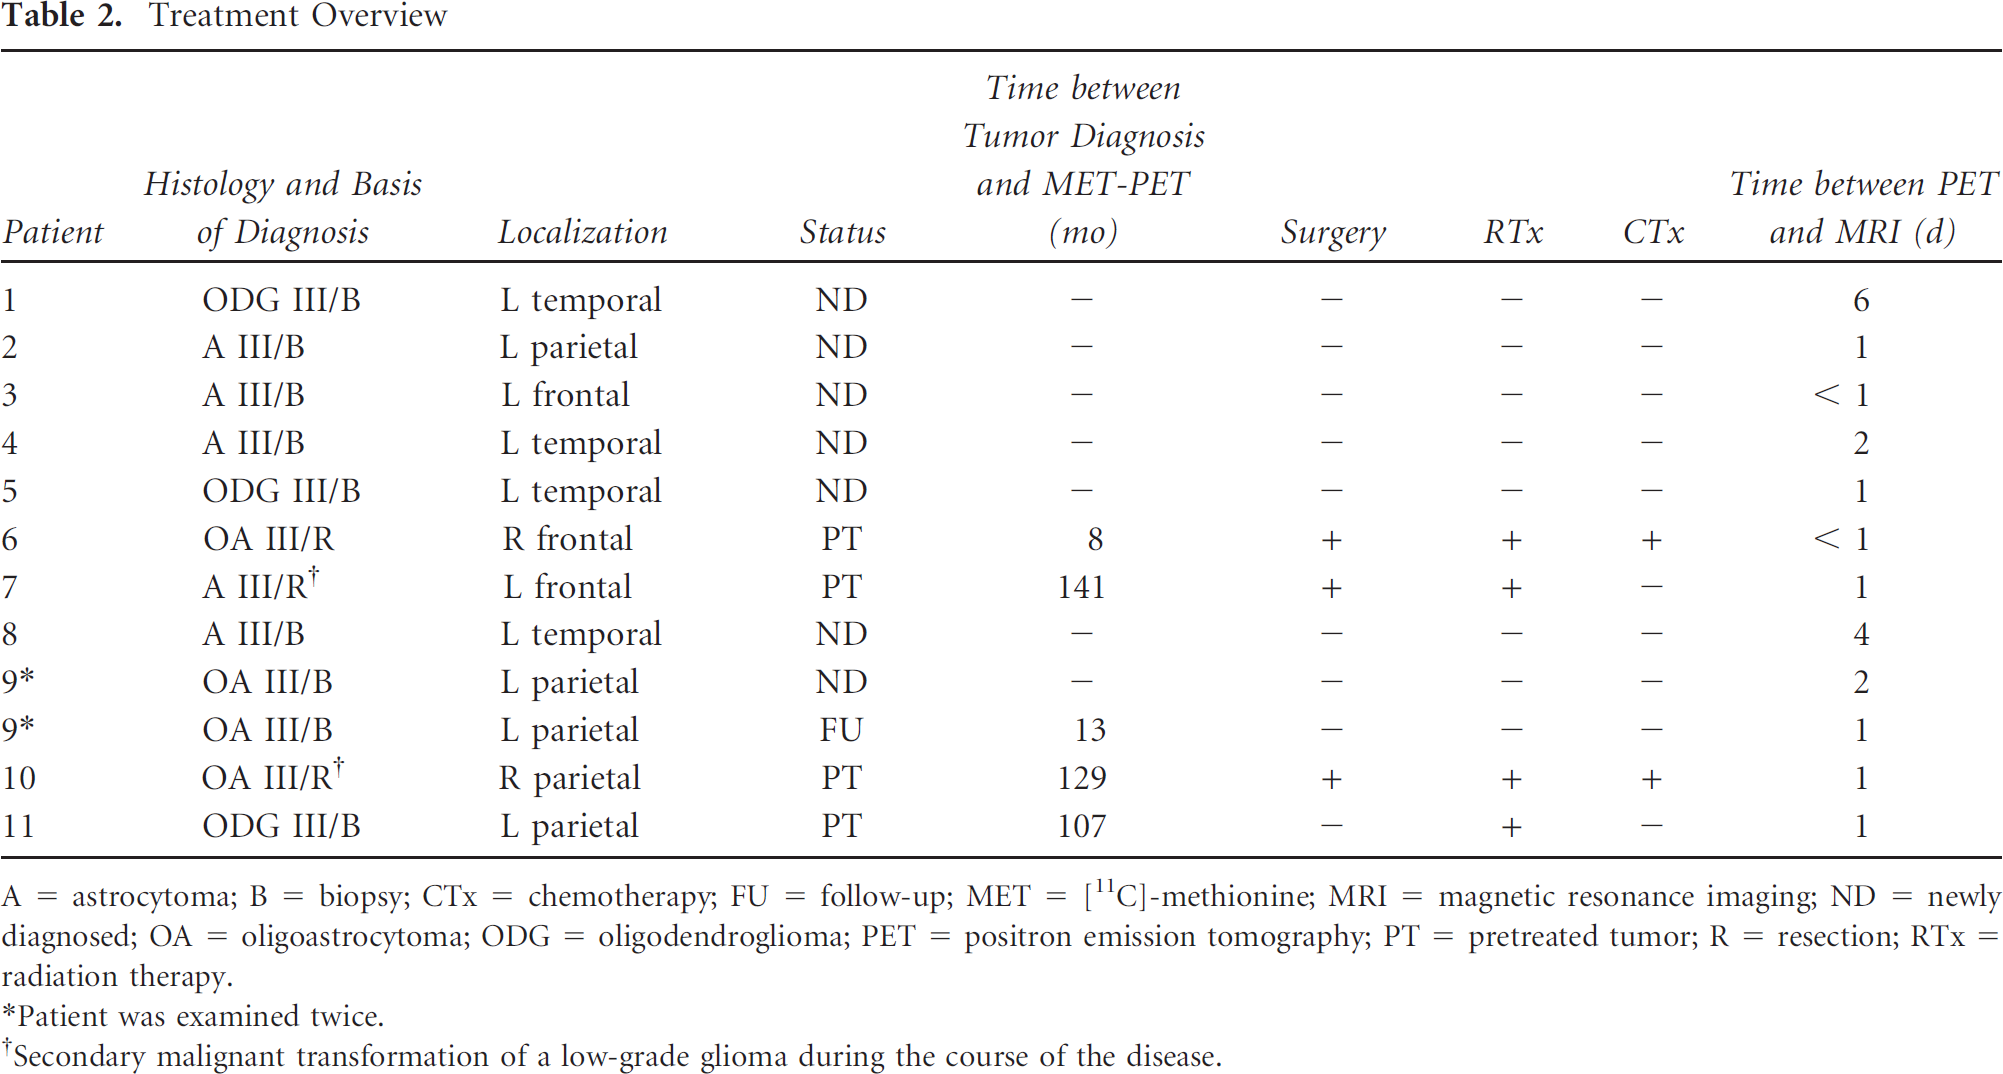
A = astrocytoma; B = biopsy; CTx = chemotherapy; FU = follow-up; MET = [ 11 C]-methionine; MRI = magnetic resonance imaging; ND = newly diagnosed; OA = oligoastrocytoma; ODG = oligodendroglioma; PET = positron emission tomography; PT = pretreated tumor; R = resection; RTx = radiation therapy.
*Patient was examined twice.
†Secondary malignant transformation of a low-grade glioma during the course of the disease.
All patients gave written consent to participate in the MET-PET studies. PET studies were performed on an ECAT EXACT or ECAT EXACT HR scanner (Siemens/CTI, Knoxville, TN). Following a 10-minute transmission scan, PET was performed after intravenous slow bolus injection of 740 MBq (20 mCi) of MET, synthesized according to the method of Berger and colleagues. 8 Tracer accumulation was recorded in three-dimensional mode over 60 minutes in 47 transaxial slices covering the entire brain. Summed activity from 20 to 60 minutes after tracer injection was used for image reconstruction. Images were reconstructed with Fourier rebinning and filtered backprojection with a ramp filter. Images were corrected for scatter, attenuation, and random coincidences. Spatial resolution was 6 mm or better in all dimensions.
MRI was performed using a 1.5 T Gyroscan Intera scanner (Philips Medical Systems, Eindhoven, The Netherlands), and images were acquired using a standard head coil. Axial T1-and T2-weighted images were obtained from the second cervical vertebral body to the vertex. To provide precise coregistration and accurate volume calculation, slice thickness was adjusted to 1 mm. After intravenous administration of Gd-DTPA (0.1 mmol/kg body weight), axial T1-weighted images were obtained using standard procedures.
PET data assessment was based on a region of interest (ROI) approach. As described previously,9,10 a circular ROI (8 mm radius; surface 201 mm2) was placed in the hottest area of the tumor (ie, centered on the pixel with maximal activity). For reference, an identically sized circular ROI was placed on the unaffected corresponding contralateral cortex or, if impossible because of the tumor location, on intact brain regions. The uptake index of tumor to contralateral mean activity was calculated.
Tumor volumes were measured by performing a three-dimensional thresholding-based volume of interest (VOI) analysis in all patients for MET-PET uptake and contrast-enhanced lesions on MRI using the VINCI imaging tool, developed in-house. 11 The threshold for increased MET uptake was set to ≥ 1.3 in the contiguous tumor region. In a previous study with mainly high-grade gliomas comparing the exact local MET uptake to histology of stereotactically guided biopsies, a receiver operating characteristic analysis demonstrated a sensitivity of 87% and a specificity of 89% for the detection of tumor tissue at a threshold of 1.3-fold MET uptake relative to normal brain tissue. 12 This threshold was subsequently reproduced in a further study using diffusion tensor imaging in comparison with MET uptake. 13
As described previously, a three-dimensional threshold-derived volumetric contour delineating the volumes of Gd-DTPA enhancement and T2 lesion in more detail using the VINCI tool9,11 was drawn on MRIs to define the VOI. The thresholds for positive contrast enhancement and hyper-intense T2-weighted signal on MRI were determined by varying the lower threshold value to identify and separate the VOI (ie, volumes of Gd-DTPA enhancement and T2 lesion) from the tissue with lower intensity.
The PET scans and MRIs of each patient were coregistered with each other with an accuracy of 2 mm or better using an automated procedure14,15 to ensure precise correspondence of ROI placement and to provide anatomic comparability of MET-PET and MRI.
Descriptive statistics are provided as mean and standard deviation and as median and range. Statistical analysis was performed using SigmaStat software version 3.0 (SPSS Inc, Chicago, IL).
Results
As defined by the study design, MRI showed minimal volumes of Gd-DTPA enhancement less than 1 cm3 (in 9 of 12 MRIs/MET-PET scans) or even complete absence thereof (3 of 12). In contrast, in all patients, metabolically active tumor tissue was depicted by MET-PET with an increased MET uptake index ≥ 1.3. The mean MET uptake index of tumor to contralateral activity was 1.96 ± 0.51 (median MET uptake index 1.90, range 1.36–2.94; see Table 1). When assessing the volume of active tumor tissue, defined by the increased MET uptake index ≥ 1.3, the metabolically active tumor volume was larger than the volume of Gd-DTPA enhancement in all patients (20.8 ± 18.8 vs 0.29 ± 0.25 cm3; p < .001, rank sum test; see Table 1). With the exception of one patient (patient 2), the volumes of Gd-DTPA enhancement were located within the metabolically active tumor volume (Figure 1).
Coregistration of MET-PET scans and MRIs (contrast enhanced and T2 weighted) and volumes of interest (VOI) of Gd-DTPA enhancement, T2 lesion, and active tumor volume (patient 3) shows that the metabolically active tumor volume is larger than the volume of Gd-DTPA enhancement. On superimposed images (bottom), VOI of the T2 lesion shows no correspondence in size and spatial configuration.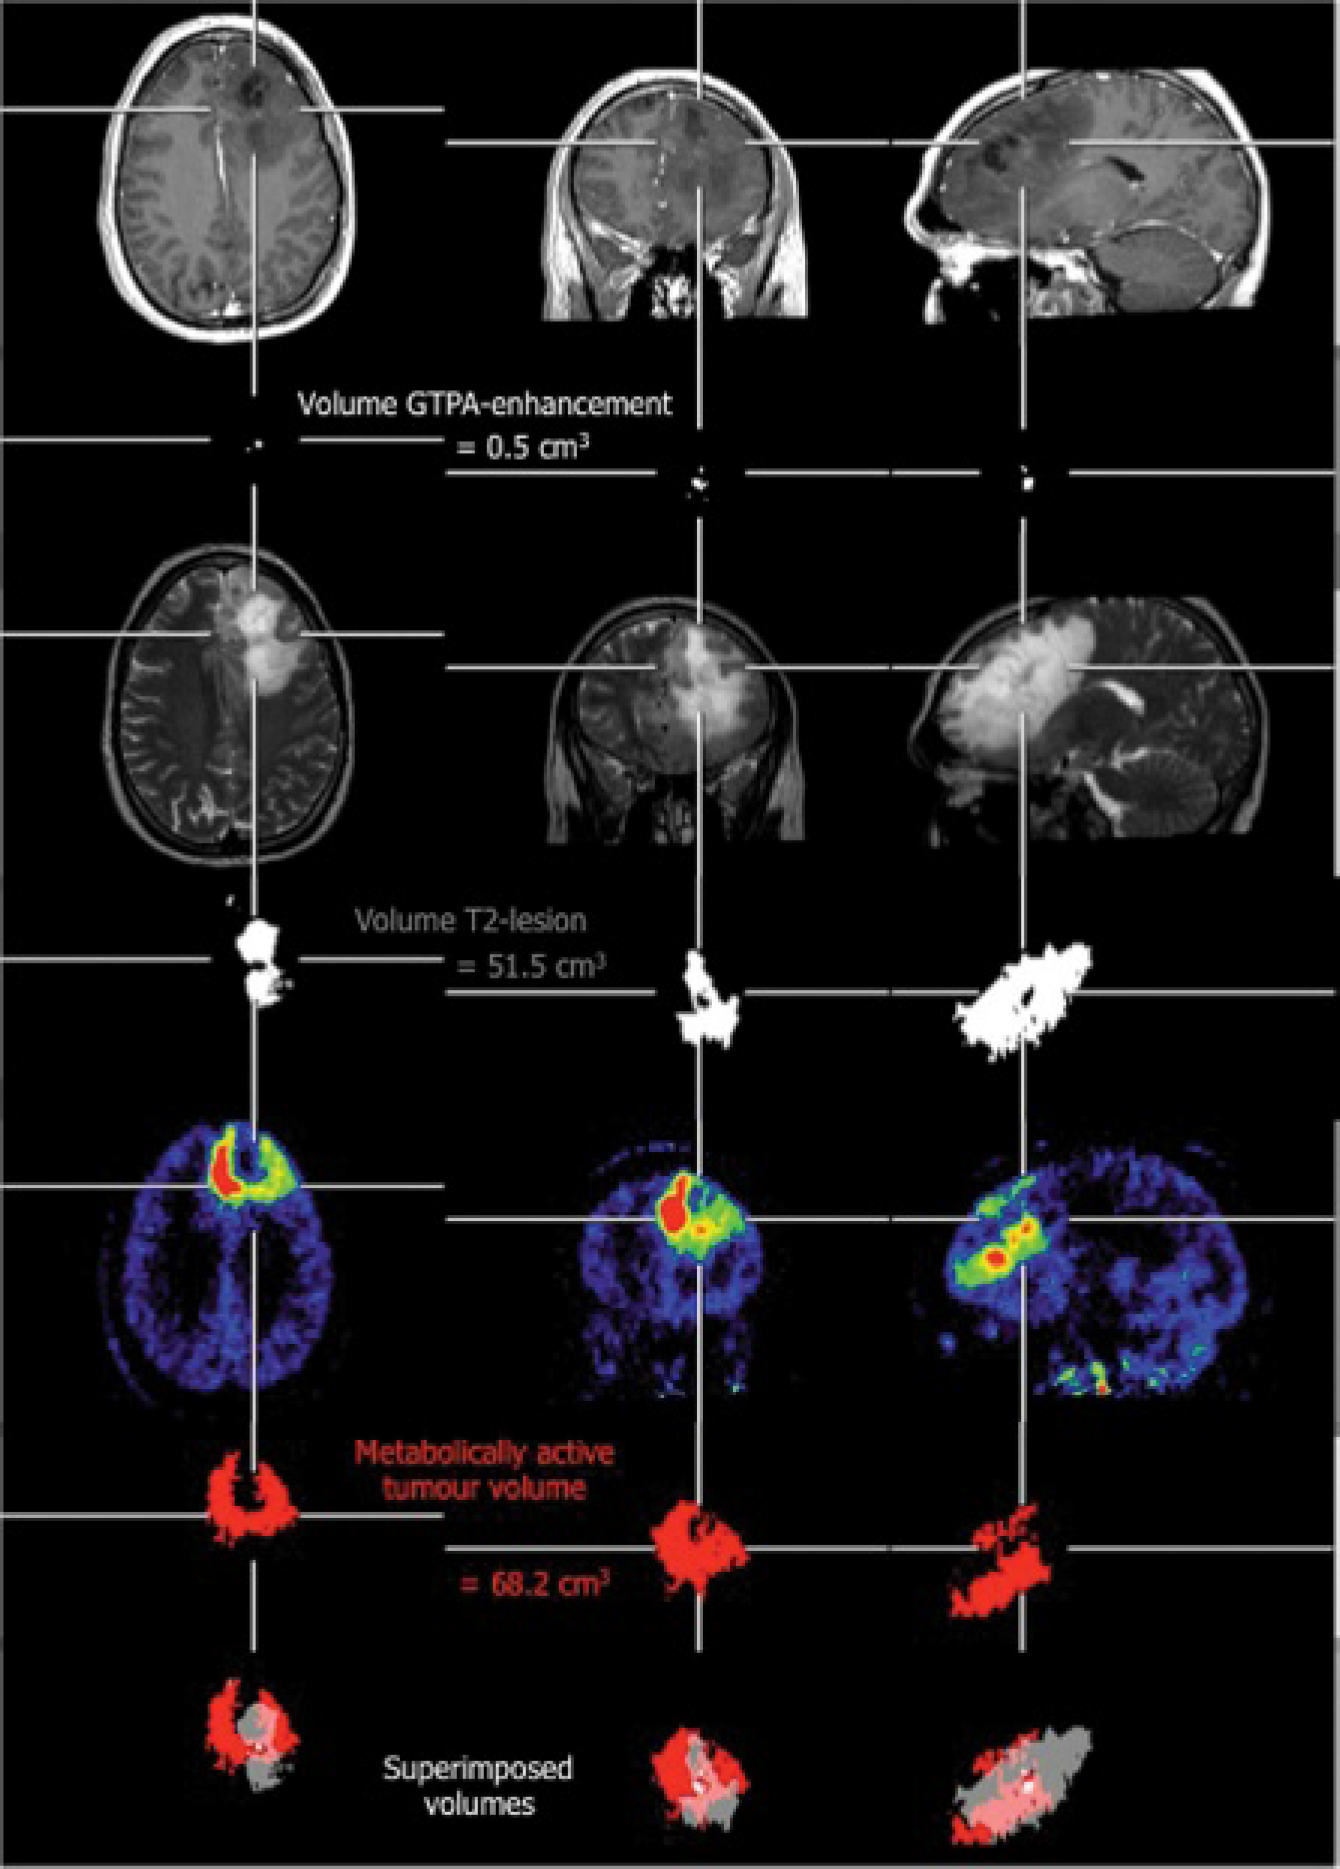
The mean volume of the T2 lesion on MRI was 30.9 ± 27.7 cm3 (median volume of T2 lesion 23.6 cm3, range 1.8–94.1 cm3; see Table 1). MET-PET identified smaller tumor volumes than T2-weighted MRI in six patients, with MET-positive volumes with an average of 39.6 ± 35.6% of the T2 volume. In a minority of patients (in 2 of 12 MRIs/MET-PET scans; see Table 1), the active tumor volume on MET-PET fell entirely within the localization of the T2 lesion volume. In contrast, in the majority of patients, MET uptake overlapped with the T2 lesion and reached beyond it (in 10 of 12 MRIs/MET-PET scans; see Table 1). In these imaging studies, the active tumor volume on MET-PET was often eccentric and partially located outside the volume of the T2 lesion (see Figure 1). The percentage of the active tumor volume outside the area of the T2 lesion volume is shown for each patient in Table 1. Up to an extent of 10% in eight MRIs/MET-PET scans, parts of the metabolically active tumor were located outside the area of the T2 lesion. In two further MRIs/MET-PET scans, the extent ranged between 20 and 50% (see Table 1).
Discussion
The main finding of the present study is that in patients with WHO grade III gliomas with minimal or a lack of contrast enhancement, MET-PET helps delineate the metabolically active tumor extent more precisely than Gd-DTPA or T2-weighted MRI alone. Our study shows that there are substantial differences in the volumetric images of WHO grade III gliomas between MET-PET and MRI, suggesting that in the subgroup of patients with WHO grade III gliomas in which MRI displayed minimal or even a lack of contrast enhancement, the metabolically active tumor volume extends considerably beyond the area of Gd-DTPA enhancement or the T2 lesion. These findings are in line with our hypothesis that volumetric assessment of MET-PET data allows detection of additional subareas of active tumor volume that cannot be derived from contrast-enhanced and T2-weighted MRI alone. However, these results need to be confirmed through future prospective studies that include histologic analyses of the areas with increased MET uptake.
A lack of Gd-DTPA enhancement in MRI is often considered to be indicative of nonmalignant WHO grade II tumors. Yet in a substantial proportion of patients, this notion has been proven to be incorrect: 14 to 45% of nonenhancing supratentorial gliomas are malignant WHO grade III gliomas, and some enhancing lesions may turn out to relate to WHO grade I or II gliomas.1–5 Therapy guidelines, however, differ fundamentally between WHO grade II and grade III tumors. The assumption of a WHO grade II tumor based on MRI findings may be misleading. Furthermore, stereotactic biopsy guided by MRI may reveal an incorrect diagnosis of WHO grade II tumors owing to sampling errors. Our data suggest that a combined PET-MRI approach with radiolabeled amino acids (eg, MET) is necessary to identify the true extent of metabolically active tumor, which guides biopsy, resection, and radiation (eg, identifying the metabolically hot spots of the tumor that are best suited for biopsy).
To date, MRI plays the most important role in the diagnostic workup of patients with brain tumors and is the most widely accepted method of determining the target for treatment. The area of contrast enhancement is generally assumed to correspond well to the main mass of active tumor tissue and depends on blood-brain barrier (BBB) damage. Infiltrative growth of tumor cells leads to disruption of the BBB, allowing the contrast agent to leak into the interstitial space. However, neuropathology has demonstrated that glioma cells are commonly found beyond the area of Gd-DTPA enhancement, particularly in high-grade gliomas. 16 Further refinements of the MRI technique, such as, for example, diffusion-weighted imaging (DWI) and perfusion-weighted imaging (PWI), may add important diagnostic information in the differential diagnosis of brain tumors by providing complementary information on tumor vasculature and microenvironment. DWI may provide surrogate information on the cellular density of gliomas. In areas with high cell density, diffusion of water molecules is reduced because of the limited intercellular space. Therefore, highly proliferating tumor regions with high cell densities may display a decrease in the apparent diffusion coefficient (ADC). 17 Although this might suggest that the ADC can be used to distinguish between tumors and peritumoral lesions, Pauleit and colleagues recently reported a strong overlap between ADC values in tumor and peritumoral tissue. 18 Therefore, further studies are required to investigate the correlations between biologic tumor characteristics—as determined by histology—and ADC values. Moreover, several studies suggested that the relative cerebral blood volume (rCBV) obtained by PWI may provide important information on tumor angiogenesis and tumor grading in patients with gliomas.19,20 rCBV correlates with vascular epidermal growth factor receptor expression and histopathologic grade in nonenhancing gliomas. 21 This indicates that rCBV might be helpful for both grading glioma preoperative tumors and providing a marker for tumor angiogenesis. Relative CBV allows differentiating between brain tumors with high or low blood supply, as well as between abscesses from high-grade gliomas and metastases. 22 However, to the best of our knowledge, in comparison to MET-PET, there are no studies that describe the clear superiority of these techniques concerning the three-dimensional delineation of malignant WHO grade III gliomas, in which MRI findings were ill-defined and ambiguous.
Radiolabeled amino acids currently used for clinical brain tumor imaging are substrates for Na+-independent system L-type amino acid transporters. MET uptake is attributed to the activation of carrier-mediated transport at the BBB level and is transported by the L-type amino acid transporter (LAT1), which is highly expressed in cultured cells and malignant tumors.23,24 It undergoes complex metabolism and is incorporated into proteins; therefore, increased uptake may reflect the metabolic needs of brain tumors. 25 MET might accumulate in brain tumors by passive diffusion owing to the BBB disruption or by carrier-mediated transport through cell membranes. 26 The result that MET accumulated in low-grade and in high grade-gliomas without contrast enhancement,27–29 indicating an intact BBB, suggests that MET accumulation is due to a facilitated transport via a specific carrier system that is not energy dependent. The incongruence of Gd-DTPA enhancement and MET uptake and the existence of a patient population with WHO grade III gliomas with a lack of clear Gd-DTPA enhancement suggest strongly that accumulation of MET occurs largely independent of disruption of the BBB.
In a considerable number of patients harboring cerebral gliomas, contrast-enhanced computed tomography and MRI fail to outline the exact tumor margins, particularly in patients with low-grade gliomas. 30 Moreover, in previously reported multimodal image fusion studies with spatial correlation of metabolic images using MET-PET, structural MRI (T1 + GDPA, T2, fluid-attenuated inversion recovery), and stereotactically derived histology in brain gliomas, MRI failed to outline the exact tumor margins in patients with low- and high-grade gliomas.27,28 Reliable three-dimensional tumor delineation using MET-PET is helpful to improve neurosurgical resection or facilitate further therapy decisions. In various other recent studies, MET-PET data were successfully combined with MRI data to provide specific information for defining the target volume for radiosurgery and neuronavigation surgery in patients with brain tumors such as meningiomas and high-grade gliomas.31–33
Our findings strongly support the notion that MET-PET may provide complementary information to MRI and that PET-MRI with radiolabeled amino acids (eg, MET) should be used in combination for the diagnosis and therapy planning of patients with malignant WHO grade III gliomas, especially when MRI findings are ill-defined and ambiguous. The current study indicates the potential of MET-PET to more accurately assess this subgroup of patients with WHO grade III gliomas and opens new perspectives for adequate patient management. For example, a neurosurgical resection according to MRI contrast enhancement or to the T2 lesion may lead to incomplete resection of the metabolically active tumor. In a recent study, metabolic information helped the planning of surgery using PET-guided volumetric resection of high-grade gliomas. 34 Treatment planning studies with radiolabeled amino acids (eg, MET), including assessment of outcome, are currently in the focus of interest. For example, it was demonstrated that complete resection according to PET tracer uptake in high-grade gliomas increases survival, whereas complete resection according to MRI contrast enhancement does not. 34 In the future, it seems likely that the complementary information obtained with multiple imaging modalities will lead to the most efficient delineation of the appropriate tumor volume.
However, implementation of MET-PET into routine clinical practice is difficult owing to the fact that the method is restricted to a few centers with a cyclotron unit owing to the short half-life of
11
C-labeled MET. Novel
18
F-radiolabeled amino acids are more convenient and may be an alternative to MET-PET in the near future. For example, similar uptake in nonenhancing portions of gliomas, including WHO grade III gliomas, has been shown in PET studies with the tracer O-(2-[
18
F]fluoroethyl)-
In summary, a combined PET-MRI-based assessment with radiolabeled amino acids (eg, MET) appears to provide more accurate tumor volume and margin assessment compared to MRI alone for the pretreatment evaluation of grade III gliomas.
Footnotes
Acknowledgment
Financial disclosure of authors and reviewers: None reported.