
Abstract
Mass transport of drug delivery vehicles is guided by particle properties, such as size, shape, composition, and surface chemistry, as well as biomolecules and serum proteins that adsorb to the particle surface. In an attempt to identify serum proteins influencing cellular associations and biodistribution of intravascularly injected particles, we used two-dimensional gel electrophoresis and mass spectrometry to identify proteins eluted from the surface of cationic and anionic silicon microparticles. Cationic microparticles displayed a 25-fold greater abundance of Ig light variable chain, fibrinogen, and complement component 1 compared to their anionic counterparts. Anionic microparticles were found to accumulate in equal abundance in murine liver and spleen, whereas cationic microparticles showed preferential accumulation in the spleen. Immunohistochemistry supported macrophage uptake of both anionic and cationic microparticles in the liver, as well as evidence of association of cationic microparticles with hepatic endothelial cells. Furthermore, scanning electron micrographs supported cellular competition for cationic microparticles by endothelial cells and macrophages. Despite high macrophage content in the lungs and tumor, microparticle uptake by these cells was minimal, supporting differences in the repertoire of surface receptors expressed by tissue-specific macrophages. In summary, particle surface chemistry drives selective binding of serum components impacting cellular interactions and biodistribution.
The use of intrinsic particle properties as a driving force for cellular interactions and biobarrier transport may prove superior to ligation of particles with targeting ligands, such as antibodies. The use of antibodies to drive cellular interactions favors uptake by macrophages of the reticuloendothelial system (RES), based on the high density of Fc gamma receptors on the surface of macrophages. Opsonization can also drive sequestering of particles by the RES, with the liver and spleen comprising the end-point organs for the majority of particle-based injectables. The goal of this study was to define the impact of particle surface chemistry on protein adsorption and the resulting cellular associations and biodistribution.
We have previously introduced the concept of “multistage carriers,” wherein each stage (ie, particle layer) performs part of the journey from the site of administration to the target lesion. Each stage adds a degree of targeting selectivity in the process. The platform consists of mesoporous silicon particles designed to shuttle higher-level particles and, ultimately, therapeutic and imaging agents. 7
It is well known that biotransport, cellular associations, and intracellular trafficking of drug delivery vehicles, as well as phagocytic engulfment of particles, are driven in part by surface charge and the repertoire of macromolecules and plasma proteins that bind to the particle's surface. We recently reported that, under serum-free conditions, both anionic and cationic porous silicon microparticles are phagocytosed by human umbilical vein endothelial cells (HUVECs). 1 However, in the presence of serum, only microparticles with an originally cationic surface are internalized.
In this study, using quasihemispherical and discoidal silicon microparticles with either an oxidized, anionic surface or an aminosilylated cationic surface, we sought to define plasma proteins adsorbing discriminately to the particle surfaces, and how this potentially impacts cellular associations and biodistribution. We hypothesized that different protein coronas would result in microparticle association with unique cellular populations based on affinities for different cell surface receptors, leading to disparate in vivo biodistributions. To identify serum proteins adsorbed to the particle surfaces, we eluted bound proteins and used two-dimensional gel electrophoresis (2DGE) and mass spectroscopy (MS). The impact of particle surface charge on in vivo cellular associations and biodistribution was studied in an animal model of breast cancer. Endothelial and RES targeting based on particle surface chemistry-driven opsonization was explored by defining cellular interactions in the liver and spleen. Cellular associations of particles with the intraluminal surface of blood vessels were imaged by scanning electron microscopy (SEM), whereas transmission electron microscopy (TEM) was used to image intracellularly localized particles. Our broad goal was to enhance our understanding of the mechanics that drive in vivo trafficking of drug delivery vehicles.
Materials and Methods
Porous Silicon Microparticle Fabrication
Nanoporous quasihemispherical and discoidal silicon microparticles were fabricated in the Microelectronics Research Center at The University of Texas at Austin. The mean particle diameter, 3.2 ± 0.2 μm, was determined using SEM, and the average pore size, 26.3 ± 13.6 nm (hemispherical) and 51.3 ± 28.7 nm (discoidal), was based on BET measurements. Briefly, heavily doped p++ type (100) silicon wafers (Silicon Quest, Inc, Santa Clara, CA) were used as the silicon source. For discoidal microparticles, an SiO2 layer was thermally grown on the wafer, followed by a layer of silicon nitride (SiN) deposited by low-pressure chemical vapor deposition. Standard photolithography, dry etch of SiN in CF4 plasma, and wet SiO2 etch in 5% hydrofluoric acid (HF) were used to transfer a pattern of 2 μm circular arrays on the silicon wafer. A three-step electrochemical etch was used to make silicon particles consisting of a low-porosity mechanical stabilization layer, a large-pore device layer, and a high-porosity release layer. The masking SiN and SiO2 layers were removed in aqueous HF solution, and the silicon particles were released from the substrate by sonication in isopropanol. Details for creating hemispherical microparticles were recently published. 8
Surface Modification of Silicon Microparticles
An isopropyl alcohol (IPA) suspension containing silicon microparticles was transferred to a glass petri dish, and the IPA was evaporated using a hotplate set at 60°C overnight. The hotplate temperature was then raised to 120°C for 15 minutes to ensure evaporation of residual IPA from the porous matrix. Dried microparticles were then treated with piranha solution (1 volume H2O2 and 2 volumes of H2SO4) with heating to 110 to 120°C for 2 hours with intermittent sonication to disperse the microparticles. The microparticles were then washed three times and incubated in 10% nitric acid for 30 minutes. The microparticles were then washed in deionized water three times, followed by washing in IPA three times. For aminosilylation, oxidized microparticles were suspended in IPA containing 2% (v/v) 3-aminopropyltriethoxysilane (APTES; Sigma-Aldrich, St. Louis, MO) for 2 hours at 35°C, with mixing at 1,300 rpm. APTES-modified microparticles were washed in IPA, and the amine density was determined using a 4-nitrobenzaldehyde (NBA) colorimetric assay. Briefly, 2 × 10 7 APTES-modified microparticles were washed in coupling solution (0.8% glacial acetic acid in 99.2% anhydrous ethanol [Sigma-Aldrich]) three times and resuspended in 1 mL of reaction solution (5 mM NBA in coupling solution) for 3 hours with mixing (900 rpm) at 50°C. Particles were then washed with absolute ethanol five times and resuspended in 1 mL of hydrolysis solution (0.14% glacial acetic acid in 50% ethanol). Standards were prepared with NBA, and absorbance was determined at 268 nm. Microparticle concentration was determined using a Z Series Coulter Counter (Beckman Coulter, Fullerton, CA).
Zeta Potential Analysis
A ZetaPALS Zeta Potential Analyzer (Brookhaven Instruments Corp., Holtsville, NY) equipped with a 90Plus/BIMAS Multi Angle Particle Sizing Option was used to measure the zeta potential of particles suspended in 0.01 M phosphate buffer at a concentration 1 to 50 μg/mL silicon. The impact of IgG and serum protein binding on microparticle surface charge was studied by incubating the microparticles (1–3 × 10⁶) in serum or pure IgG for 30 minutes at 4, 25, or 37°C. Measurements were performed at pH 5.0 and pH 7.4. IgG binding was measured based on fluorescent intensity of a secondary antibody. The secondary antibody was incubated with particles at 10 mg/mL, either before or after exposure to bare IgG.
Fourier Transform Infrared Spectroscopy
Microparticle samples were applied to the diamond surface of a SMART ATR attachment on a Nicolet 6600 FTIR Spectrometer (Nicolet Instrument Technologies, Middleton, WI). The applied sample was then dried with nitrogen, and the Fourier transform infrared spectroscopy (FTIR) spectra were read. A room temperature detector was used to collect all data, and all readings were made using a resolution of 4 and averaging 16 readings in absorbance mode. Analysis of the peaks was performed using Omnic peak identification software (Thermo Scientific, West Palm Beach, FL) and Microsoft Excel.
Scanning Electron Microscopy
J774 macrophages, purchased from American Type Culture Collection (ATCC, Manassas, VA), were grown on 5 × 7 mm Silicon Chip Specimen Supports (Ted Pella, Inc., Redding, CA). On reaching 80% confluency, cells were incubated with silicon microparticles (1:10 cell:microparticle) for 15 minutes at 37°C. Samples were washed with phosphate-buffered saline (PBS) and fixed in 2.5% glutaraldehyde (Sigma-Aldrich). After washing in PBS, cells were dehydrated with increasing concentrations of ethanol (30, 50, 70, 90, 95, and 100%) for 10 minutes each. Cells were then incubated in 50% alcohol-hexamethyldisilazane (HMDS; Sigma-Aldrich) solution for 10 minutes followed by incubation in pure HMDS for 5 minutes to prepare for overnight incubation in a desiccator. Specimens were mounted on SEM stubs (Ted Pella, Inc.) using conductive adhesive tape (12 mm OD PELCO Tabs, Ted Pella, Inc.) and then sputter-coated with a 10 nm layer of gold using a Plasma Sciences CrC-150 Sputtering System (Torr International, Inc., New Windsor, NY).
For SEM imaging of microparticles, samples were suspended in either IPA or water and then dried on ethanol-washed SEM stubs (Ted Pella, Inc.) overnight in a desiccator. Micrographs were acquired under high vacuum, at 20 to 30 kV, spot size 3.0 to 5.0, using a FEI Quanta 400 FEG environmental SEM (ESEM, FEI Company, Hillsboro, OR).
Tissue Electron Microscopy
For tissue SEM, at predetermined time points following intravascular injection of discoidal porous silicon microparticles (1 × 10⁸), animals were perfused by injection into the left ventricle with 30 mL of perfusion wash solution (#1222SK, Electron Microscopy Sciences, Hatfield, PA) followed by 30 mL of perfusion fix solution (#1223SK, Electron Microscopy Sciences). Tissues were processed based on techniques adapted from Hashizume and colleagues. 9 Tissue was collected in fixative, followed by embedding in 3% agarose. Tissue sections of 100 μm thickness were cut using a Krumdieck MD-4000 Tissue Slicer (Alabama Research & Development, Munford, AL). Sections were rinsed with cacodylate buffer, immersed in cacodylate-buffered 2% tannic acid for 24 hours, and washed twice with 0.2 M sodium cacodylate and then incubated in cacodylate-buffered 2% osmium tetroxide for 2 hours at 4°C, washed again in 0.2 M sodium cacodylate, and dehydrated in increasing concentrations of ethanol, followed by infiltration with 100% t-butanol. Samples were dried in a desiccator, and then mounted on SEM sample stubs using carbon adhesive tape. Following sputter coating with a 10 nm thick layer of gold, samples were imaged using an FEI Quanta 400 FEG ESEM.
Tissue TEM imaging was done on 100 nm sections of resin-embedded tissue using a JEOL 1200 transmission electron microscope at 60 kV with digital images collected using a 1 k × 1 k Gatan BioScan camera Model 792.
In Vitro Microparticle Association Studies
HUVECs, purchased from Lonza Walkersville, Inc. (Walkersville, MD) were cultured in EBM-2 medium (Clonetics, CC-3156, Lonza). Serum-free experiments used EBM-2 medium supplemented with only hydrocortisone and GA-1000, plus 0.2% bovine serum albumin (BSA). HUVECs were discarded after seven to eight passages. For flow cytometry studies, HUVECs (1.5 × 10 5 cells/well) were seeded into six-well plates, and 24 hours later, the cells were incubated with silicon microparticles (10–20 microparticles/cell) in the indicated medium for 60 minutes. For opsonization experiments, microparticles were preincubated with 100 μL of serum or plasma on ice for 30 minutes. Stimulated cells were treated with tumor necrosis factor α (TNF-α) (10 ng/mL) and interferon-γ (IFN-γ) (100 U/mL) for 48 hours prior to incubation with microparticles. Following cellular internalization, cells were washed with PBS, harvested by trypsinization, and resuspended in PBS containing 1.0% BSA and 0.1% sodium azide (fluorescence-activated cell sorting [FACS] wash buffer). Microparticle association with cells was determined by measuring side scatter using a FACSCalibur Flow Cytometer (Becton Dickinson, San Jose, CA) equipped with a 488 nm argon laser and CellQuest software. Data are presented as the percentage of cells associating with microparticles (percentage of cells with high side scatter). Side scatter owing to cells in the absence of particles was subtracted from the presented data. Sample populations were compared using a two-tailed distribution, two-sample equal variance t-test.
Animal Studies
Breast cancer xenografts were established in Crl:NU-Foxn1nu mice (Charles River Laboratories International, Inc., Wilmington, MA) by intramammary injection of 1 × 10⁵ 4T1 mouse mammary tumor cells (ATCC). After approximately 3 weeks, when the tumors reached 1 cm in diameter, mice were injected by tail vein with vehicle control (saline) or 1 × 10⁸ 3.2 μm oxidized or APTES-modified silicon microparticles in 100 μL saline (n = 3 mice per group). Twenty-four hours after injection, the mice were sacrificed and tissues were excised and either frozen for immunohistochemistry or weighed and then moved to 5 mL of 80% 1 M NaOH/20% EtOH for analysis of tissue biodistribution using inductively coupled plasma atomic emission spectrometry (ICP-AES).
Frozen tissues were sectioned and stained with antibodies specific for endothelia (antimouse CD34, Beckman Coulter, Brea, CA) or macrophages (antimouse CD204, scavenger receptor type I/II, AbD Serotec, Raleigh, NC). CD34 was visualized using the STAT-Q Peroxidase (horseradish peroxidase [HRP]) system and diaminobenzidine (DAB), purchased from Innovex Biosciences (Richmond, CA). The secondary antibody used for the CD204 antibody was goat-antirat IgG:HRP (1:50 dilution; STAR72), purchased from AbD Serotec. Nuclei were stained with hematoxylin.
Tissue samples suspended in NaOH for inductively coupled plasma atomic emission spectroscopy (ICP-AES) were homogenized, placed on a tube rotator overnight, and then centrifuged at 4,200 rpm (Beckman Coulter centrifuge). A 0.5 mL aliquot of the tissue slurry was moved to a conical tube with 4.5 mL of distilled water. Samples were analyzed for silicon using a Varian Vista AX ICP-AES at a power of 1 kW, with plasma flow set to 15 L/min, auxiliary flow of 1.5 L/min, and nebulizer flow of 0.75 L/min, with five replicate readings at 15 seconds between each reading. A standard curve was generated using Fisher Scientific (Pittsburgh, PA) Silicon Reference Standard Solution.
Differential Protein Estimation by 2DGE
Plasma was collected from 10 mice by orbital bleeding and placed in tubes containing ethylenediaminetetraacetic acid as the anticoagulant. Following centrifugation at 1,500g for 10 minutes, the upper plasma layers were pooled and frozen. Prior to use, plasma was thawed on ice. Oxidized and APTES-modified discoidal microparticles (1 × 10⁸; 0.5 mg each) were each incubated with 0.5 mL of plasma on ice for 30 minutes after vortexing. Microparticles were then washed three times with PBS, washed once in 0.1 X PBS, and resuspended in 100 μL of Destreak Rehydration Solution (Fisher Scientific). Samples were vortexed, incubated at room temperature for 10 minutes, and then centrifuged, and the protein solution was frozen at — 80°C.
2DGE was conducted using the IPGphor multiple sample isoelectric focusing (IEF) device from GE Healthcare (Pittsburgh, PA) for the first dimension and Bio-Rad's (Hercules, CA) multiple-gel sodium dodecyl sulfate-polyacrylamide gel electrophoresis (SDS-PAGE) systems (Protean Plus and Criterion Dodeca cells) for the second dimension as first described by O'Farrell. 10 IEF was performed with 11 cm precast immobilized pH gradient (IPG) strips (Bio-Rad). Sample aliquots were loaded onto dehydrated IPG strips and rehydrated overnight. IEF was performed at 20°C with the following parameters: 50 V, 11 hours; 250 V, 1 hour; 500 V, 1 hour; 1,000 V, 1 hour; 8,000 V, 2 hours; and 8,000 V, 6 hours. The IPG strips were then incubated in 4 mL of equilibration buffer (6 M urea, 2% SDS, 50 mM Tris-HCl, pH 8.8, 20% glycerol) containing 10 μL/mL tri-2 (2-carboxyethyl) phosphine (Geno Technology, Inc., St. Louis, MO) for 15 minutes at 22°C with shaking. The samples were incubated in another 4 mL of equilibration buffer with 25 mg/mL iodoacetamide for 15 minutes at 22°C with shaking to ensure protein S-alkylation. Electrophoresis was performed at 150 V for 2.25 hours, 4°C with precast 8 to 16% polyacrylamide gels in Trisglycine buffer (25 mM Tris-HCl, 192 mM glycine, 0.1% SDS, pH 8.3). After electrophoresis, the gels were fixed (10% methanol, 7% acetic acid in distilled water), stained with SYPRO-Ruby 11 (Bio-Rad), and destained in fixative. The destained gels were scanned at a 100 μm resolution using the ProXPRESS 2D Proteomic Imaging System (Perkin Elmer, Boston, MA) using 460/80 nm excitation and 620 nm (long-pass) emission filters.
Measurement of Relative Spot Intensities
The two-dimensional gel images were analyzed using Progenesis/SameSpots software (Nonlinear Dynamics, Ltd., Newcastle Upon Tyne, UK). Analysis relies on geometric correction of the scans and projecting them all into the same reference space, performing pixel-to-pixel matching and then spot detection. Subsequent to automatic spot detection, spot filtering was manually performed, and spots with an area of less than 250 pixels were filtered out, and spots with a volume (intensity)/area ratio of less than 150 pixels were also filtered. The matching of spots between the gels is manually reviewed and adjusted as necessary. In our previous work, we found that the log-transformed normalized spot volumes were normally distributed, indicating that nonparametric statistical comparisons such as t-tests could be applied to identify those proteins whose expression was significantly changed by treatment. A change in normalized spot volumes greater than ± 25-fold was used to select the spots that were subsequently robotically picked and trypsin digested, and peptide masses were identified by matrix-assisted laser desorption/ionization-time of flight (MALDI-TOF). Protein identification was performed using a bayesian algorithm, 12 where high-probability matches are indicated by expectation score, an estimate of the number of matches that would be expected in that database if the matches were completely random. To determine gel-to-gel reproducibility, hierarchical clustering was performed by the hclust algorithm in the S-Plus statistical package version 6 (Insightful Inc.) using euclidian distance. 13
Protein Identification
Protein gel spots were excised and prepared for MALDI-TOF/TOF analysis using Genomic Solutions' ProPic II and ProPrep robotic instruments following the manufacturer's protocols. Briefly, gel pieces were incubated with trypsin (20 μg/mL in 25 mM ammonium bicarbonate, pH 8.0, Promega Corp.) at 37°C for 4 hours. The 4800 MALDI-TOF/TOF was used for peptide mass fingerprinting and sequence analysis and database interrogation. Data were acquired with an Applied Biosystems (AB) 4800 MALDI-TOF/TOF and AB software package 4000 Series Explorer (version 3.0 RC1) with Oracle Database Schema version 3.19.0 and data version 3.80.0 to acquire both MS and MS/MS spectral data. The parameters used are included as supplemental material [Supplemental Table S1].
Results
Silicon Microparticles and Cellular Associations
Porous silicon microparticles were fabricated from silicon wafers using procedures that resulted in quasihemispherical (Figure 1, A-B) or discoidal shapes (Figure 1C). Previous in vitro studies showed that both microparticle shape variants are candidates for cellular uptake by phagocytic cells. 14 Scanning electron micrographs in Figure 1, B and C, show microparticles on or near the surface of J774 macrophages. The mechanism of internalization has previously been shown to be actin-dependent phagocytosis and macropinocytosis. 15 In Figure 1D, a discoidal silicon microparticle is being internalized by a macrophage, and the formation of cellular filopodia can be seen both adhering to the microparticle surface and as a larger extension approaching the microparticle. We have previously shown that murine macrophages internalize both cationic and anionic silicon microparticles in the presence and absence of serum. 15
We also previously demonstrated that cellular uptake of porous silicon microparticles by human endothelial cells is altered by serum opsonins binding to the surface of microparticles in a charge-dependent fashion. 15 Cationic, aminosilylated silicon microparticles are internalized similarly in both serum-free and serum-containing media; however, internalization of anionic, oxidized silicon microparticles is reduced in the presence of serum proteins. 15 The results in Figure 1E summarize previously published findings in which serum proteins and pure IgG inhibit uptake of anionic silicon microparticles by endothelial cells, in the presence or absence of the inflammatory cytokines TNF-α and IFN-γ. 15 The negative impact of serum biomolecules on microparticle uptake was greater in the presence of plasma compared to serum, and preopsonization of microparticles before addition to the cell culture did not alter uptake compared to adding nonopsonized microparticles to cells in the presence of medium containing serum.
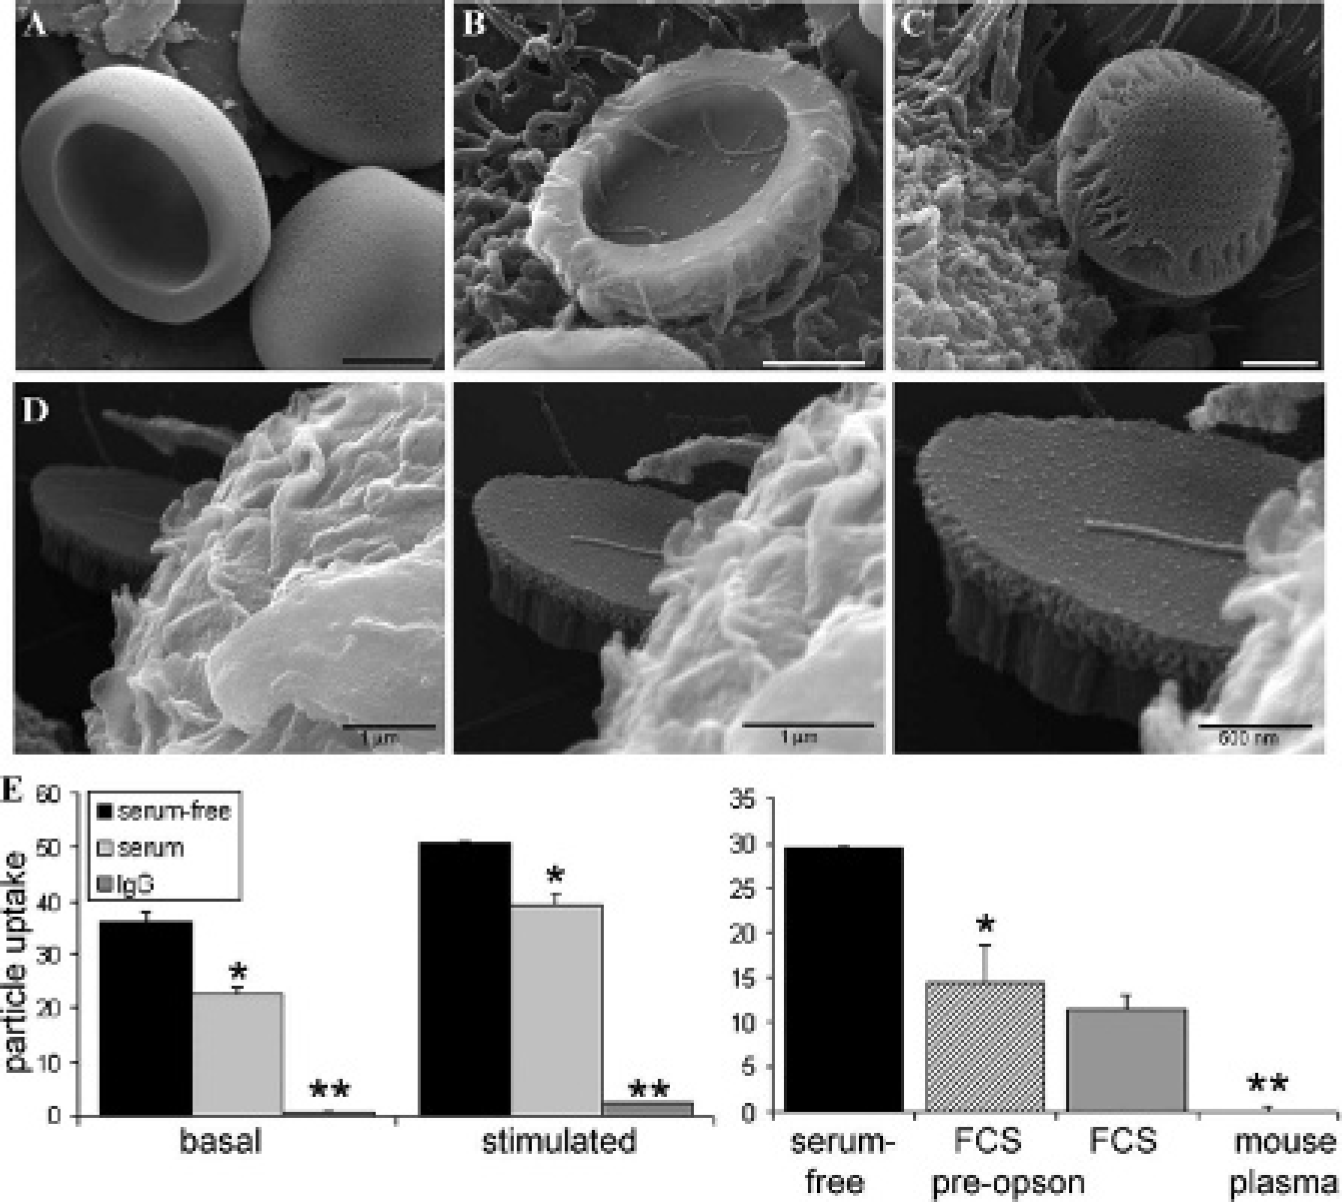
In vitro cellular associations with porous silicon microparticles. A–C, Two shapes of porous silicon microparticles, quasihemispherical (A and B) and discoidal (C), are shown in scanning electron micrographs (bars = 1 μm). D, Scanning electron micrographs of a cell internalizing a discoidal silicon microparticle at increasing magnification. E, Left: Impact of serum protein binding and proinflammatory cytokines (stimulated) on endothelial association with anionic silicon microparticles (adapted from Serda and colleagues 15 ). Right: Endothelial association with anionic silicon microparticles in medium containing plasma or fetal calf serum (FCS), with and without preopsonization of microparticles.
Microparticle Characterization and Serum Opsonization
Verification of microparticle surface modification was obtained using FTIR spectroscopy (Figure 2A). Oxidized microparticles exhibited a broad peak at 3,350 cm−1, indicating the presence of hydroxyl units. Aminosilylation of the microparticles introduced a broad peak near 3,400 cm−1 owing to –NH stretching, thereby supporting surface modification with amine groups. The presence of surface amines on aminosilylated microparticles was also demonstrated by detection of amines using a 4-NBA colorimetric assay (Figure 2B). One milliliter containing 2 × 10⁷ APTES-modified microparticles had an amine density of 0.35 ± 0.004 mM.
The zeta potential, an indicator of surface charge, of silicon microparticles in the oxidized and aminosilylated states was −19.45 ± 0.45 and 27.86 ± 0.45 mV, respectively, in phosphate buffer, pH 5.0 (Figure 2C). Incubation of microparticles with fetal bovine serum (FBS) across three temperatures for 30 minutes resulted in near-neutral surface charges for both oxidized and aminosilylated microparticles in phosphate buffer at pH 5.0, with no major alterations caused by incubation at different temperatures.
At physiologic pH (7.4), oxidized and APTES-modified microparticles had surface potentials of −25.7 and 6.3 mV, respectively. Exposure to IgG resulted in both subsets having similar, negative surface charges (Supplemental Figure 3A). Unlabeled IgG displayed a greater affinity for anionic compared to cationic (APTES) microparticles, based on flow cytometry measurements that compared binding of a secondary fluorochrome-labeled antibody to particles in the presence and absence of unlabeled primary antibody (Supplemental Figure 3B). Based on data showing that binding of the labeled secondary antibody (negatively charged) to unlabeled anionic microparticles was low, we assumed that binding of the labeled secondary antibody to particles, following incubation with the unlabeled primary antibody, was predominantly due to antibody-antibody interactions, providing quantitative insight into unlabeled antibody-particle interactions.
As reported previously, at physiologic pH, the surface charge of serum opsonized microparticles is negative for both oxidized and aminosilylated silicon microparticles. 15 In contradiction to the belief that cationic particles enhance interactions with cell surfaces based on affinity to negative gylcocalx moieties, these data argue against surface charge as the explanation for selective endothelial binding and uptake of originally cationic microparticles.
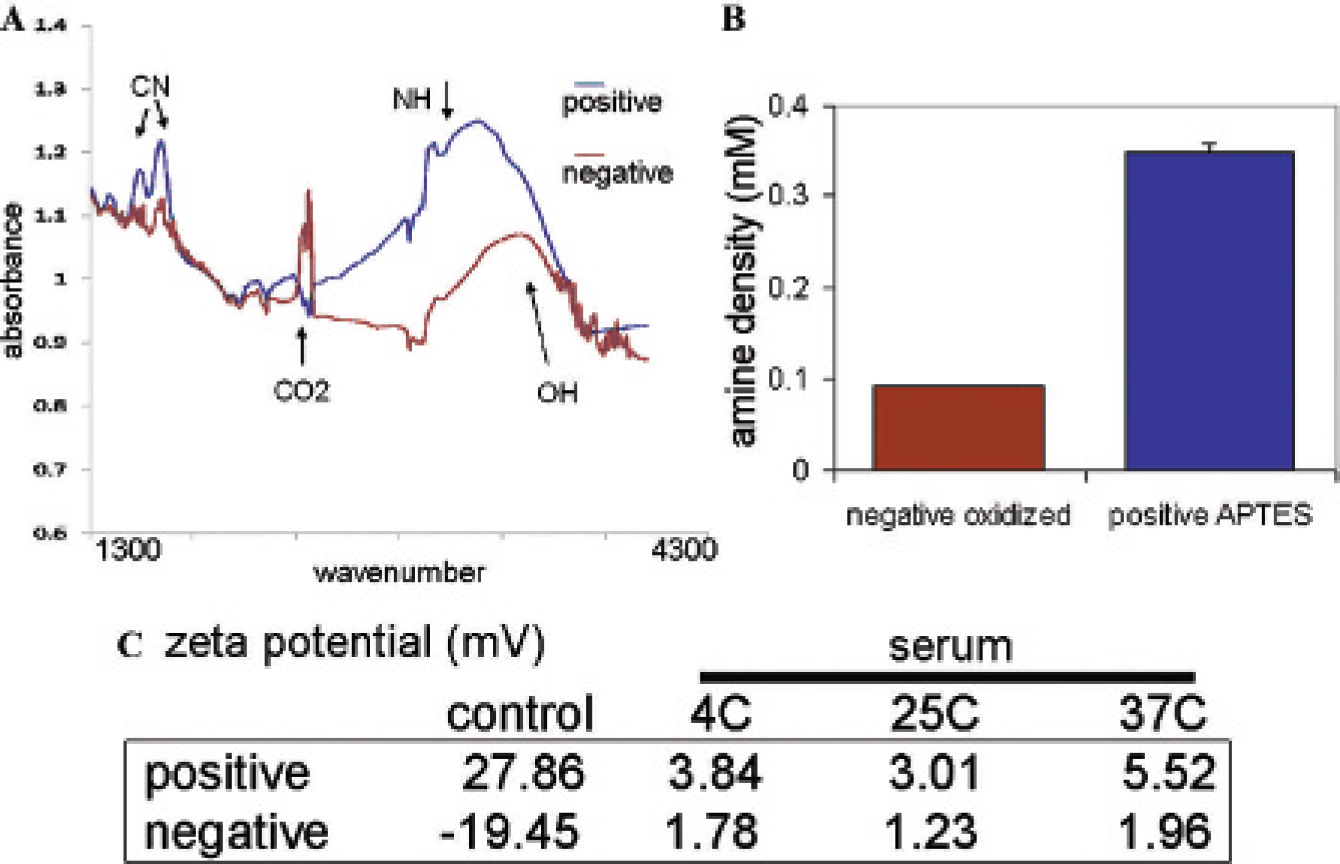
Characterization of silicon microparticles. A, FTIR analysis of positive (APTES) and negative (oxidized) silicon microparticles. B, Amine density on discoidal microparticles before and after APTES modification. C, Zeta potential analysis of silicon microparticles before (control) and after incubation in serum at different temperatures for 30 minutes.
Biodistribution of Cationic and Anionic Microparticles
A murine 4T1 model of breast carcinoma was used to study the biodistribution of silicon microparticles 24 hours after tail vein injection with 1 × 10⁸ discoidal silicon microparticles (Figure 3A). The study included three groups: vehicle control, cationic silicon microparticles, and anionic silicon microparticles (n = 3 per group). ICP-AES analysis of silicon content (ng silicon/mg tissue) in excised tissue showed low levels of microparticles in tumor, kidney, and lungs. Anionic silicon microparticles were found in liver and spleen at similar concentrations (9.8 and 10.6, respectively), whereas cationic silicon microparticles showed preferential accumulation in the spleen compared to the liver (35.5 and 17.8, respectively; p < .02; n = 3). The spleen had significantly more cationic microparticles compared to anionic microparticles (p < .002). Although the reported lung accumulation of both cationic and anionic microparticles is low in this study, microparticle manipulations that cause aggregation increase lung accumulation drastically and make the lung the major organ for microparticle accumulation (data not shown). Our presented data are consistent with findings reported by Liu and colleagues, in which hydrogel microparticles (1–5 microns) rapidly clear from the lung, whereas nanoparticles (20–40 nm) have prolonged lung retention. 16
To determine if in vitro cell type-specific interactions also occurr in vivo, we examined the impact of particle surface presentation on in vivo associations with endothelial cells and macrophages (Figure 3B). Liver and spleen tissues, harvested 24 hours after microparticle injection, were labeled with antibodies specific for macrophage scavenger receptor (CD204) and for endothelial CD34. In the spleen, silicon microparticles were predominantly located in the splenic cords and did not appear to associate with either endothelia or macrophages. Silicon microparticles were associated with macrophages in the liver, regardless of original surface chemistry; however, cationic microparticles were also found in association with hepatic vascular endothelial cells.
Based on ICP-AES data (see Figure 3A), accumulation of silicon microparticles was low in the lungs and tumor, despite high macrophage content. Immunohistochemistry analysis of tissues from mice injected with fluorescein isothiocyanate-labeled silicon microparticles (anionic) supported heavy uptake by liver macrophages, with low macrophage uptake in the spleen and lungs (Figure 4A). Thus, it appears that tissue-specific macrophages differ in their binding affinities for opsonized microparticles. This specificity may be driven in part by unique repertoires of cell surface receptors expressed by each macrophage tissue subtype. Tissue TEM images show both cationic and anionic silicon microparticles inside liver macrophages (Figure 4B).
Cellular associations in hepatic blood vessels and sinusoids were examined by SEM 1 to 2 hours after injection of anionic microparticles. Figure 5 (top left) shows a scanning electron micrograph of an open blood vessel (pseudocolored in red) surrounded by hepatocytes (green). The upper right image shows a red blood cell in the opening of a sinusoid. In the lower micrographs, anionic silicon microparticles (blue) can be seen attached to the vascular wall (shown at two magnifications). Cellular pseudopodia can be seen engaging the microparticles.

Tissue biodistribution and cellular associations with silicon microparticles. A, ICP-AES analysis of silicon content in tissues following intravenous injection of saline or microparticles, either positive or negative. B, Histologic evaluation of in vivo microparticle association with macrophages (CD204 positive, DAB staining) and endothelial cells (CD34 positive, DAB staining) in liver and spleen based on surface charge (bars = 10 μm). Arrows are used to help locate microparticles.
Hepatic tissue from mice injected with cationic silicon microparticles is shown in Figure 6. The boxed region of the blood vessel (top left image) is progressively magnified in the subsequent images. Among white blood cells is a cationic silicon microparticle. Cellular competition for the microparticle is seen between an endothelial cell (shown below the microparticle) and cellular constituents lining the vessel wall (seen above the microparticle). In the pseudocolored image, endothelial cells are shown in red, lymphocytes in green, and the silicon microparticle in blue. Higher magnification images, showing detailed cellular interactions with both cationic and anionic silicon microparticles, are presented in Figure 7.
Identification of Serum Components Selectively Binding to Silicon Microparticles
Silicon microparticles with opposable surface charges were incubated with murine plasma for 30 minutes, followed by washing with PBS and removal of bound proteins using a protocol adapted from the National Cancer Institute's National Characterization Laboratory (<www.ncl.cancer.gov>). Proteins were separated by 2DGE and following automated spot detection proteins with normalized spot volumes with a greater than ± 25-fold difference between the two populations (Figure 8) were subsequently robotically picked and trypsin digested, and peptide masses were identified by MALDI-TOF. Using these criteria, 11 proteins were identified, all displaying higher selectivity for cationic microparticles (Table 1). The proteins fell into three categories: (1) Ig light-chain V region; (2) α-fibrinogen polypeptide; and (3) complement component 1. Spots with the same protein ID area common occurrence and may represent posttranslational modification, including proteolysis.
Anionic microparticles were less selective in protein binding. None of the proteins eluted from the microparticles had spot volumes that differed by more than nine fold from the cationic population. Although not strikingly greater, there was selective binding of apolipoproteins A and E on anionic microparticles (see Figure 8, spots 6 and 7), with 1.8- and 3.9-fold greater binding (analysis of variance 0.962 and 0.218, respectively).

Tissue-specific uptake of silicon microparticles by macrophages. A, Histologic evaluation of in vivo microparticle association with macrophages (CD204, DAB staining) from liver, lung, and spleen (100X oil immersion lens; bars = 10 μm). B, Tissue transmission electron micrographs showing silicon microparticles internalized by hepatic macrophages (Kupffer cells). Each tissue is presented at 10 and 60 k magnification (bars 10 = μm [left] and 1 μm [right]).
Discussion
Particle surface charge influences the extent and specificity of binding to serum proteins, which further regulates cellular associations and biodistribution. In vitro endothelial associations of anionic silicon microparticles are significantly reduced in the presence of plasma proteins or pure IgG. Conversely, cationic silicon microparticles continue to adhere to and be internalized by endothelial cells in the presence of serum. This is consistent with findings by Thurston and colleagues, who demonstrated that cationic, but not anionic, neutral, or sterically stabilized, liposomes associate with the luminal surface of tumor endothelial cells and are subsequently internalized. 17 Krasnici and colleagues also reported selective accumulation of cationic liposomes on vascular endothelium. 18
We identified three categories of proteins absorbed to cationic silicon microparticles: α-fibrinogen polypeptide, Ig light-chain variable region, and complement component 1. α-Fibrinogen polypeptide, a component of fibrinogen, is a blood-borne glycoprotein composed of three pairs of polypeptide chains. It is 644 amino acids and approximately 79 kDa. Various cleavage products of fibrinogen regulate cell adhesion and spreading, making fibrinogen-coated components likely candidates to regulate adhesion of particles to specific cell populations. Fibrinogen nanoparticles are reported to be internalized by L929 (murine fibroblast) cells, 19 supporting a role for fibrinogen components in cellular adhesion and uptake.
Complement fragments bound to microorganisms promote leukocyte chemoattraction and phagocytosis. Various cell types have specific receptors for complement, with CR1 being the best characterized. C1 is a complex of three molecules, C1q, C1r, and C1s. C1r and C1s are proteases, whereas C1q (460 kDa) binds to antigen-bound antibody via the Fc region, promoting binding to phagocytes. 20 Association of antibody and complement components to cationic silicon microparticles may thus favor interaction with professional phagocytes (ie, macrophages), whereas binding to nonprofessional phagocytes (ie, endothelial cells) may be mediated by the diverse combination of opsonins bound to the particle surface. The abundance of Ig and fibrinogen components adsorbed to cationic microparticles may also reflect nonspecific entrapment of abundant serum components accompanying particle aggregation, which was observed during the PBS wash steps following incubation of cationic silicon microparticles with plasma.

In vivo imaging of hepatic blood vessels and sinusoids. Scanning electron micrographs of murine hepatic tissue slices following injection of silicon microparticles. A, An open blood vessel surrounded by hepatocytes pseudocolored in green. B, A red blood cell in the opening of a sinusoid. C-D, Two silicon particles (pseudocolored in blue) engaged by cellular constituents lining the vessel wall.

In vivo cellular interactions with discoidal porous silicon microparticles. Microparticles were injected intravascularly into nude mice, followed 2 hours postinjection by vascular perfusion and tissue collection. The boxed region of the hepatic blood vessel in the upper left image is show at increasing magnification in the succeeding scanning electron micrographs, (left to right bars = 400, 30, 10, 5, 2 μm). A silicon microparticle is shown near the center of each image and is displayed in blue in the final image.

In vivo cellular interactions with silicon microparticles. High magnification scanning electron micrographs show diverse cellular constituents competing for a cationic silicon microparticle (left) and engagement of an anionic (oxidized) silicon microparticle by cells lining the vascular wall (right).

2DGE analysis of particle binding proteome. A, Eluted proteins from oxidized microparticles. B, Eluted proteins from APTES-modified microparticles. Spot key: 1, 3, 5, 13, 15 = Ig light-chain V region (clone 17s.2); 2 = complement component 1q, C chain; 4, 10, 11, 12 = α-fibrinogen, polypeptide isoform 2; 6 = apolipoprotein E; 7 = apolipoprotein A; 8 = anti-double-stranded DNA immunoglobulin light-chain V region; α-fibrogen, polypeptide isoform CRA b; 14 = complement component 1q, B chain.
It has been reported that “neutral” particles in serum have an outer protein corona consisting of fibrinogen, IgG, and albumin. 21 As just stated, both fibrinogen and Ig variable light chain were abundantly present on cationic silicon microparticles (albumin binding was not significantly different for the two particle surface variants). The zeta potential of unbound cationic silicon microparticles at pH 7.4 is approximately 6 mV. The low charge density may reflect the porous nature of the microparticles, which may render the APTES-modified microparticles more similar to neutrally charged particles than their nonporous counterparts. In contradiction to this finding, we also showed by flow cytometry that IgG is preferentially adsorbed to anionic microparticles, or perhaps the data indicate that binding of unlabeled IgG to anionic microparticles orients the antibody in such a way that the secondary fluorescent antibody binds more readily than it does to IgG-bound cationic microparticles. Atomic force microscopy (AFM) analysis of porous silicon chips incubated with pure IgG, demonstrates binding of IgG to both cationic and anionic porous silicon (Supplemental Figure 1 and Figure 2). The presentation of immunoglobulin on the silicon chips is dissimilar and supports unique antibody binding orientations. Presentation of the Fc portion of the antibody on microparticles would be expected to inhibit uptake by endothelial cells, which express few or no Fc gamma receptors. 15 A second explanation for the discrepancy in the data is that less IgG may bind to anionic microparticles in the presence of competing serum components.
Proteins that bind to anionic microparticles include apolipoproteins A and E. Apolipoproteins bind to lipids to aid in their transport in the bloodstream and to provide an anchor to low-density lipoprotein (LDL) receptors on target cells. Apolipoprotein A ranges in size from 419 to 838 kDa, 22 whereas apolipoprotein E has 200 amino acids and is approximately 35 kDa. 23 Apolipoprotein E consists of two domains, a lipid-associating domain and a globular domain containing the LDL receptor binding site. 24 The latter site is arginine rich and may aid in the binding of apolipoprotein E to anionic silicon microparticles. The presence of apolipoprotein E on the surface of anionic silicon microparticles may thus aid in the delivery of microparticles to the liver.
Summary of Selected Protein Spot Performance

ANOVA = analysis of variance; MS = mass spectroscopy.
Immunohistochemistry images of liver and spleen following intravascular administration of microparticles supported phagocytic uptake of both microparticle formulations by liver macrophages, as well as selective association of cationic microparticles with hepatic endothelial cells. We demonstrated a greater uptake of cationic microparticles in the spleen compared to the liver. This may reflect lower levels of uptake of cationic, compared to anionic, microparticles by Kupffer cells in the liver and greater interaction with other classes of cells, including vascular endothelial cells. Scanning electron micrographs support competition of different classes of phagocytic cells for cationic silicon microparticles. We have also demonstrated that, despite high macrophage content in the lungs, microparticles predominantly exist independent of lung macrophages and are present in low abundance. Based on these results, as well as the low tumor accumulation of microparticles, it appears that macrophage uptake of silicon microparticles is predominantly restricted to liver Kupffer cells and macrophages that migrate to the liver. Mechanisms that lower Kupffer cell uptake of microparticles may result in strategic localization of microparticles extracellularly, permitting sustained release of secondary nanoparticles and, ultimately, therapeutic and/or imaging agents.
Conclusion
Microparticle surface charge and serum opsonization of particles play a major role in cellular associations, internalization, and biodistribution. Engineering drug delivery vectors for selective binding to serum components represents a mechanism to potentially direct cellular interactions and thus mass transport of therapeutic agents, as well as imaging agents and theranostics.
Footnotes
Acknowledgments
We thank the silicon fabrication team, including Xuewu Liu, Ciro Chiappini, Jean R. Fakhoury, and Jeff Schmulen, at The University of Texas at Austin for preparing porous silicon microparticles. We also thank Jianhua Gu for AFM studies on IgG-bound porous silicon chips.
Financial disclosure of authors: This research was supported by grants DODW81XWH-07-1-0596 and DODW81XWH-09-1-0212 from the Department of Defense; NNJ06HE06A from NASA; RO1CA128797 and RC2GM092599 from the National Institutes of Health; and BAA-HL-02-04 from the National Heart, Lung and Blood Institute (to J.E.W.) and The State of Texas Emerging Technology Fund. Commercialization rights on the intellectual property presented in this article have been acquired by Leonardo Biosystems Inc. from the title holder, the University of Texas Health Science Center in Houston. M. Ferrari is the founding scientist of Leonardo Biosystems, and hereby discloses a financial interest in the company. The other authors disclosed no potential conflicts of interest.
Financial disclosure of reviewers: None reported.