
Abstract
In this review, data on noninvasive imaging of apoptosis in oncology are reviewed. Imaging data available are presented in order of occurrence in time of enzymatic and morphologic events occurring during apoptosis. Available studies suggest that various radiopharmaceutical probes bear great potential for apoptosis imaging by means of positron emission tomography and single-photon emission computed tomography (SPECT). However, for several of these probes, thorough toxicologic studies are required before they can be applied in clinical studies. Both preclinical and clinical studies support the notion that 99mTc-hydrazinonicoti-namide-annexin A5 and SPECT allow for noninvasive, repetitive, quantitative apoptosis imaging and for assessing tumor response as early as 24 hours following treatment instigation. Bioluminescence imaging and near-infrared fluorescence imaging have shown great potential in small-animal imaging, but their usefulness for in vivo imaging in humans is limited to structures superficially located in the human body. Although preclinical tumor-based data using high-frequency-ultrasonography (US) are promising, whether or not US will become a routinely clinically useful tool in the assessment of therapy response in oncology remains to be proven. The potential of magnetic resonance imaging (MRI) and magnetic resonance spectroscopy (MRS) for imaging late apoptotic processes is currently unclear. Neither 31 P MRS nor 1 H MRS signals seems to be a unique identifier for apoptosis. Although MRI-measured apparent diffusion coefficients are altered in response to therapies that induce apoptosis, they are also altered by nonapoptotic cell death, including necrosis and mitotic catastrophe. In the future, rapid progress in the field of apoptosis imaging in oncology is expected.
THE CRITERIA USED TO DEFINE objective remission, stabilization, or progression of human malignancies following chemo- and/or radiotherapy are based on morphologic imaging and hence on volumetric changes (computed tomography [CT] or magnetic resonance imaging [MRI] based), with a significant reduction in volume usually ensuing at the earliest 2 to 3 months following effective treatment. During this period, non-responders suffer from unnecessary toxic side effects related to the treatment and at the same time are deprived of other potentially beneficial treatments. Accordingly, methods that allow for a more rapid assessment of response to chemo- and/or radiotherapy in cancer patients are warranted.
Apoptosis is a natural, orderly, and energy-dependent form of programmed cell death that causes cells to die without inducing an inflammatory response. Available preclinical and clinical data support the notion that many of the effects of radiotherapy and chemotherapy are mediated by rapid induction of apoptosis, peaking within the first 24 hours following treatment administration.1,2 Thus, a noninvasive imaging technique able to monitor baseline and therapy-induced apoptosis in real time could allow for assessment of response to chemotherapy and radiotherapy as early as 24 hours following treatment instigation.
Two main apoptotic pathways have emerged: the mitochondrial pathway (intrinsic pathway) and the death receptor pathway (extrinsic pathway). The intrinsic pathway is mediated by the Bcl-2 superfamily members that interact with the mitochondrial membrane, whereas the extrinsic pathway is governed by the tumor necrosis factor superfamily of ligands and receptors interacting at the cytoplasmic membrane. 3 Activation of either pathway implies activation of caspases, cysteine aspartate–specific proteases, which under normal conditions exist as inactive zymogens. Both pathways converge on the key enzyme caspase-3. 4 Following caspase-3 activation, the morphologic events of apoptosis quickly follow. One of the earliest biochemical events occurring during the apoptotic process is the externalization of phosphatidylserine (PS). 5 PS serves as a signal for the phagocytes to recognize and engulf the apoptotic bodies, without causing an inflammatory response. 6 Importantly, exposure of PS is not an exclusive apoptotic hallmark; viable myoblasts, megakaryoblasts, and necrotic cells also present PS at the cell membrane. Following PS externalization, cytoplasm shrinkage and deoxyribonucleic acid (DNA) degradation occur, followed by cell shrinkage, membrane blebbing, and fragmentation of the cell into apoptotic bodies (Figure 1). Degrading necrotic cells have PS on the inside of their cell membranes, which may also be a target for phagocytosis.7,8
This article reviews and discusses available data on cell death imaging in oncology using the various imaging techniques currently available as a function of the chronology of enzymatic and morphologic events occurring during cell death, as described above (Figure 2). Nuclear imaging techniques including positron emission tomography/single-photon emission computed tomography (PET/SPECT) are described in detail, whereas other imaging techniques are summarized because a detailed description of these techniques is beyond the scope of this review.
Imaging Early Apoptotic Events: Caspase Activation
Radiolabelled Caspase Substrates/Inhibitors
Caspases represent attractive targets because of their central role in the apoptotic pathway as both the death receptor and the mitochondrial pathway eventually converge at the efffector caspases. Until today, the use of radiolabeled caspase substrates/inhibitors has been limited to preclinical studies. No clinical data are yet available.
Prerequisites for imaging of caspase inhibitors include acceptable cell permeability, good solubility, and irreversible inhibition. Various caspase inhibitors have been radiolabeled for the purpose of apoptosis imaging.

In a viable, nonapoptotic cell, phosphatidylserine (PS), a membrane phospholipid, is normally confined to the inner leaflet of the cell membrane. In an early apoptotic cell, caspases become activated, PS becomes externalized, DNA fragmentizes, and chromatin condensation occurs. After the induction of apoptosis by an apoptotic signal, the apoptosome consisting of cytochrome c, released out of the mitochondria, and procaspase-8 and −9 are formed. Finally, the executioner caspases (caspase-3, −6, −7) are activated and the cell dies. The late apoptotic cell is characterized by cell shrinkage, membrane blebbing, cell fragmentation, and formation of apoptotic bodies.
Benzyloxylcarbonyl-Val-Ala-DL-Asp (O-methyl)-fluoromethyl ketone (Z-VAD-fmk), a pan-caspase inhibitor, was radiolabeled with 131I. Uptake measurements were performed in Morris hepatoma cells, which showed expression of the herpes simplex virus thymidine kinase (HSV-tk) gene. After treatment with ganciclovir, terminal deoxynucleotidyl transferase–mediated deoxyuridine triphosphate-biotin nick end-labeling (TUNEL) assay revealed 1.3 ± 0.3 and 23 ± 1.1% apoptotic cells immediately and 24 hours after therapy. 131I (Z-VAD-fmk) uptake was found to be twofold elevated immediately after the end of therapy, with no change during the first 4 hours. However, absolute 131I (Z-VAD-fmk) uptake was low, explained partly by adsorption to the well material, a general issue for peptides at low concentration, and by fetal calf serum interaction of 131I (Z-VAD-fmk). 9
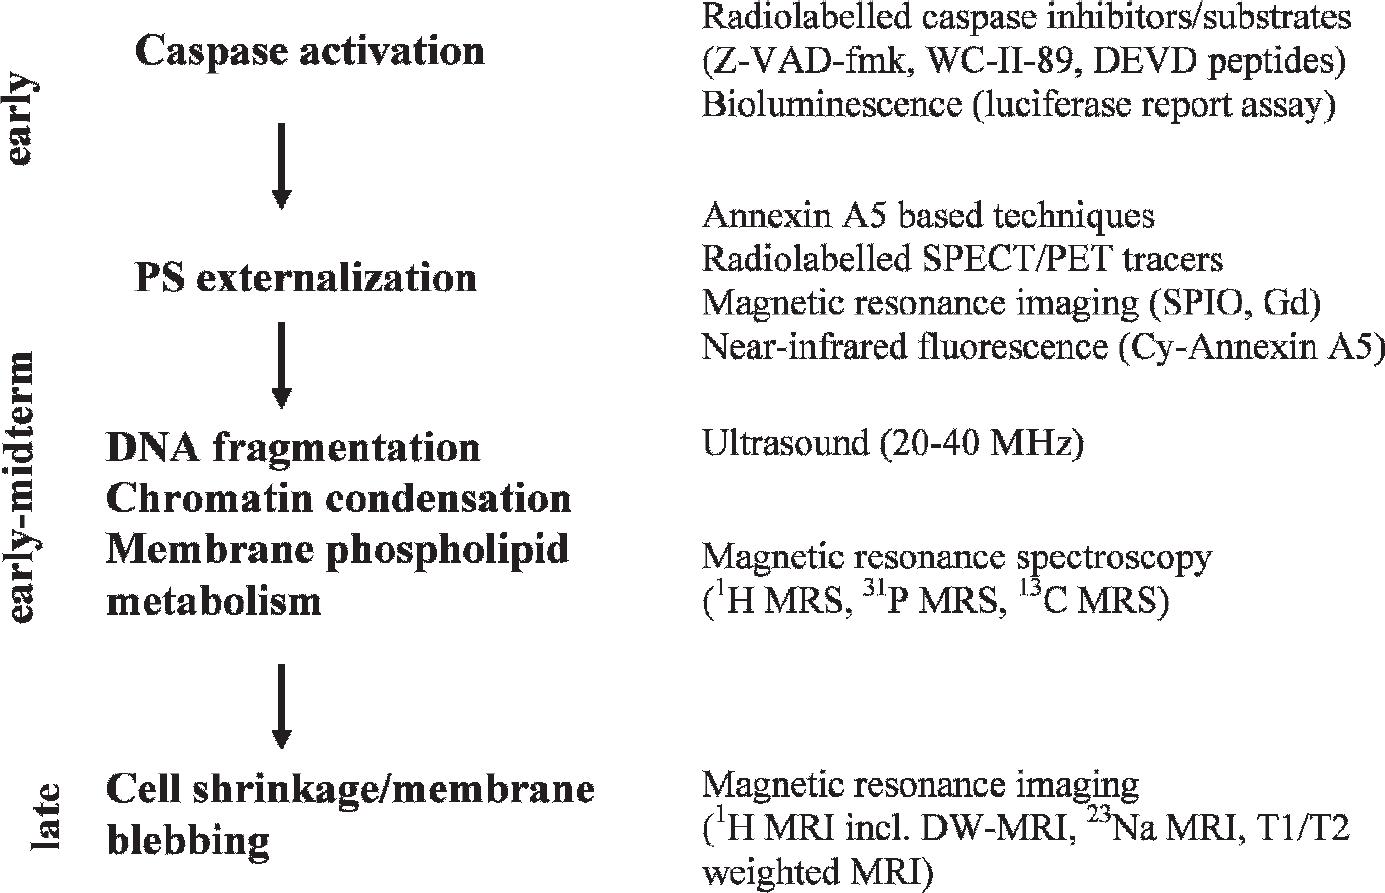
Various imaging techniques currently available as a function of the chronology of enzymatic and morphologic events occurring during apoptosis. Gd = gadolinium; PS = phosphatidylserine; SPIO = supermagnetic iron oxide.
The nonpeptide inhibitors isatin sulfonamide analogues possess nanomolar potency for inhibiting caspase-3 and caspase-7. The nonpeptidyl caspase inhibitor S-(+)-5-[(2-methoxy-methylpyrrolidinyl)sulfonyl] isatin 1 was radiolabeled with 18F, and biodistribution and small-animal PET showed rapid blood clearance, suggesting a potential role for this inhibitor for the in vivo detection of apoptosis. 10
Similary, the new isatin sulfonamide analogue WC-II-89 was radiolabeled with 18F. Biodistribution and caspase-3 activation with 18F-WC-II-89 were subsequently evaluated in a rat model of cycloheximide-induced liver apoptosis. 11 Biodistribution studies and microPET revealed a higher uptake of 18F-WC-II-89 in the liver and spleen of cycloheximide-treated rats when compared to control rats. 12 The effectiveness of two additional isatin analogues, the pyrrolidine analogue 11C-WC-98 and the azetidine analogue 18F-WC-IV-3, was recently investigated in the same rat model of cycloheximide-induced liver apoptosis. However, both isatin analogues did not discriminate between varying caspase-3 levels in vivo as well as 18F-WC-II-89. 13 18F-WC-II-89 may represent a better alternative for imaging apoptosis in tissues as it detects only apoptotic and not necrotic cells; however, further preclinical research is needed to investigate its role as a PET radiotracer for imaging apoptosis in cancer patients.
Caspase inhibitors have the intrinsic disadvantage of binding-site saturation. Therefore, caspase substrates that leave the active enzyme site after cleavage were developed. Ten radioiodinated 131I peptides containing the amino acid sequence Asp-Glu-Val-Asp (DEVD) sequence selective for caspase-3 were synthesized and evaluated for their uptake kinetics using an apoptosis test system. Jurkat cells were treated with staurosporine to induce apoptosis. Two radioiodinated peptides, Tat49-57-yDEVDG-NH2 and Tat57-49-yDEVDG-NH2, were favorably taken up by apoptotic cells when compared to control cells. 14
Bioluminescence Imaging
A recombinant luciferase reporter molecule has been developed that, when expressed in nonapoptotic mammalian cells, has attenuated levels of reporter activity. However in apoptotic cells, a caspase-3-specific cleavage of the recombinant product occurs, resulting in the restoration of luciferase activity, which can be detected in living animals with bioluminescence imaging (BLI) (Figure 3).
D54 (human glioma) cells that stably express the recombinant luciferase reporter were inoculated subcutaneously in athymic nude mice and were imaged before and after tumor necrosis factor–related apoptosis-inducing ligand (TRAIL) or phosphate-buffered saline (controls) treatment using BLI. Induction of apoptosis using TRAIL resulted in a rapid increase (threefold) in photon counts derived from in vivo tumors compared to controls. 15 A similar reporter construct, ANLucBCLuc, was developed that constitutes a fusion of small interacting peptides, peptides A and B, with the NLuc and CLuc fragments of luciferase with a caspase-3 cleavage site (DEVD) between pepANLuc and pepBCLuc. During apoptosis, caspase-3 cleaves the reporter, enabling separation of ANLuc from pepBCLuc. On the other hand, interaction between peptide A and peptide B restores luciferase activity by NLuc and CLuc complementation (see Figure 3). Treatment of D54 glioma cells and mice carrying D54 tumor xenografts with temozolomide and perifosine resulted in induction of bioluminescence activity, which correlated with caspase-3 activation. Also, combination therapy of temozolomide and irradiation resulted in an increase in bioluminescence activity when compared to monotherapy. 16

A hybrid recombinant reporter molecule (ER-DEVD-Luc-DEVD-ER) was constructed wherein the activity of a reporter (luciferase) could be silenced by fusion with the estrogen reporter regulatory domain (ER). Inclusion of a protease cleavage site for caspase-3 (DEVD) between two domains allows for caspase-mediated activation of the reporter molecule after separation from the silencing domain (ie, ER). During apoptosis, most cells activate caspase-3, so apoptosis can be detected in a noninvasive way by using bioluminescence imaging. The ANLucBCLuc apoptosis imaging reporter constitutes the split luciferase (NLuc and CLuc) domains fused to the interacting peptides, peptides A and B (PEPA and PEPB), with an intervening caspase-3 cleavage motif (DEVD). In apoptotic cells, the reporter molecule is proteolytically cleaved by caspase-3, which enables the interaction between pepANLuc and pepBCLuc, restoring luciferase activity.
BLI is particularly well suited for imaging small animals, and because most cells selectively activate caspase-3 during apoptosis, this system can be used for imaging of apoptosis.
An overview of the (radio)ligands used for imaging early apoptotic events (caspase activation) is given in Table 1.
Imaging Phospholipid Reorganization: PS Externalization
Annexin A5 SPECT Radionuclides
One of the most successful and widely applied approaches in apoptosis imaging is based on the annexin A5–PS binding. Annexin A5 (36 kDa) is an endogenous human protein and binds in a calcium-dependent manner with nanomolar affinity to PS. PS externalization is one of the earliest events in the apoptotic cascade, does not depend on the apoptosis-inducing agent or cell type, persists until the cell death program is fully completed, and serves as an eat-me signal for phagocytes, which remove the apoptotic fragments. Annexin A5, therefore, is a sensitive marker of the early to intermediate phase of apoptosis. By labeling annexin A5 with fluorescent and radionuclide tags, detection and quantification of apoptosis in vitro and in vivo can be performed. However, annexin A5–based methods are not entirely specific for apoptotic cells, but also necrotic cells are detected at the time when the necrotic cell wall is permeable and PS-binding sites become accessible for annexin A5.
An overview of the (radio)ligands used for imaging phospholipid reorganization (PS externalization) is given in Table 2.
99mTc-HYNIC-Annexin A5
Preclinical data Blankenberg and colleagues derivatized annexin A5 with hydrazinonicotinamide (HYNIC) and coupled it to 99mTc before intravenous administration in animals.17,18 Biodistribution studies of 99mTc-HYNIC-annexin A5 in rats showed rapid clearance from the blood and the highest uptake in kidneys 30 minutes after injection. Anti-Fas antibody injection in BALB/c mice model and cyclophosphamide treatment of a transplanted murine B-cell lymphoma model resulted in a two- to sixfold increase in the uptake of 99mTc-HYNIC-annexin A5 at sites of apoptosis.17,19 To determine the optimal point in time for detection of apoptosis in vivo with 99mTc-HYNIC-annexin A5 after chemotherapy, rats inoculated with allogenic hepatoma cells were treated with a single dose of cyclophosphamide and 99mTc-HYNIC-annexin A5 was injected in the rats 4, 12, and 20 hours after the treatment. 20 The accumulation of 99mTc-HYNIC-annexin A5 in tumors significantly increased at 20 hours but not at 4 or 12 hours after a single dose of cyclophosphamide, which was consistent with the rate of apoptotic cells determined by TUNEL and caspase-3 immunostaining. 21
List of Radioligands Imaging Early Apoptotic Events: Caspase Activation
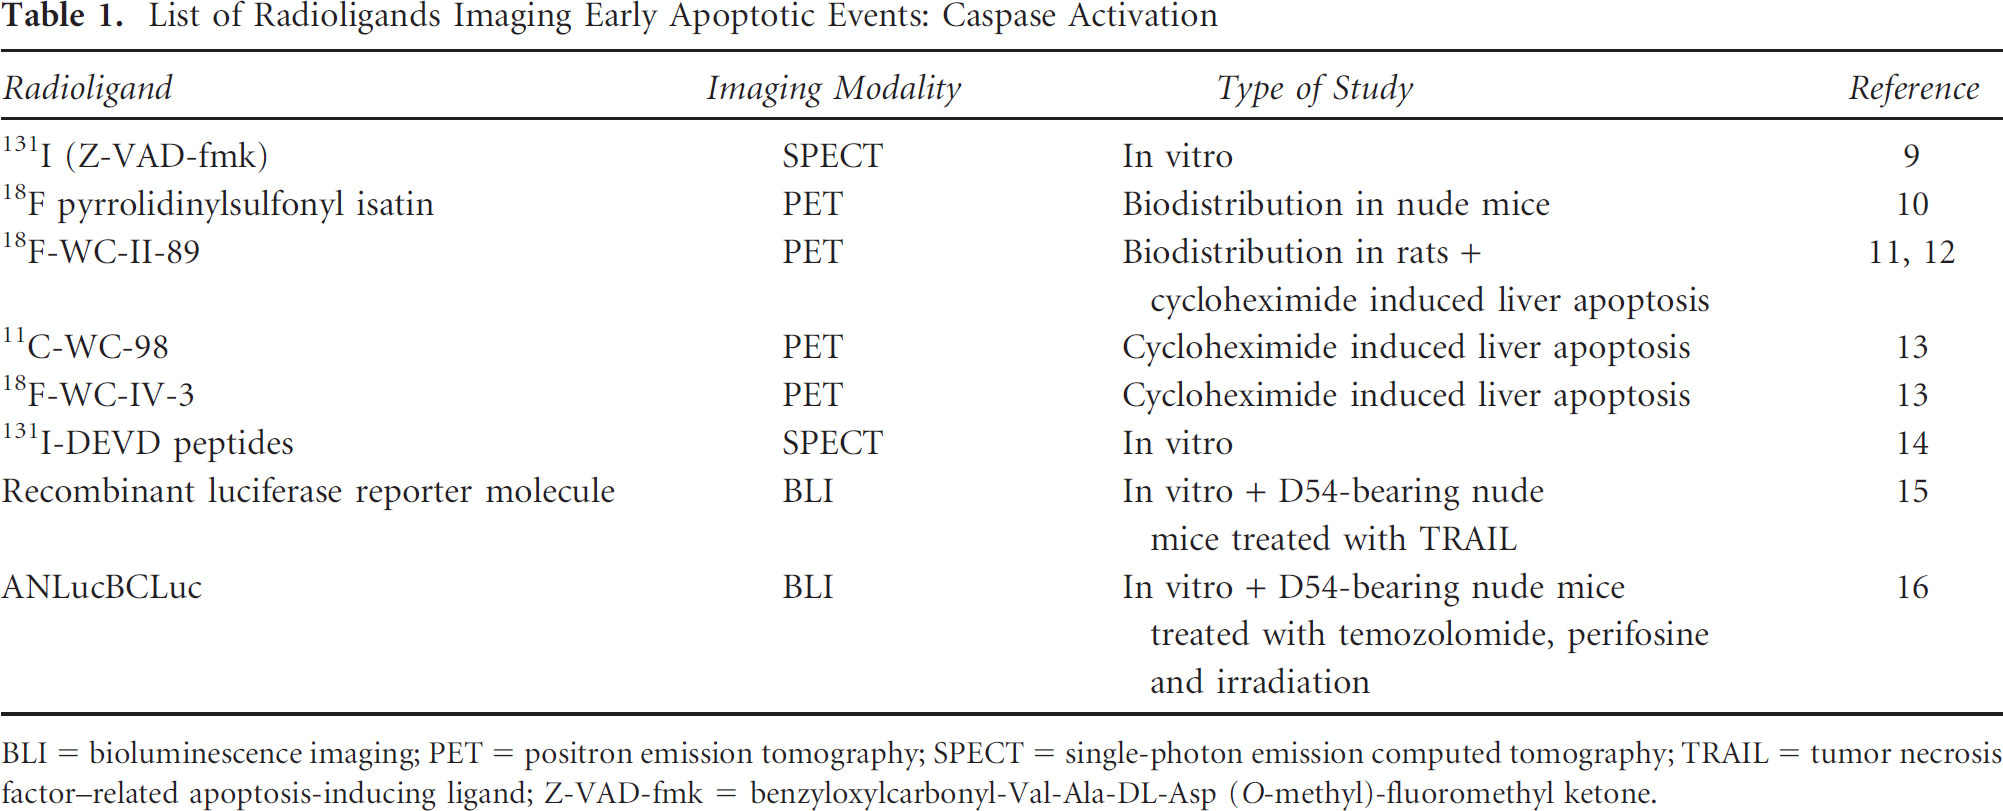
BLI = bioluminescence imaging; PET = positron emission tomography; SPECT = single-photon emission computed tomography; TRAIL = tumor necrosis factor–related apoptosis-inducing ligand; Z-VAD-fmk = benzyloxylcarbonyl-Val-Ala-DL-Asp (O-methyl)-fluoromethyl ketone.
Methodological Studies in Patients The safety, biodistribution, and dosimetry of 99mTc-HYNIC-annexin A5 in human volunteers were determined in a phase I study. Highest uptake was observed in the kidneys (30 minutes and 24 hours after injection). The liver and spleen also showed considerable uptake, whereas the gut showed no uptake even at 24 hours after injection (Figure 4). More than 90% of blood activity was cleared, with a short half-life of 25 minutes. 22 Several phase I/II studies subsequently evaluated the utility of 99mTc-HYNIC-annexin A5 for imaging of apoptosis in human patients. In a pilot study by Vermeersch and colleagues, in 18 patients suffering from primary head and neck cancer, 99mTc-HYNIC-annexin A5 imaging allowed visualization of all primary head and neck tumors identified by CT scan. 23 Involved lymph nodes were, however, not identified. In a comparable setup, 20 patients suffering from primary or recurrent head and neck carcinomas underwent 99mTc-HYNIC-annexin A5 tomography and subsequent surgical resection of the tumor. Quantitative 99mTc-HYNIC-annexin A5 tumor uptake correlated well with the number of apoptotic cells assessed by TUNEL assay performed on the tumor slides, if only samples with no or minimal amounts of necrosis were considered. 24 Intraobserver, interobserver, and day-to-day reproducibility of quantitative 99mTc-HYNIC-annexin A5 uptake measurements proved suitable for clinical applications. 25 Finally, to determine whether administration of chemotherapy interferes with quantitative uptake of 99mTc HYNIC-rh-annexin A5 in healthy human tissues 5 to 7 and 40 to 44 hours after treatment initiation, 11 cancer patients were investigated. Five cancer patients received no treatment (control group), and six cancer patients received chemotherapy and underwent 99mTc-HYNIC-annexin A5 scintigraphy pretreatment as well as 5 to 7 and 40 to 44 hours after treatment initiation. Prior administration of 99mTc-HYNIC-annexin A5 and chemotherapy did not interfere with quantitative specific uptake in healthy human tissue in the time schedule used. 26
Chemotherapy Response Monitoring In a series of 33 patients suffering from various malignant diseases and in a series of 16 patients suffering from non–small cell lung cancer scheduled for platinum-based chemotherapy or concurrent chemoradiation, chemotherapy-induced changes in tumor 99mTc-HYNIC-annexin A5 uptake calculated as maximum count per pixel and expressed as percentage to baseline value were compared to treatment response determined according to Response Evaluation Criteria in Solid Tumors (RECIST). A significant correlation was found between 99mTc-HYNIC-annexin A5 metabolic changes and treatment outcome in all studies.27–29 In a heterogeneous patient population receiving chemotherapy, changes in relative 99mTc-HYNIC-annexin A5 tumor uptake were evaluated at baseline and at 5 to 7 and 40 to 44 hours after treatment initiation. 30 Imaging results were related to clinical outcome, as defined by RECIST.
List of Radioligands Imaging Phospholipid Reorganization: Phosphatidylserine Externalization

BTAP = 4,5-bis(thioacetamido)pentanoyl; EC = ethylenedicysteine; 5-FU = 5- fluorouracil; HYNIC = hydrazinonicotinamide; MAG3 = mercaptoacetyltriglycine; PDT = photodynamic therapy; SPECT = single-photon emission computed tomography.

The biodistribution of 99mTc-HYNIC-annexin A5 in humans: high uptake in the kidneys, less uptake in the liver and spleen, and low uptake in the bone marrow.
Obtained results suggested that sequential 99mTc-HYNIC-annexin A5 imaging may allow for assessment of response to chemotherapy within 3 days after treatment initiation.
Radiotherapy Response Monitoring A radiation murine tumor model was established to evaluate the value of 99mTc-HYNIC-annexin A5 imaging in detecting early-phase apoptosis after single-dose irradiation and in predicting tumor response to radiotherapy. The 99mTc-HYNIC-annexin A5 uptake in E14 lymphoma significantly increased as the radiation dose escalated from 0 to 8 Gy and significantly correlated with the number of TUNEL-positive cells. 31 To evaluate the potential of 99mTc-HYNIC-annexin A5 scintigraphy for monitoring radiation-induced apoptotic cell death in humans, patients with follicular lymphoma underwent 99mTc-HYNIC-annexin A5 imaging before and after the last radiotherapy fraction of the 2 × 2 Gy involved radiotherapy regimen. Fine-needle aspiration cytology was performed on 5 consecutive days to determine the optimal time window for apoptosis detection. The increase in 99mTc-annexin A5 after 2 × 2 Gy on day 4 was concordant with the presence of apoptotic cells determined by cytology and correlated with clinical outcome. 32 In a more recent study, 99mTc-HYNIC-annexin A5 scintigraphy was performed before and within 48 hours following the first course of cisplatin-based chemoradiation in patients with head and neck squamous cell carcinoma. 99mTc-HYNIC-annexin A5 scintigraphy showed a radiation dose–dependent uptake in the parotid glands, indicative of early apoptosis during treatment. However, treatment-induced annexin A5 uptake did not predict outcome. 33 This finding suggests that cellular response to radiation is complex and that additional large-scale studies are needed to clarify the role of 99mTc-HYNIC-annexin A5 scintigraphy in predicting early radiotherapy response (illustrations of 99mTc-HYNIC-annexin A5 SPECT in human patients are given in Figure 5 and Figure 6).

A three-dimensional rendered image of the thorax (s = sternum) of a female patient with uptake of 99mTc-HYNIC-annexin A5 in a primary breast tumor (indicated by a black arrow).
99mTc-MAG3-Annexin A5
In an effort to decrease the high kidney and liver accumulation observed with 99mTc-HYNIC- annexin A5, annexin A5 was conjugated to mercaptoacetyltriglycine (MAG3). Biodistribution data in normal mice showed a significant decrease in kidney and liver uptake 1 hour postinjection. However, accumulation in the small intestine was fivefold higher than observed with 99mTc-HYNIC-annexin A5 at 1 hour postinjection. So, in conclusion, 99mTc-MAG3-annexin A5 showed a clear improvement in renal and hepatic clearance; however, owing to the increased radioactivity in the small intestines, imaging of ongoing apoptosis in the lower abdomen might be more difficult compared to99mTc-HYNIC-annexin A5. 34

A three-dimensional rendered image of the thorax (s = sternum) of a male patient with uptake of 99mTc-HYNIC-annexin A5 in a squamous tumor cell mass located above the clavicula (indicated by a black arrow).
99mTc-EC-Annexin A5
Another method to prepare 99mTc-labeled annexin A5 is the conjugation of ethylenedicysteine (EC) to annexin A5 using sulfo-N-hydroxysuccinimide and 1-ethyl-3-(3-dimethyl-aminopropyl) carbodiimide-HCl as coupling agents. The obtained yield of EC-annexin A5 is approximately 100%.
Preclinical Data Breast tumor–bearing rats were treated with paclitaxel to demonstrate in vivo cell apoptosis induced by chemotherapy. Significantly increased tracer uptake in tumors was observed 3 days after paclitaxel treatment; however, at day 5 posttherapy, tumor uptake was slightly lower compared to that for control animals not receiving therapy. 35
Clinical Data A preliminary clinical study of 10 breast cancer patients was performed with 99mTc-EC-annexin A5 to image tumor cells undergoing apoptosis. Five patients received induction therapy, consisting of paclitaxel in two patients; fluorouracil, doxorubicin, and cyclophosphamide in one patient; and bcl-2 antisense oligonucleotide therapy in the remaining two patients, 16 hours before the imaging session. Whole-body planar images were obtained at 0.5, 2 to 4, and 18 to 24 hours after injection. In nine patients, detectable 99mTc-EC-annexin A5 uptake corresponded to the area of palpable invasive disease. In patients receiving induction chemotherapy, the mean tumor to background ratio was higher than in those patients who did not receive chemotherapy (2.6 ± 0.5 vs 1.5 ± 0.2). 99mTc-EC-annexin A5 may therefore be a candidate to evaluate baseline levels of apoptosis, predict the efficacy of therapy based on the detection of treatment-induced apoptosis, and possibly predict disease progression and prognosis. 36
99mTc-BTAP-Annexin A5
The pharmacokinetics and imaging properties of 99mTc-(4,5-bis(thioacetamido)pentanoyl)-annexin A5 (99mTc-BTAP-annexin A5) were compared to those of 99mTc (N-1-imino-4 mercaptobutyl)-annexin A5 (99mTc-i-annexin A5) in healthy volunteers and in patients suffering from different malignancies. 99mTc-BTAP-annexin A5 proved to be the most stable, with good and reproducible labeling characteristics, and had the advantage of faster clearance from the body and lower radiation burden.37,38 However, although 99mTc-BTAP-annexin A5 may be produced with high radiochemical purity, the time-consuming and elaborate preparation makes it less suitable for clinical purposes. Finally, a relationship between 99mTc-BTAP-annexin A5 tumor uptake and treatment response (24–48 hours after the first course of chemotherapy) in patients with late-stage lung cancer and lymphoma was established by Belhocine and colleagues.39,40
99mTc-Annexin A5 Mutants
In an effort to develop improved annexin A5–based imaging agents, an endogenous chelation site (Ala-Gly-Gly-Cys-Gly-His) was added to the N-terminus of annexin A5 to create annexin V-128. Comparison of 99mTc-annexin V-128 with 99mTc-HYNIC-annexin A5 showed that 99mTc-annexin V-128 had an 88% lower renal uptake than 99mTc-HYNIC-annexin A5 at 60 minutes after injection. Mice were treated with the protein synthesis inhibitor cycloheximide to induce apoptosis. A several-fold increase in uptake of 99mTc-annexin V-128 in the liver and spleen was found, which correlated well with histologic analysis of the degree of apoptosis determined by TUNEL assay. 41
More recently, two different variants of the native annexin A5, called annexin B1 and Cys-annexin A5, were conjugated to 99mTc-HYNIC and evaluated as novel apoptosis imaging agents.42,43 Biodistribution studies revealed similar pharmacokinetics of 99mTc-HYNIC-B1 in mice when compared to 99mTc-HYNIC-annexin A5, high renal uptake, and no bowel excretion. Thymus uptake and hepatic uptake of 99mTc-HYNIC-B1 increased significantly after dexamethasone induction and Fas-mediated induction in mice, respectively. 42 The second-generation annexin A5, Cys-Annexin A5, was developed by incorporation of a cysteine residue into annexin A5 using site-specific mutagenesis, which allows site-specific conjugation of the HYNIC moiety and subsequent radiolabeling without interfering with the annexin A5–PS interaction. Biodistribution studies of 99mTc-HYNIC-Cys-annexin A5 in normal mice showed a pattern similar to that of the first-generation 99mTc-HYNIC-annexin A5 conjugates. There was a 257% increase in hepatic uptake of 99mTc-HYNIC-Cys-annexin A5 in a murine model of apoptosis when compared to control mice, indicating that 99mTc-HYNIC-Cys-annexin A5 may yield similar apoptosis imaging results when compared to the first-generation 99mTc-HYNIC-annexin A5. 43 To investigate the utility of the 99mTc-HYNIC-Cys-annexin A5 for the noninvasive detection of cell death in liver, spleen, and prostate, rats were treated with cycloheximide to induce cell death in the liver and spleen, whereas apoptosis in the prostate was induced by castration. Two hours following cycloheximide administration, a twofold and a fourfold increased accumulation of 99mTc-HYNIC-Cys-annexin A5 in the liver and spleen, respectively, over controls was observed, which correlated well with TUNEL-positive cells in the tissue sections. Despite the high levels of TUNEL-positive prostate epithelial cells following castration, no increase in 99mTc-HYNIC-Cys-annexin A5 could be seen. A possible explanation for the latter is the tighter organization of the capillary endothelial cells within the prostate, with the main apoptotic cell types being located behind this barrier. Moreover, a layer of smooth muscle cells, fibroblasts, and connective tissue provides an additional barrier between the target prostate cells and the circulation. 44
123I-Annexin A5
Preclinical Data Binding experiments with blood platelets demonstrated that 123I-annexin A5 binding was time and Ca2+ dependent and indicated that the radiotracer retained its biologic activity. 45 The biodistribution and dosimetry of 123I-rh-annexin A5 was evaluated in mice. 123I-rh-annexin A5 accumulated primarily in the liver, kidney, stomach, and lung. Clearance was predominantly urinary. 46 In vitro, the binding of 123I-annexin A5 to tipifarnib (a selective farnesyltransferase inhibitor and anti-tumor agent) –treated cells proved to be significantly higher than binding to vehicle-treated cells. In vivo, LoVo-inoculated athymic mice showed a 40% increase in 123I-annexin A5 uptake 8 hours after a single oral administration of tipifarnib as well as after 3 days of twice-daily treatments with the same dose. Ex vivo TUNEL assays confirmed the presence of apoptotic cells in both in vitro and in vivo experiments. 47 In an animal model of dexamethasone-induced apoptosis in the thymus, the degree of apoptosis was determined in the same animal at 6 and 11 hours after a single administration of dexamethasone by 123I-annexin A5 and by in vitro evaluation of the apoptotic index in the form of DNA fragmentation on tissue sections using in situ oligo ligation. 123I-annexin A5 uptake significantly increased in the thymus of rats 6 hours after dexamethasone administration and significantly decreased afterward. On the other hand, in situ oligo ligation demonstrated an increase in the apoptotic index at 6- and 11 -hour time points. 48
Clinical Data In humans, extensive bowel activity and rapid in vivo dehalogenation excluded the use of 123I-rh-annexin A5 for imaging apoptosis in a clinical setting. 46
111In DTPA-PEG-Annexin A5
Annexin A5 has also been labeled with 111In, which has a longer physical life (2.81 days) than 99mTc, making it possible to detect therapy-induced apoptosis over a prolonged period. Given that apoptosis is a dynamic process and apoptotic cells are engulfed by neighboring cells within hours, it has been suggested that increasing the interval between radiotracer injection and imaging would allow detection of apoptotic cells over a longer period in time, enhancing detection sensitivity.
Both polyethylene glycol (PEG) and diethylenetriamine pentaacetic acid (DTPA) were bound to annexin A5 and ovalbumin. PEG-modified proteins have been shown to exhibit reduced liver uptake and increased blood circulation half-lives. Mice bearing inoculated human mammary MDA-MB-468 tumors were treated with poly(
Annexin A5 PET Radionuclides
When compared to SPECT, PET offers higher resolution (spatial resolution is about two times better) and higher sensitivity and is more quantitative than SPECT. Additionally, PET accurately corrects for attenuation of photons emitted from the organ of interest, making PET images more accurate in reflecting the true activity of the tracer in the tissue. The disadvantages of PET include the higher cost and the necessity of a particle accelerator (cyclotron) for production of radionuclides such as 18F.
18F-Annexin A5
18F has been conjugated to annexin A5 via the compound N-succinimidyl-4[18F]-fluorobenzoate, [18F]FSB. [18F]FSB was subsequently shown to bind to apoptotic cancer cells in a fashion identical to that of fluorescein isothiocyanate (FITC)-annexin A5. 50 Stimulation of cancer cells with the chemotherapeutic agent etoposide for 6 hours showed an 88% increase in the binding of [18F]FSB when compared to control cells. 51 Also, apoptotic Jurkat T cells (apoptosis induced by ultraviolet irradiation) showed a 60% increase in 18F-annexin A5 compared to uptake in nonirradiated Jurkat T cells. 52 Pretreatment of rats with cycloheximide resulted in a three-to ninefold increase in 18F-annexin A5 in the livers of treated rats at 2 hours compared to those of control animals. Morphologic analysis and TUNEL assay confirmed the apoptotic levels. Biodistribution studies of normal rats showed the highest uptake of 18F-annexin A5 in the urinary bladder and kidney. After the bladder and kidney, organs with the highest uptake were the lungs, liver, and spleen. 53 However, owing to the short half-life of the isotope (110 minutes), relatively high starting amounts of radioactivity are required to obtain good images. The labeling method is also not yet fully standardized, so more research is required for this PET tracer to be used in patients.
64Cu-DOTA-Biotin-Streptavidin Annexin A5
In tumor-bearing mice, tumor apoptosis after photodynamic therapy (PDT) was visualized by PET using 64Cu-(1,4,7,10 tetraazacyclododecane-1,4,7,10-tetraacetic acid) (DOTA)-biotin-streptavidin, following pretargeting of apoptotic cells with biotinylated annexin A5. An avidin chase, after administration of the biotinylated annexin A5, was performed to eliminate free biotinylated products, thus increasing detection specificity and reducing blood background. PDT induces apoptosis by using phthalocyanine dyes as photosensitizers and red light. These dyes have been shown to act directly on tumor cells, causing rapid and extensive damage within the illuminated area. PET scans were recorded up to 13 hours after PDT and delineated apoptosis in the treated tumor as early as 30 minutes after tracer injection. A clear contrast between the treated tumor and the surrounding tissue was reached at 7 hours post-PDT. 54
124I-Annexin A5
Annexin A5 has also been radiolabeled directly and indirectly with the positron emitter 124I (half-life = 4.18 days, Emaxβ+ = 1.53, 2.14 MeV). Indirect labeling has been performed by the Bolton-Hunter method, by the prelabeled reagent N-succinimidyl 3-[124I]iodobenzoate ([124I]m-SIB), and by using [124I]N-hydroxysuccinimydil-4-iodobenzoate prepared by iodostannylation of N-hydroxysuccinimidyl 4-(tributylstannyl)benzoate (creating [124I]4IB).55
Glaser and colleagues iodinated annexin A5 directly by the chloramine-T method to produce 124I-annexin A5 and indirectly by the prelabeled reagent [124I]m-SIB. 56 In vitro studies using human leukemic HL60 cells stimulated with camptothecin showed a nonsignificant increase of 17% in directly labeled 125I-annexin A5 and a significant 21% increase in [125I]m-SIB, suggesting a reduced biologic activity of the directly labeled annexin A5.56 Jurkat cells treated with the anticancer drug camptothecin had a 7.5-fold higher 124I-annexin A5 uptake compared to untreated cells. A good correlation was found between radioactivity per cell and FITC-annexin A5 binding at different apoptosis levels (r = .93, p < .0001). 57 RIF-1 cells treated with 5-fluorouracil (5-FU) for 24 hours to induce apoptosis showed higher binding of 125I-annexin A5 and [125I]SIB-annexin A5 compared to control cells. The extent of binding was dependent on the concentration of 5-FU added. 58 Administration of anti-Fas antibody to BDF-1 mice resulted in significantly higher 124I-annexin A5 hepatic uptake compared to controls at 1 and 2 hours. PET images obtained at 2 hours after injection of 124I-annexin A5 in untreated and anti-Fas-treated mice revealed accumulation of the tracer in bladder and stomach in untreated mice, whereas treated animals had massive accumulation in the livers. Also, in vivo 124I-annexin A5 uptake derived from PET images correlated with histologically derived apoptotic density (r = .67, p < .001). 57 The same research group investigated imaging of apoptosis in vivo with [124I]4IB-annexin A5 made by using [124I]N-hydroxysuccinimydil-4-iodobenzoate prepared by iodostannylation of N-hydroxysuccinimidyl 4-(tributylstannyl)benzoate. In mice treated with anti-Fas antibody, [124I]4IB-annexin A5 accumulated in the liver; however, the difference in uptake between untreated and treated animals was not as clear as that previously demonstrated with directly labeled 124I-annexin A5. 59
Collingridge and colleagues also synthesized 124I-annexin A5 and [124I]SIB-annexin A5. 58 The uptake of [125I]SIB-annexin A5 by RIF-1 tumors growing in mice increased by 2.3-fold at 48 hours after a single injection of 5-FU compared to a 4.4-fold increase in TUNEL-positive cells. Uptake of the directly labeled 125I-annexin A5 did not significantly change in 5-FU-treated mice compared to control mice.
In 2005, 124I-maltose-binding protein (MBP)-annexin A5 was developed and evaluated in vivo. 60 Iodinated MBP and albumin were used as control proteins. Treatment with anti-Fas antibody prior to radiotracer injection clearly showed apoptotic hepatocytes by PET. Liver uptake of 125I-MBP-annexin A5 was nine times greater for mice treated with anti-Fas antibody than for untreated control animals, which was confirmed when 124I-MBP-annexin A5 was used as a radiotracer. Immunohistochemistry on liver sections taken from animals treated with anti-Fas antibody confirmed the presence of apoptotic cells.
Magnetic Resonance Imaging
Zao and colleagues labeled the first C2 domain of the protein synaptogamin I (C2A) with superparamagnetic iron oxide (SPIO) particles that serve as an MRI contrast agent. 60 Synaptogamin I is a PS-binding protein like annexin A5 but much smaller (14 kDa). SPIO-labeled C2A was shown to bind to the plasma membrane of EL4 and CHO-K1 cells, induced to undergo apoptosis, and in vivo when administered intravenously into drug-treated mice bearing EL4 tumors. 61
Schellenberger and colleagues cross-linked iron oxide nanoparticles with annexin A5 and demonstrated a dose-dependent signal intensity reduction in T2-weighted images of camptothecin-treated apoptotic Jurkat cells versus untreated controls in vitro. 62 As SPIO particles are detected by their effects on T2*, resulting in negative contrast, using MRI it is difficult to discern areas of apoptosis from other hypointensity regions in the tumor. In addition, SPIO particles are relatively large, which can limit access to and clearance from the tumor interstitium. Ionic gadolinium (Gd3+) contrast agents are both smaller and give increased signal intensities on T1-weighted MRI, making them easier to detect. In a recent study by Krishnan and colleagues, the affinity of Gd3+-C2A synaptogamin I for PS was demonstrated, and Gd3+-C2A synaptogamin I bound to apoptotic and necrotic cells but not to viable cells in vitro. 63 In vivo, EL4 tumor–bearing mice treated with a single intraperitoneal injection of etoposide or cyclophosphamide showed a greater accumulation of the PS-active contrast agent compared to control animals 24 hours after the injection of the PS-active contrast agent. Importantly, the magnetic field used in the study was much higher than the strength used in clinical applications, limiting the clinical relevance of the obtained results. Finally, Neves and colleagues used two biotinylated C2A domains of the protein synaptogamin I, which were complexed with a single avidin molecule labeled with gadolinium chelates. 64 MRI allowed detection of the apoptotic tumor cells in vitro. Low sensitivity of the MRI technique can be improved by contrast agents that give signal amplification. In this way, in vivo imaging of apoptosis in the clinical setting may occur in a sufficient and specific manner.
NIRF Imaging
As opposed to the green fluorescent reporter FITC, far-red and near-infrared fluorescent probes bear high tissue and blood transmittance and show low interference of the scattered light used for exciting fluorescence. Accordingly annexin A5 has been covalently conjugated with the near-infrared indocyanine fluorescent dye Cy5.5 (Cy5.5-annexin A5). Cy5.5-annexin A5 was used to image a 9L gliosarcoma constitutively expressing green fluorescent protein (GFP), and the CR8 variant of Lewis lung carcinoma (LLC) stably transfected with DsRed2 (a variant of the original red fluorescent protein, with improved solubility). The expression of GFP and DsRed2 provides an indication of tumor margins and thus a means of defining tumor-associated NIRF signal intensity. In both tumor models, active Cy5.5-annexin A5 tumor NIRF signal increased two to three times after cyclophosphamide treatment. In the 9L gliosarcoma model, active Cy5.5-annexin A5 bound to tumor cells and endothelial cells. 65 In a similar study performed by the same research group, an elevated tumor Cy5.5-annexin A5 ratio (tumor NIRF to background NIRF) was found in cyclophosphamide-chemosensitive LLC inoculated mice treated with cyclophosphamide compared to untreated animals, which correlated well with the number of apoptotic cells analyzed by TUNEL assay. 66
Finally, a 10-fold increase in fluorochrome concentration in cyclophosphamide-sensitive (CCL) and a 7-fold increase in cyclophosphamide resistant (CR-CLL) tumors compared to control studies was observed, which was consistent with the higher apoptotic index confirmed by TUNEL staining and histology. 67 These results were confirmed by Choi and colleagues 1 year later. 68 Recently, Cy5.5-labeled activity-based probes (ABPs) that covalently label active caspases in vivo have been developed and were tested in the thymi of mice treated with dexamethasone as well as in tumor-bearing mice treated with the apoptosis-inducing monoclonal antibody Apomab. A fluorescent probe (ABP50-Cy5.5) was developed with high selectivity toward caspase-3 and legumain and with virtually no detectible cathepsin B binding. Cross-reactivity with cathepsins is an important disadvantage of most caspase-based probes because of high constitutive expression of these cysteine proteases in liver, kidney, and spleen. In mice treated with dexamethasone, caspase-3 activity in the thymi was observable at 6 hours after treatment, peaking at 12 hours and then sharply dropping to background levels at 24 hours after injection. In the Apomab-treated mice, maximum caspase activity occurred 12 hours after Apomab treatment, as indicated by total fluorescent signals in the tumors, which closely mirrored levels of caspase-3 and caspase-7 measured by gel analysis. So these authors concluded that direct, noninvasive in vivo imaging of the kinetics of apoptosis has great value for clinical application, and the ABP can be used for this purpose. 69 However, the disadvantages inherent in planar imaging include lack of quantification, low penetration depth (< 1 cm), and an inability to accurately provide depth and size information.
Imaging Midterm to Late Apoptotic Events: DNA Fragmentation and Chromatin Condensation
An alternative detection method that allows real-time monitoring of apoptosis is high-frequency ultrasound imaging (HFUI, 20–40 MHz), based on acoustic waves. HFUI probes midterm to late apoptotic events, respectively, DNA fragmentation and chromatin condensation, which yield a six times higher ultrasound scatter when compared to nonapoptotic cells. Tunis and colleagues used HFUI (20 MHz) and demonstrated that this method can be used to monitor structural changes within a very low percentage of treated cells in a population, raising the possibility of using this technique in vivo for the monitoring of tumor response. 70 To determine whether HFUI could be used to detect apoptosis ex vivo, PDT-treated brain tissue was examined and compared to the nonirradiated contralateral side of an unfixed freshly excised brain. Backscatter amplitude measurements demonstrated an increase in ultrasound backscatter at 1.5, 3, and 24 hours in post-PDT brain areas compared to the controls. In an in vivo model, rats with photosensitized areas of their skin exposed to activating light (0, 8.5, and 17 J cm−2) were evaluated and an increase in ultrasound backscatter in the epidermis was observed that corresponded to the dose of activating light. 71 More recently, xenografted malignant melanoma tumor response to PDT was evaluated, and a time-dependent increase in ultrasound backscatter after treatment was observed. The increase in ultrasound backscatter correlated well with morphologic results, indicating an increase in apoptotic cell death, with a peak at 24 hours after PDT. 72 HFUI may be a highly effective and inexpensive tool for anatomic imaging; however, the inability to investigate deeply located tumor lesions and the inability to discriminate necrotic from apoptotic cells seem to make HFUI less appropriate for successful imaging of in vivo apoptosis.
Imaging Midterm to Late Apoptotic Events: Membrane Phospholipid Metabolism
Magnetic Resonance Spectroscopy
1H Magnetic Resonance Spectroscopy
The changes in the lipid structure and fluidity of the cell membrane that take place during apoptosis generate a number of small molecules (cytoplasmic lipid bodies, choline metabolites) that can be directly monitored by water-suppressed lipid lH MRS. Blankenberg and colleagues observed signals from mobile intracellular lipids and demonstrated a correlation between the intensity ratio of the 1.3 ppm CH2- (methylene) and 0.9 ppm CH3- (methyl) resonance and the fraction of apoptotic cells following induction of apoptosis by doxorubicin in Jurkat T cells. 73 This technique was also used to detect apoptosis in vivo in BT4C rat gliomas undergoing ganciclovir–thymidine kinase gene therapy–induced apoptosis and in a murine lymphoma in vivo model treated with chemotherapeutic drugs.74,75
Contrary to the findings by Blankenberg and colleagues, 73 Valonen and colleagues found a late-occurring decrease in the CH2/CH3 signal instead of the expected increase in the CH2/CH3 signal in apoptotic brain tumors derived from HSV-tk-transfected BT2C glioma cells. 76 Thus, 1H magnetic resonance signals from cytoplasmic lipids do not seem to be unique identifiers for apoptosis. To date, it is not known which factors contribute to the increase in the concentration of lipids. Also, it will be difficult to eliminate lipid droplet signals from the other sources in the surrounding tissue of the tumor cells. Further studies aimed at clarifying these issues are awaited.
31P Magnetic Resonance Spectroscopy
Many metabolites have been investigated as useful metabolic markers for apoptosis in vivo using 31P MRS. Only two metabolites, fructose 1-6-biphosphate (FBP) and cytidine diphosphocholine (CDP-choline), were found to selectively increase in apoptotic cells. FBP accumulates in the apoptotic cell owing to the accompanying activation of the poly-ADP-ribose polymerase (PARP), which uses oxidized nicotinamide adenine dinucleotide (NAD+) as a substrate. As a consequence of the depletion of NAD+, the glycolytic pathway becomes blocked and an accumulation of the upstream intermediate of the enzyme glyceraldehyde-3-phosphate, including FBP, occurs. Accumulation of CDP-choline in apoptotic cells occurs owing to the acidification that occurs early in the apoptotic process, which results in the inhibition of the enzyme cholinephosphotranferase and in the subsequent accumulation of its substrate, CDP-choline. 77 31P MRS measurements are relatively insensitive and lack temporal and spatial resolution as the signal owing to FBP was masked by the resonance of other phosphomonoesters. Moreover, it is unlikely that 31P MRS will be able to detect apoptosis in the tumor when the percentage of the apoptotic cells is relatively low, 78 which limits the use of these metabolites clinically.
13C Magnetic Resonance Spectroscopy
Recently, the introduction of dynamic nuclear polarization, which increases sensitivity in 13C MRS experiments by 10,000–fold, has allowed the detection of 13C labeled substrates in vivo. Lymphoma-bearing mice injected with hyperpolarized (1-13C) pyruvate showed a decrease in the flux of hyperpolarized 13C label between pyruvate and lactate in the reaction catalyzed by the lactate dehydrogenase after drug-induced (etoposide) cell death. 79
In general, MRS is significantly limited for in vivo imaging of apoptosis in patients by relatively low sensitivity and poor temporal and spatial resolution.
Imaging Late Apoptotic Events: Cell Shrinkage and Membrane Blebbing
Magnetic Resonance Imaging
1H Magnetic Resonance Imaging
Diffusion-weighted magnetic resonance imaging (DW-MRI) generates image contrast by using the diffusion properties of water within the tissue. Morphologic features associated with apoptosis, including cell shrinkage and membrane blebbing, induce changes in the apparent diffusion coefficient (ADC), which can be quantitatively measured. 80 The increase in water diffusion caused by apoptosis or necrosis occurs within 2 to 4 days, prior to visible changes in tumor morphology or size. An increase in ADC has been demonstrated in different animal tumor models in response to different kinds of apoptosis-inducing agents.81,82 In a recent study, 1H DW-MRI was used to assess early treatment response of death receptor 4 antibody TRA-8 in a mouse breast cancer model. ADCs were calculated and compared to tumor volume and living tumor cell changes. The ADC increase at day 3 was dependent on TRA-8 dose level and was significantly higher in the group receiving the highest dose of TRA-8 compared to the other groups, which received lower doses. The dose-dependent ADC increases were linearly proportional to the number of apoptotic cells and cleaved caspase-3 densities. The therapeutic efficiency of TRA-8 could be detected as early as 3 days by using ADC quantification, before changes in tumor dimension occurred. 83 However, 1H MRI–measured ADC is also altered in response to therapies that induce nonapoptotic cell death, including necrosis and mitotic catastrophe, and an increase in ADC can occur owing to these two ways of cell death in the absence of apoptosis. Therefore, changes in ADC measure the global cytotoxic response to chemotherapy and not just the apoptotic response to treatment. 84
23Na Magnetic Resonance Imaging
Weighted sodium MRI has also been evaluated to monitor rapid in vivo chemotherapeutic response. Because of the biologic importance of sodium and its relative abundance, sodium MRI is an interesting tool for the study of many pathophysiologic processes. In nude mice inoculated with human prostate cancer cells and treated with antineoplastic drugs (docetaxel or etoposide), a 36% ± 4% increase in weighted sodium images was observed 24 hours after administration of the therapy. Flow cytometry revealed that the elevation of intracellular sodium preceded cell death by apoptosis. 85 In a more recent study, using the same tumor model, docetaxel induced an increase in intracellular sodium MRI signal (of 30%) with decreased tumor size and an increase in fluorodeoxyglucose uptake compared to control tumors after 24 hours. 86
Relaxation (T1/T2) MRI
Sierra and colleagues investigated the possible use of longitudinal and transverse relaxations in the rotating frame (T1p and T2p, respectively) in rats bearing BT4C gliomas treated with HSV-tk gene therapy to induce apoptotic cell death. 87 These nuclear magnetic resonance tools were able to discriminate different treatment responses in tumor tissue from day 4 onward, and T1p and T2p appeared to be excellent tools to quantify early changes in water dynamics, reflecting treatment response during gene therapy.
In comparison with MRS, 1H MRI provides much better spatial and temporal resolution, along with very high sensitivity, and is therefore routinely used in clinical applications to measure volume reduction of a tumor. However, it may be difficult to distinguish cell shrinkage, necrosis, and other types of cell death that occur with cancer treatment.
Novel Apoptosis Tracers
Novel probes are being explored for their potency to image apoptosis in vivo, such as the ApoSense family, dansylhydrazone (DNFSH), and small peptides.
The ApoSense family, comprising low-molecular-weight apoptosis markers, is specifically designed for the imaging of cell death in vivo. The compounds do not cross the plasma membrane of an intact viable cell but selectively pass through the membrane and accumulate within the cytoplasm of apoptotic cells from the early stage of the apoptotic process. NST-732, a member of the ApoSense family, demonstrated selective and rapid accumulation within various cell types undergoing apoptosis. In vivo, lymphoma-bearing mice were subjected to radiotherapy and fluorescent NST-732 was intravenously administered. On induction of cell death by irradiation, a drastic increase in NST-732 uptake occurred. TUNEL staining showed that uptake of NST-732 and positive TUNEL staining were colocalized, confirming that the cells labeled with fluorescent NST-732 were indeed undergoing apoptosis. 88 A novel ApoSense family member, ML-9 (butyl-2-methylmalonic acid), based on an alkyl-malonate motif, was labeled with tritium (3H-ML-9) and was tested in vitro and in vivo. The tumors of control animals manifested low uptake levels of 3H-ML-9, whereas doxorubicin treatment caused a dramatic increase of 18-fold in tumor uptake levels of the tracer. The detection of three distinct hallmarks of apoptosis (DNA fragmentation, caspase-3 activation, and phospholipid scrambling) in the tumors in response to chemotherapy confirmed the association between the increased 3H-ML-9 uptake and chemotherapy-induced tumor cell apoptosis. 89 A promising ApoSense PET tracer for apoptosis is 18F-ML-10 (5-fluoropentyl-2-methylmalonic acid). It was first tested in small-animal PET for imaging of neurovascular cell death in an experimental cerebral stroke model. This radiotracer seemed to selectively detect apoptotic but not necrotic cells, and selective uptake was observed in the regions of interest of the infarct. 90 18F-ML-10 has proceeded to phase I/II clinical trials for molecular imaging of apoptosis, including one for the early assessment of response of brain metastases to radiotherapy. 91
DNFSH was developed and evaluated as a small molecule–based tracer for the in vivo imaging of apoptosis. 18F-DNFSH accumulates in the cytoplasm of apoptotic cells, whereas Alexa 488–labeled annexin A5 is bound on the outside of the cell membrane. Because of the promising in vitro results, 18F-labeled DNFSH was prepared and radiochemical yields of 50 to 60% were obtained. 92
To discover PS-binding peptides that can be used to image apoptosis, an M13 phage display peptide library was screened onto PS-coated enzyme-linked immunosorbent assay (ELISA) plates. The phage with the highest affinity-bound PS in ELISA carried the peptide TLVSSL. 93 Another peptide, with sequence CLSYYPSYC, was discovered, and tumor-bearing mice treated with a single dose of an anticancer drug (camptothecin) and fluorescein-labeled CLSYYPSYC peptide showed peptide homing to the tumor. This peptide represents a novel PS-recognizing agent and may be used in the future as a radionuclide or fluorophore probe to detect apoptosis in vivo. 94 The advantages of the novel probes (NST-732, 3H-ML-9, 18F-ML-10, and 18F-DNFSH) include the low molecular weight, which may be characterized by more favorable biodistribution and clearance. In addition, intracellular accumulation will provide higher signal to noise ratios compared to the annexin A5 probes, which bind to the periphery of apoptotic cells. However, the exact mechanism by which these probes targets the apoptotic cell membrane is not known, and high levels of injected material are needed, so further investigation is needed before some of the novel Apoptosis tracers become applicable in clinical trials.
Discussion
Various imaging techniques allow for noninvasive in vivo imaging of apoptosis: PET and SPECT, BLI, NIRF, and MRI.
PET and SPECT represent probably the most sensitive methods for molecular imaging of apoptosis. A broad range of clinical apoptosis-targeting probes are currently available: radiolabeled caspases, annexin A5, and, more recently, 18F-ML-10 and duramycin. Radiolabeled caspase inhibitors/substrates have been developed for PET and SPECT apoptosis imaging because of their central role in the early phase of the apoptotic process. Available in vitro and preclinical studies suggest that these radiopharmaceuticals bear great potential for apoptosis imaging by means of PET and SPECT. However, thorough toxicologic studies are required before they can be applied in clinical studies. A further crucial factor is the timing of scanning after the start of treatment. In fact, the time course of apoptosis may differ depending on a large variety of factors, including apoptosis-inducing factor, tumor type, drug concentration, and exposure time. Consequently, in the clinical setting, it is crucial to initially characterize the time course of radiolabeled annexin A5 uptake so that the peak of apoptosis is detected and early tumor response to therapy can be evaluated.
To date, PS is the most promising biomarker for measuring the extent of cell death as an early readout of efficacy of anticancer therapy. Annexin A5 is the ligand with the highest affinity for PS. It has been used in molecular imaging protocols to measure cell death in vitro and in vivo in preclinical and clinical studies. Experiences with annexin A5 have indicated that aspects such as biodistribution and target to background ratio require further improvement. An approach is to stick to annexin A5 and improve biodistribution and the target to background ratio by changing annexin A5's primary structure and the label that is coupled to annexin A5. The pretargeting strategy also shows promise to achieve better target to background ratios. At the clinical level, various studies support the notion that 99mTc-HYNIC-annexin A5 and SPECT allow for noninvasive, repetitive, quantitative apoptosis imaging and assessing tumor response as early as 24 hours after the start of the treatment. As PET offers higher resolution, higher sensitivity, and more accurate quantification when compared to SPECT, annexin A5 has also been labeled with 18F, 64Cu, and 124I. However, these labeling procedures proved laborious and time consuming, and the use of directly iodinated annexin A5 in a clinical setting has not proven to be suitable. More recently, attempts have been made to label annexin A5 with 68Ga for PET as the short half-life of this radionuclide (68 minutes) minimizes the radiation dose to the patient and allows for rapid sequential imaging. As opposed to 64Cu and 18F, 68Ga can be eluted from an in-house Ga/Ge generator, and labeling procedures with this metal are straightforward and with specific chelating agents are feasible at room temperature. As 68Ga behaves like 111In, the great potential of labeling chelators is already available. Preclinical and clinical studies using these agents are awaited.
A novel promising SPECT apoptosis imaging tracer that has recently been described is 99mTc-duramycin. Duramycin is the smallest known polypeptide of 19 amino acids and binds the membrane phospholipid phosphatidylethanolamine, which becomes externalized to the surface of apoptotic cells in a way similar to PS. The favorable in vivo imaging profiles of this new agent warrant further development and characterization. Another promising novel PET tracer for imaging of apoptosis is represented by 18F-ML-10 and has already proceeded to phase I/II clinical trials. However, the exact mechanism by which these probes target the apoptotic cell membrane is not known, and high doses are needed for imaging purposes. Consequently, further research is certainly recommended.
Although both BLI and NIRF have shown great potential in small-animal imaging, their usefulness for in vivo imaging in humans is limited to structures superficially located in the human body.
For the imaging of midterm to late apoptotic events such as DNA fragmentation and chromatin condensation, ultrasonography (US) has been performed. Recently, in 2008, the first preclinical tumor-based use of high-frequency ultrasound spectroscopy to noninvasively monitor tumor treatment in vivo took place. However, given that US cannot discriminate necrotic from apoptotic cells and is limited to superficially located tumors, it is questionable whether US will become a clinically useful tool in the assessment of therapy response.
The potential of MRS and MRI for imaging of late apoptotic processes is currently unclear. 1H MRS signals from cytoplasmic lipids do not seem to be a unique identifier for apoptosis. Although 31P MRS can selectively detect and characterize metabolites in tumors (such as FBP and CDP-choline), a unique cancer signature on MRS has not (yet) been detected. Moreover, owing to a lack of standardization, the technique is not yet reproducible across research facilities. DW-MRI has been used as an alternative method to image apoptosis in response to chemotherapy. However MRI-measured ADC is also altered in response to therapies that induce nonapoptotic cell death, including necrosis and mitotic catastrophe, and an increase in ADC can occur owing to these two ways of cell death in the absence of apoptosis. Also, MRI suffers from a low sensitivity, requiring bulk injection of apoptosis-targeting agents.
Finally, two novel unclassified tracers, ApoSense and the related compound named NST-732, were shown to accumulate in apoptotic cells by an unknown mechanism. Although both agents have shown promising features, further investigation with both probes is warranted to further unravel their mechanism of action and applicability in human studies for predicting therapy response.
Conclusion
During the past decade, a lot of progress has been made in the field of apoptosis research, and novel apoptosistargeted anticancer drugs have been developed. However, the entire mechanism behind the apoptotic cascade is still unknown, and, undoubtedly, new apoptosis markers will soon be revealed. In the future, rapid progress in this important and exciting field of clinical research may be expected.
Footnotes
Acknowledgments
Financial disclosure of authors and reviewers: None reported.