
Abstract
Gaussia luciferase (Gluc) is a secreted reporter, and its expression in living animals can be assessed by in vivo bioluminescence imaging (BLI) or blood assays. We characterized Gluc as an in vivo reporter in comparison with firefly luciferase (Fluc). Mice were inoculated subcutaneously with tumor cells expressing both Fluc and Gluc and underwent Flue BLI, Gluc BLI, blood assays of Glue activity, and caliper measurement. In Gluc BLI, the signal from the tumor peaked immediately and then decreased rapidly. In the longitudinal monitoring, all measures indicated an increase in tumor burden early after cell inoculation. However, the increase reached plateaus in Gluc BLI and Fluc BLI despite a continuous increase in the caliper measurement and Gluc blood assay. Significant correlations were found between the measures, and the correlation between the blood signal and caliper volume was especially high. Gluc allows tumor monitoring in mice and should be applicable to dual-reporter assessment in combination with Fluc. The Gluc blood assay appears to provide a reliable indicator of viable tumor burden, and the combination of a blood assay and in vivo BLI using Glue should be promising for quantifying and localizing the tumors.
BIOLUMINESCENCE IMAGING (BLI) using firefly luciferase (Fluc) as a reporter is applied to small-animal experiments for various purposes, and tumor monitoring is the most popular application.1,2 In vivo BLI is a highly sensitive, high-throughput technology, and its noninvasiveness allows the visualization of disease progression and the longitudinal assessment of therapeutic effects in given animals. Detected light signals serve as quantitative indicators of tumor burden, which has been validated in many tumor models.3–13
Dual-reporter imaging enables the evaluation of given disease model animals from two different aspects simultaneously. For example, the spatial relationship between tumor cells and effector cells and the relationship between the tumor cell number and signal transduction activity can be evaluated. Renilla luciferase (Rluc) is commonly used in combination with Fluc in dual-reporter imaging.
14
The substrates for Fluc and Rluc are
Gaussia luciferase (Gluc), another reporter applicable to in vivo BLI,15–18 causes a stronger light emission than Rluc after the addition of coelenterazine. Because it is naturally secreted from cells, blood or urine assays and in vivo BLI allow us to assess Gluc expression in living mice. Gluc appears to be superior to Rluc as an in vivo reporter, and the combination of Fluc and Gluc may be useful for dual-reporter assessment.
In this study, we compared BLI tumor monitoring using Fluc and Gluc. Mice were inoculated subcutaneously with tumor cells expressing Fluc and Gluc under the control of the same promoter and underwent Fluc BLI, Gluc BLI, and Gluc blood assays. Dual-reporter imaging requires comparable results for two reporters expressed in parallel. We aimed to characterize Gluc as an in vivo reporter and to evaluate the validity of dual-reporter imaging using Fluc and Gluc.
Materials and Methods
Cell Lines
The human colon cancer cell line HCT116 was cotransfected with both the Fluc and Gluc genes using a retroviral method described previously. 19 The Fluc and Gluc genes were excised from the pGL3-basic vector (Promega, Madison, WI) and pcDNA3/GL Vector (LUX Biotechnology, Edinburgh, UK), respectively. A clone was selected from cells expressing both genes stably and named HCT116-Fluc/Gluc. The cells were maintained in McCoy's 5A medium (Invitrogen, Grand Island, NY) supplemented with 10% fetal bovine serum (JRH Biosciences, Lenexa, KS) and 1% penicillin-streptomycin (Invitrogen). Both Fluc and Gluc were stably expressed under the control of the long terminal repeat of Moloney murine leukemia virus in these cells. Cell cultures were incubated at 37°C under 5% CO2.
Animals
Eight-week-old, female, severe combined immunodeficiency mice were inoculated subcutaneously in the shoulder with 1 × 10⁵ HCT116-Fluc/Gluc cells mixed with the same volume of Matrigel (BD Biosciences, San Jose, CA). The injection volume was 40 μL. Fur near the shoulder was removed with depilatory mousse before cell inoculation, and if necessary, fur regrowth was cut with scissors. The mice were obtained from CLEA Japan (Tokyo, Japan) and handled in accordance with the guidelines of the host institution. The experiments were approved by the committee for animal research at the institution.
Time Course of Bioluminescence after Substrate Injection
The time course of bioluminescence was evaluated for Gluc BLI using the intravenous injection of coelenterazine and Fluc BLI using the intravenous or subcutaneous injection of
For quantitative analysis, an elliptical region of interest (ROI) was placed over the tumor, and the total signal (photons/s) in the ROI was determined using Living Image software version 2.50 (Xenogen/Caliper Life Sciences). The same ROI was applied to all images acquired sequentially, and a time-intensity curve was generated. Peak time, the interval from substrate injection to peak of light emission, was determined from the curve. Half-time was also determined from the curves following the intravenous injection of coelenterazine or
Long-Term Tumor Monitoring
Mice bearing subcutaneous tumors underwent Fluc BLI, Gluc BLI, blood assays of Gluc activity, and caliper measurement of the tumor size to monitor tumor growth. The tumor burden was assessed in six mice 4, 7, 10, 14, 21, and 28 days after subcutaneous inoculation of HCT116-Fluc/Gluc cells. First, mice were intravenously injected with 2 mg/kg of coelenterazine, and immediately 1-second dorsal luminescent images were sequentially acquired at a rate of one image per 10 seconds for 4 minutes. Approximately 1 hour later, the mice were subcutaneously injected with 75 mg/kg of
The total signal in the ROI placed over the tumor was calculated, and the peak signal was determined from the time-intensity curve. In Gluc BLI, the area under the curve (AUC) in photons was also calculated for the first minute and the entire 4 minutes. For the Gluc blood assay, a circular ROI was placed over the well, and the total signal was determined. Tumor growth over days was assessed using the peak signal in Gluc BLI, the peak signal in Fluc BLI, Gluc blood signal, and tumor volume defined by the caliper measurement as indicators of tumor burden. The coefficient of variance (CV) was calculated for each indicator after logarithmic transformation using data obtained on a given day in the six mice. Relationships between two indicators of tumor burden were examined by Spearman rank correlation.
Results
Time Course of Bioluminescence after Substrate Injection
On the intravenous injection of coelenterazine into mice with subcutaneous tumors expressing both Fluc and Gluc, definite light signals reflecting Gluc activity were observed in the tumors (Figure 1). Intravenous or subcutaneous injection of
Following intravenous injection of coelenterazine, the bioluminescence signal immediately peaked and then rapidly decreased (Figure 2); the mean peak time was 26.3 seconds (range 23–33 seconds), and the mean half-time was 62.0 seconds (range 38.0–86.6 seconds). A slower time course was observed after intravenous injection of
Long-Term Tumor Monitoring
Subcutaneous tumor growth was assessed longitudinally using Fluc BLI, Gluc BLI, Gluc blood assays, and caliper measurement. All measures indicated an increase in tumor burden early after cell inoculation (Figure 3). However, the growth reached a plateau on day 10 for the peak signal on Gluc BLI and on day 14 for the peak signal on Fluc BLI. The signal obtained by the Gluc blood assay and the tumor volume determined by the caliper measurement increased during the entire observation period, although the increase was less evident for the Gluc blood assay on later days. The CV for the caliper measurement was very large on day 4 and gradually decreased (Figure 4). The CV was generally small for the Gluc blood assay and intermediate for Fluc BLI and Gluc BLI.
A significant correlation was observed between Gluc BLI and Fluc BLI peak signals (Figure 5). The Fluc BLI peak signal, Gluc BLI peak signal, and Gluc blood signal were significantly correlated with tumor volume, with the highest correlation for the Gluc blood signal followed by the Fluc BLI peak signal (Figure 6). The signal increase was less prominent for all three luciferase-based indicators than for the volume in large tumors, and such a discrepancy was less evident for the Gluc blood signal. For in vivo Gluc BLI, the 1-minute and 4-minute AUC were closely correlated with the peak signal (Figure 7).
Discussion
We performed tumor monitoring using Fluc and Gluc to characterize Gluc as an in vivo reporter in comparison with Fluc. We used a subclone of a tumor cell line that expressed Fluc and Gluc under the control of the same promoter to compare the two reporters while reducing the influence of confounding factors. Rapid light kinetics has been shown after the injection of coelenterazine into mice bearing Gluc-expressing cells.
21
In the present study, the time course of bioluminescence after substrate injection was initially evaluated in Fluc BLI and Gluc BLI. The intravenous injection of coelenterazine resulted in the most rapid time course, followed by the intravenous injection of

Bio luminescent images acquired after intravenous injection of coelenterazine (A) or
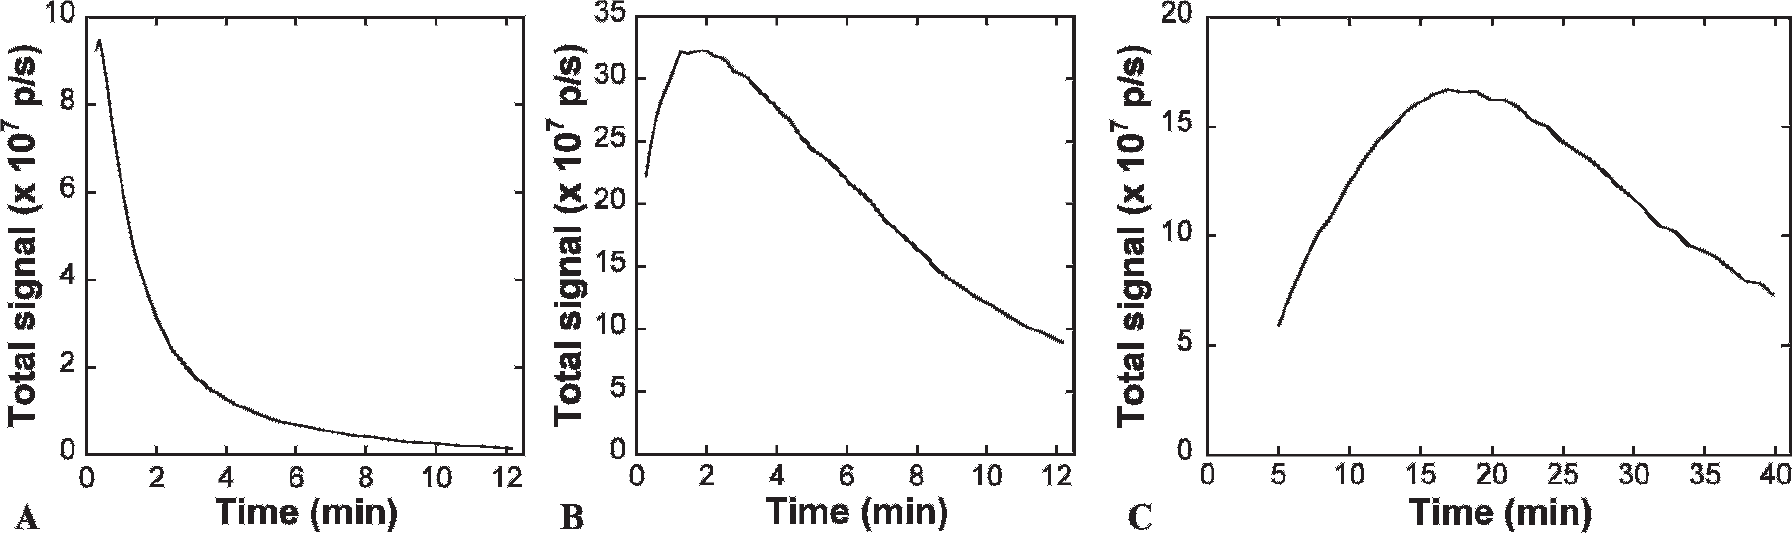
Representative time course of bioluminescence signals after the intravenous injection of coelenterazine (A), intravenous injection of

Results of longitudinal monitoring of the tumor growth. The peak signal on Gluc bioluminescence imaging (BLI) (A), peak signal on Fluc BLI (B), signal on the Gluc blood assay (C), and tumor volume by caliper measurement (D) were plotted for each mouse over days after the subcutaneous inoculation of HCT116-Fluc/Gluc.

Coefficient of variance calculated for each indicator of tumor burden after logarithmic transformation. BLI = bioluminescence imaging.
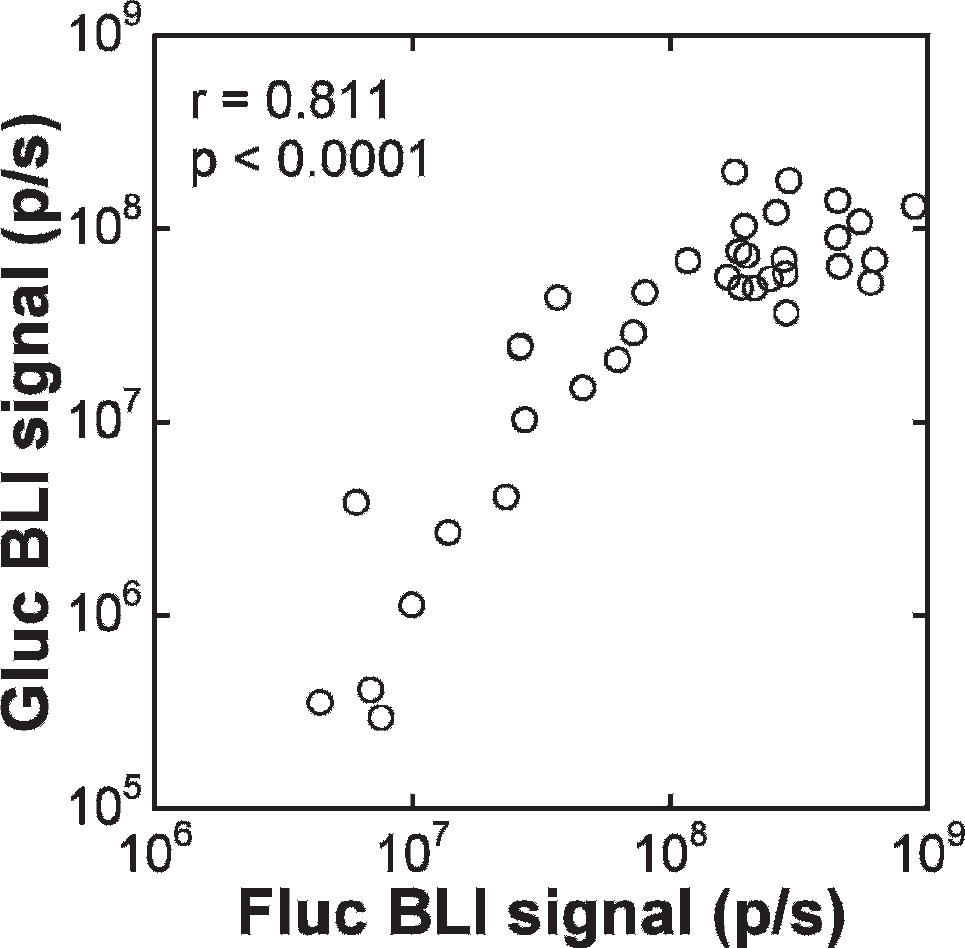
Relationship of the peak signals between Gluc bioluminescence imaging (BLI) and Fluc BLI. The r value indicates the Spearman rank correlation coefficient.

Relationships of the peak signal on Fluc bioluminescence imaging (BLI) (A), peak signal on Gluc BLI (B), and signal on the Gluc blood assay (C) with the tumor volume. The Spearman rank correlation coefficients are presented.
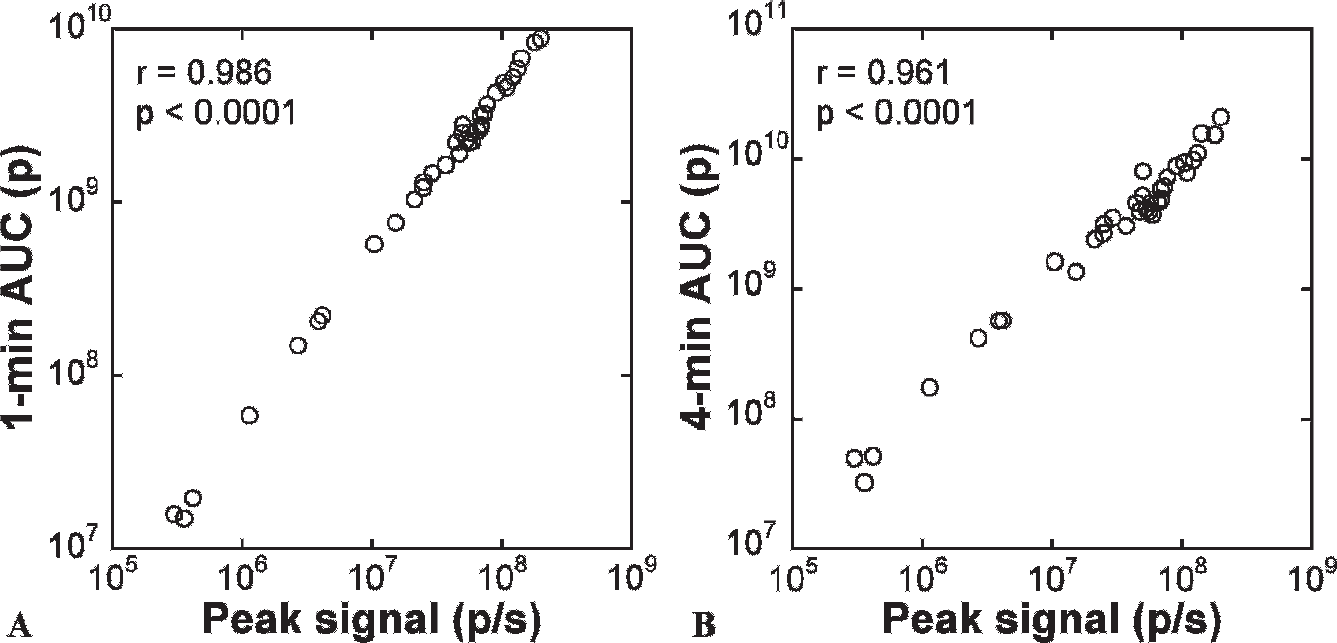
Relationships of the 1-minute (A) and 4-minute (B) areas under the curve (AUC) with the peak signal in Gluc bioluminescence imaging. The Spearman rank correlation coefficients are presented.
In the longitudinal monitoring, all measurements, including Fluc BLI, Gluc BLI, the Gluc blood assay, and caliper measurement, demonstrated tumor growth early after cell inoculation. A significant correlation was observed between peak signals of Fluc BLI and Gluc BLI, which supports the validity of dual-reporter imaging using Fluc and Gluc. However, signals in Fluc BLI and Gluc BLI reached plateaus despite a continuous increase in caliper volume, and a signal increase was not evident in large tumors. Similar discrepancies between tumor volume and in vivo BLI signals in advanced tumors have been reported using Fluc.10,26 Because BLI signals do not originate from the necrotic tissue and represent viable tumor volume selectively, an increase in necrotic fraction may be partly responsible for the observed discrepancy between BLI signals and caliper volume. However, the Gluc blood assay demonstrated a mild but continuous increase in signals, which suggests underestimation of viable tumor burden on Fluc BLI and Gluc BLI in large tumors. Light emitted from a viable cell may decrease in large tumors owing to poor supply of the substrate via blood flow. Moreover, tumor growth increases tumor height and, consequently, attenuation of light from the basal part of the tumor, which appears to contribute to the underestimation. The underestimation of tumor growth appears to be more severe for Gluc BLI than for Fluc BLI. The peak emission wavelength is 612 nm for Fluc at 37°C 27 and 480 nm for Gluc. 15 The shorter wavelength and consequent more profound tissue attenuation may be related to the predominant underestimation in Gluc BLI. Also, Gluc BLI signals may be susceptible to poor blood supply owing to the instability of coelenterazine.
The signals obtained by the Gluc blood assay increased throughout the observation period and were highly correlated with tumor volume estimated by caliper measurement. An increase in large tumors was less prominent for the Gluc blood signal than for caliper volume, despite general consistency between them. Although the Gluc blood assay may have underestimated the tumor burden in large tumors owing to depressed expression of Gluc, the caliper volume more likely overestimated the viable tumor burden by including the necrotic volume in large tumors. Chung and colleagues reported a similar discrepancy between the tumor volume and Gluc blood activity. 18 They demonstrated a reduction in viable fraction in large tumors histologically and concluded that the Gluc blood assay accurately reflects the amount of viable tumor cells. Although extensive comparison between Gluc blood activity and viable tumor volume remains to be done, the discrepancy observed in the present study may represent the superiority of the Gluc blood assay to caliper measurement. Furthermore, the CV calculated from the values obtained on a single day in the six mice was small for the Gluc blood assay. Because the CV is derived from the variation in tumor growth among mice and fluctuation among measurements, a larger CV in the same group of mice would be attributable to greater error in measurement. The small CV for the Gluc blood assay indicates a favorable reliability of the measurement. Caliper measurement is easy for large tumors but difficult for small tumors. Although we removed fur to facilitate caliper measurement, the CV was very large early after cell inoculation, indicating the difficulty of precise and reproducible caliper measurements. The superiority of the blood assay to in vivo BLI for the quantitative assessment of Gluc expression is supported by a report of the Gluc blood assay detecting tumor growth earlier than Gluc BLI. 18 The Gluc blood assay is convenient and appears to allow sensitive, reliable estimation of viable tumor burden irrespective of tumor size. It would be recommendable to quantitatively assess whole-body Gluc activity by the blood assay in combination with the localization of Gluc expression by in vivo BLI.
We measured Gluc blood activity using the CCD camera system for in vivo BLI and obtained favorable results. The use of the same instrument for in vivo BLI and blood assays improves convenience in experiments. Bioluminescence signals depend on temperature, and the stability of the temperature should be important to obtain reproducible results. The body temperature in mice drops under anesthesia,28,29 and the imaging table is usually warmed to prevent hypothermia. For in vitro measurement, we cooled the temperature of the imaging table to the level around room temperature to facilitate a constant reaction mixture temperature. Bioluminescence of Gluc shows flash-type kinetics in vitro, 15 and light signals decrease rapidly after mixing coelenterazine and Gluc. For in vivo Fluc BLI, the exposure time is usually adjusted depending on the light intensity. However, it should be noted that the prolongation of the exposure time leads to reduction in signals normalized for exposure time in both in vivo and in vitro Gluc measurement. The addition of detergent prolongs in vitro bioluminescence30,31 and may aid in improving flexibility of the measurement.
We acquired many images of 1-second exposure time to evaluate the time course of Gluc BLI signals after coelenterazine injection. A longer exposure time is needed to increase sensitivity for assessment of weak expression. We calculated 1-minute and 4-minute AUC to evaluate the effect of prolongation of the exposure time. The AUC were closely correlated with the peak signal, indicating that the AUC and the peak signal offer comparable information. These results justify the prolongation of the exposure time, although it does not cause a proportional increase in cumulative signals because of the rapid decrease in light emission.
The discrepancy between Gluc blood signals and caliper volumes in large tumors was most likely due to an increase in necrotic fraction. However, this was not confirmed owing to a lack of histologic assessment. The results of this study suggest the utility of the Gluc blood assay for quantitatively assessing the viable tumor burden, and investigation combined with histologic examinations is warranted. Magnetic resonance imaging allows noninvasive, separate measurements of the viable tumor volume and necrotic volume and thus would aid in evaluating the validity of the Gluc blood assay. We used subcutaneous tumors in this study, and each mouse had a single, superficial tumor. Chung and colleagues reported combined evaluation of metastatic tumors using the Gluc blood assay and Gluc BLI and demonstrated higher sensitivity of the Gluc blood assay than Gluc BLI. 18 They also showed comparable signals of Fluc BLI and Gluc BLI, although analyzed data were limited. Further investigation is warranted to validate and characterize Gluc assessments in deep or disseminated tumors. In the cells used in this study, Fluc and Gluc were expressed under the control of the same promoter; however, the amounts of Fluc and Gluc should have varied depending on the integration site. Our results suggest a significant correlation between Gluc and Fluc BLI signals and support the use of dual-reporter imaging using Gluc and Fluc. However, sophisticated regulation of gene expression is required to determine which offers stronger signals at the same level of expression.
Summary
We characterized Gluc as an in vivo reporter compared to Fluc using subcutaneous tumors expressing both reporters. The time course of bioluminescence after intravenous substrate injection was more rapid for Gluc than for Fluc, resulting in a shorter imaging time window. Both Gluc BLI and Fluc BLI allowed longitudinal monitoring of tumor growth, and signals were significantly correlated between them. However, underestimation of the viable tumor burden was suggested in large tumors. In contrast, the Gluc blood assay appeared to provide an excellent quantitative indicator of the viable tumor burden. Evaluation of Gluc activity using in vivo BLI and blood assays should be applicable to dual-reporter assessment in combination with Fluc BLI and may be superior to Fluc BLI for single-reporter assessment.
Footnotes
Acknowledgments
Financial disclosure of authors: Dr. Fugeng Sheng was supported by a Japan-China Sasakawa Medical Fellowship.
Financial disclosure of reviewers: None reported.