
Abstract
Microcalcification is a hallmark of breast cancer and a key diagnostic feature for mammography. We recently described the first robust animal model of breast cancer microcalcification. In this study, we hypothesized that high-resolution computed tomography (CT) could potentially detect the genesis of a single microcalcification in vivo and quantify its growth over time. Using a commercial CT scanner, we systematically optimized acquisition and reconstruction parameters. Two ray-tracing image reconstruction algorithms were tested: a voxel-driven “fast” cone beam algorithm (FCBA) and a detector-driven “exact” cone beam algorithm (ECBA). By optimizing acquisition and reconstruction parameters, we were able to achieve a resolution of 104 μm full width at half-maximum (FWHM). At an optimal detector sampling frequency, the ECBA provided a 28 μm (21%) FWHM improvement in resolution over the FCBA. In vitro, we were able to image a single 300 μm X 100 μm hydroxyapatite crystal. In a syngeneic rat model of breast cancer, we were able to detect the genesis of a single microcalcification in vivo and follow its growth longitudinally over weeks. Taken together, this study provides an in vivo “gold standard” for the development of calcification-specific contrast agents and a model system for studying the mechanism of breast cancer microcalcification.
BREAST CANCER is a common malignancy, accounting for 26% of all new cancer cases in women. 1 The 192,370 new cases of breast cancer diagnosed in the United States in 2009 will ultimately result in an estimated 40,170 deaths. 1 Given that survival is a strong function of disease stage at diagnosis, early detection is of paramount importance.
Despite multiple technical limitations, x-ray mammography presently remains the screening approach of choice. A key diagnostic feature for mammography, seen in 30 to 50% of women with biopsy-confirmed breast cancer, is microcalcification. 2 Whereas benign calcifications are typically composed of calcium oxalate, malignant calcifications are typically composed of hydroxyapatite (HA) deposited in specific patterns. 3 HA microcalcifications range in size from 100 μm single crystals to clusters up to centimeters in diameter. 4
To overcome the limitations of mammography, our group is developing calcification-specific diagnostic agents that have high sensitivity and high specificity for the HA calcium salt over all other calcium salts present in the human body.5–7 Given that this approach requires a robust and reproducible animal model, we created three different models of HA breast cancer microcalcification. 6 , 8 , 9 The newest model requires only a single intraperitoneal injection of recombinant bone morphogenetic protein 2 (rBMP-2) at 4 days after tumor cell implantation and produces microcalcifications in 100% of animals in a dose-and time-controllable fashion. 9
Armed with this animal model, the missing technology for diagnostic agent development is an in vivo “gold standard” to which newer HA-specific diagnostic agents can be compared. High-resolution computed tomography (CT) has the potential to provide such an internal gold standard, especially if it can be optimized to detect the genesis of a single breast cancer microcalcification and quantify its growth over time. Moreover, high-resolution CT would permit tumor biologists to study the mechanism of breast cancer microcalcification by separating the processes of calcium salt nucleation from crystal growth.
High-resolution CT scanners for small-animal imaging have been studied since the 1990s and have played a major role in molecular imaging.10–18 We hypothesized that optimization of a commercially available CT scanner might permit imaging and quantitation of single breast cancer microcalcifications in an animal model.
Materials and Methods
High-Resolution CT Scanner
CT images were acquired on a NanoSPECT/CT imaging system (Bioscan, Washington, DC) equipped with an 8 W microfocus x-ray source (Thermo, Scotts Valley, CA). It has a tungsten target at 40° with a cone beam x-ray and a 130 urn thick beryllium window to reduce the fluence of the low-energy window. The x-ray flux at 90 kVp is 27 Rem/min. The size of the focal spot is less than 9 urn at 8 W and less than 7 urn at 4 W. The system is capable of a range of tube voltages from 20 to 90 kVp, with a maximum tube current of 200 μA. The CT detection system consists of four complementary metal-oxide semiconductor sensors (Rad-icon, Sunnyvale, CA), each with a pixel array of 256 × 512 pixels (1,024 × 2,048 total) and a 48 urn pixel pitch, creating a total active area of 49.9 cm X 98.3 cm. The signal from each sensor is digitized to 12 bits. The acquisition software used was Nucline (Mediso, Budapest, Hungary).
Reconstruction Algorithms
All scanned data were reconstructed using two modified Feldkamp ray tracing algorithms that appropriately model the cone beam geometry 19 : the fast cone beam algorithm (FCBA) and the exact cone beam algorithm (ECBA). The FCBA defines a ray from the source through each voxel in the reconstructed field of view (FOV). The value of the projection data to be back-projected is determined via interpolation of data on the x-ray detector. The number of voxels set in the image reconstruction volume determines the number of rays. The ECBA defines rays from the pixels on the detector to the focal spot of the x-ray source. The value along the ray deposited in the voxel during back-projection is determined by the intersection of the ray and the voxel. The number of rays (sampling number) in the ECBA depends on the number of pixels X (sampling number) 2 . The schematics for each algorithm are shown in Figure 1. Reconstruction was performed using these algorithms as implemented in InVivoScope postprocessing software (Bioscan).

Computed tomographic (CT) reconstruction algorithms: schematics of the fast cone beam algorithm (FCBA; top) and the exact cone beam algorithm (ECBA; bottom), as detailed in Materials and Methods. Shown are the ray tracings from x-ray source to detector, along with their relationship to reconstructed voxels. Also shown are the CT detector binnings (for the ECBA) used to create various detector sampling frequencies.
Measurement of Maximum Resolution of Projected and Reconstructed Images
To measure the line spread function (LSF), a 12.7 μm diameter tungsten wire, oriented axially, was placed 10 mm transaxially from the center of the FOV to minimize any influence of potential center of rotation artifacts. A CT scan was performed at 45 kVp, 177 μA current, 3,000 ms/projection, 360 projections/rotation, and a detector pixel size of 48 μm. The total acquisition time was 18 min/scan. The modulation transfer function (MTF) of the projected image was calculated by performing a Fourier transform of the LSF. The MTF was calculated using the method developed by Melnyk and DiBianca. 20 Spatial frequency was measured at 10% of the MTF. Resolution was calculated using the full width at half-maximum (FWHM) of the projected image. Projection data were reconstructed using the aforementioned FCBA and ECBA. The sampling number (ie, sampling frequency, binning) of the ECBA was set to 1,2, 4, 6, and 8 (ie, ECBA-1, −2, −4, −6, and −8), corresponding to 1, 4, 16, 36, and 64 x-rays per detector pixel, respectively. A Shepp and Logan filter 21 was used during the reconstruction process for both the FCBA and the ECBA, and voxel size was set to 10 μm. The MTF and FWHM were obtained using a method similar to the one used for the projection image.
To evaluate the dependence of CT detector size on the resolution of the reconstructed image, the tungsten wire was scanned using detector pixel sizes of 48, 96, 192, and 384 μm. Additionally, to evaluate the dependence on voxel size, projection data obtained with a pixel size of 48 μm were reconstructed using either the FCBA or the ECBA with sampling numbers of 1, 2, 4, 6, and 8, with voxel size set to 10, 50, 100, 200, and 400 μm, respectively. The FWHM was measured on each projected and reconstructed image.
Measurement of Image Noise
A 21 mm diameter syringe phantom was filled with water and scanned to evaluate image noise. The phantom was placed in the center of the FOV. Image noise was evaluated by measuring the standard deviation (SD) of the averaged signal. A region of interest with a diameter of 15 mm was set at the center of the reconstructed image to measure the SD. The reconstruction was performed using either the FCBA or the ECBA, again with sampling numbers of 1, 2, 4, 6, and 8 and a Shepp and Logan filter. The following tests were performed:
Effect of CT Detector Pixel Size
CT scans were performed at 45 kVp, 177 μA current, 3,000 ms/projection, and 360 projections/rotation. The pixel size of the detector was set to either 48, 96, 192, or 384 μm. Projection data were reconstructed with a voxel size of 100 μm. The SD as a function of the pixel size of the detector was measured.
Effect of Exposure Time
CT scans were performed at 45 kVp, 177 μA, 360 projections/rotation, and a 48 μm pixel size. Exposure time was set to 400, 1,000, 1,500, or 3,000 ms/projection. Projection data were reconstructed by setting the voxel size to 100 μm. The SD as a function of the exposure time was measured.
Effect of Voxel Size on the Reconstructed Image
Projection data were scanned with the following parameters: 45 kVp, 177 μA current, 3,000 ms/projection, 360 projections/rotation, and a detector pixel size of 48 μm. Projection data were reconstructed by setting the voxel size to 10, 50, 100, 200, or 400 μm. The SD as a function of exposure time was measured, and the images were evaluated visually.
Imaging of a Single HA Crystal
A single HA crystal (catalog #391947, Calbiochem, La Jolla, CA) was scanned with the following parameters: 45 kVp, 177 μA current, 3,000 ms/projection, 360 projections/rotation, and a detector pixel size of 48 μm. The crystal was placed on an acrylic sheet with a thickness of 0.762 mm and immobilized with a drop of Fluoromount-G (Southern Biotech, Birmingham, AL). Spots of iodine-containing contrast (Renografin-60, Bracco Diagnostics Inc., Princeton, NJ) were used on the slide as fiducial markers. CT reconstruction was performed using the optimal parameters determined in preliminary studies (described below). Immediately after CT acquisition, a bright-field microscopy image was obtained and merged with the maximal intensity projection of the reconstructed CT image.
Syngeneic Rodent Model of Breast Cancer Microcalcifications
Animal experiments were conducted under the supervision of a protocol approved by the Institutional Animal Care and Use Committee. Female Fischer 344 rats were obtained from Taconic Farms (Germantown, NY). At the time of tumor cell inoculation, rats averaged 7 to 9 weeks of age and weighed 130 ± 20 g. R3230 syngeneic breast cancer cells were grown in Dulbecco's Modified Eagle's Medium (DMEM) (Mediatech, Inc., Manassas, VA) supplemented with 10% fetal bovine serum, 100 U/mL penicillin, and 100 mg/mL streptomycin; harvested; and suspended in DMEM for tumor cell implantation. Rats were anesthetized with isoflurane (2% in oxygen), and approximately 2 × 10⁷ cells in 0.3 mL DMEM were injected subcutaneously into the mammary fat pad. rBMP-2 was prepared as described in detail previously. 3 One hundred micrograms of rBMP-2 was administered as a single intraperitoneal injection to four rats bearing R3230 breast tumors 4 days following tumor cell implantation. 3
In Vivo and Ex Vivo Imaging of Rat Breast Cancer Microcalcifications
Animals were anesthetized with isoflurane (2% in oxygen) for imaging. Breast cancer-bearing rats were scanned daily by high-resolution CT beginning 12 days after rBMP-2 injection using a reconstruction voxel size of 50 μm. For both in vivo and ex vivo measurements, scan parameters were 45 kVp, 177 μA current, 3,000 ms/projection, 360 projections/rotation, and a detector pixel size of 48 μm, and reconstruction was performed using the optimal parameters determined in preliminary studies (described below). Rats were sacrificed 33 days postadministration of rBMP-2, and the tumor was excised and scanned ex vivo using varying reconstruction voxel sizes of 50, 100, 200, and 400 μm.
Results
Maximum Obtainable Resolution of Projected and Reconstructed Images
As shown in Figure 2 (top), the MTF curve of the projected image obtained using a 12.7 μm diameter tungsten wire exhibited a spatial frequency of 7.20 lp/mm at 10% of peak MTF. The FWHM of the projected image was 126 μm.

Maximum resolution of computed tomographic (CT) detector and reconstructed images. The modulation transfer functions (MTF; left) and line-spread functions (LSF; right) as measured during acquisition (top) and reconstruction (bottom) using a 12.7 μm diameter tungsten wire. CT acquisition parameters were 45 kVp, 3,000 ms/projection, and 360 projections/rotation. The exact cone beam algorithm (ECBA) reconstruction sampling number is defined in Figure 1.
The MTF and LSF curves of reconstructed images with a reconstruction voxel size of 10 μm, obtained using different reconstruction algorithms and sampling (ie, detector binning) numbers, are shown in Figure 2 (bottom). The resolution of the FCBA showed significant degradation compared to that of the ECBA. The spatial frequencies of the FCBA and ECBA with sampling numbers of 1, 2, 4, 6, and 8 were 5.90, 8.60, 8.41, 8.38, 8.33, and 8.17 lp/mm, respectively. The FWHM of reconstructed images obtained using the FCBA and ECBA with sampling numbers of 1, 2, 4, 6, and 8 were 132, 95, 96, 98, 99, and 99 μm, respectively.
The FWHM of projected and reconstructed images as a function of detector pixel size and reconstruction voxel size are shown in Figure 3. When the pixel size of the detector becomes small, the FWHM is dramatically improved. The resolution with a pixel size of 48 μm was improved by 568 μm over that with a pixel size of 400 μm (see Figure 3, left). The FWHM of reconstructed images as a function of reconstruction voxel size are shown in Figure 3 (right). The FWHM of ECBA-based reconstructions suggest higher resolution compared to the FCBA. This observation also occurs when the voxel size is smaller than 100 μm, albeit with a lower slope. The FWHM of reconstructed images at a reconstruction voxel size of 50 μm obtained using the FCBA and ECBA with sampling numbers of 1, 2, 4, 6, and 8 were 132, 103, 98, 104, 104, and 105 μm, respectively. Using ECBA-6, the FWHM were improved by 28 μm (21%) compared to the FCBA.

Full width at half-maxima (FWHM) of projected and reconstructed images. A, FWHM of a projected image as a function of detector pixel size. B, FWHM of a reconstructed image as a function of voxel size. The exact cone beam (ECB) algorithm reconstruction sampling number is defined in Figure 1. FCB = fast cone beam.
Measurement of Image Noise
The correlation between the SD of image noise and the detector pixel size is shown in Figure 4A. With both reconstruction algorithms, there is an inverse relationship between detector pixel size and SD. Specifically, the SD of the FCBA at a detector pixel size of 48 μm was significantly higher than the SD of the ECBA. The SD decreased by 52.7% when using ECBA-6 or ECBA-8. Figure 4B shows SD as a function of exposure time. As expected, when exposure time increases, the SD decreases. The SD was lowest at 3,000 ms/projection. Figur e4C shows SD as a function of the reconstructed voxel size. The SD was independent of voxel size for the FCBA but dependent on voxel size for the ECBA. When the voxel size was greater than 50 urn, the SD for the ECBA (with the exception of ECBA-1) was smaller than the SD for the FCBA. The SDs of ECBA-6 and −8 decreased by 20 and 85% at voxel sizes of 50 and 400 urn, respectively, compared to the FCBA. Conversely, when the voxel size was smaller than 50 μm, the FCBA showed the smallest SD. Reconstructed phantom images using reconstruction voxel sizes of 10 and 50 urn are shown in Figure 4D. The results of visual evaluation of the phantom images are in agreement with the results shown in Figure 4C.
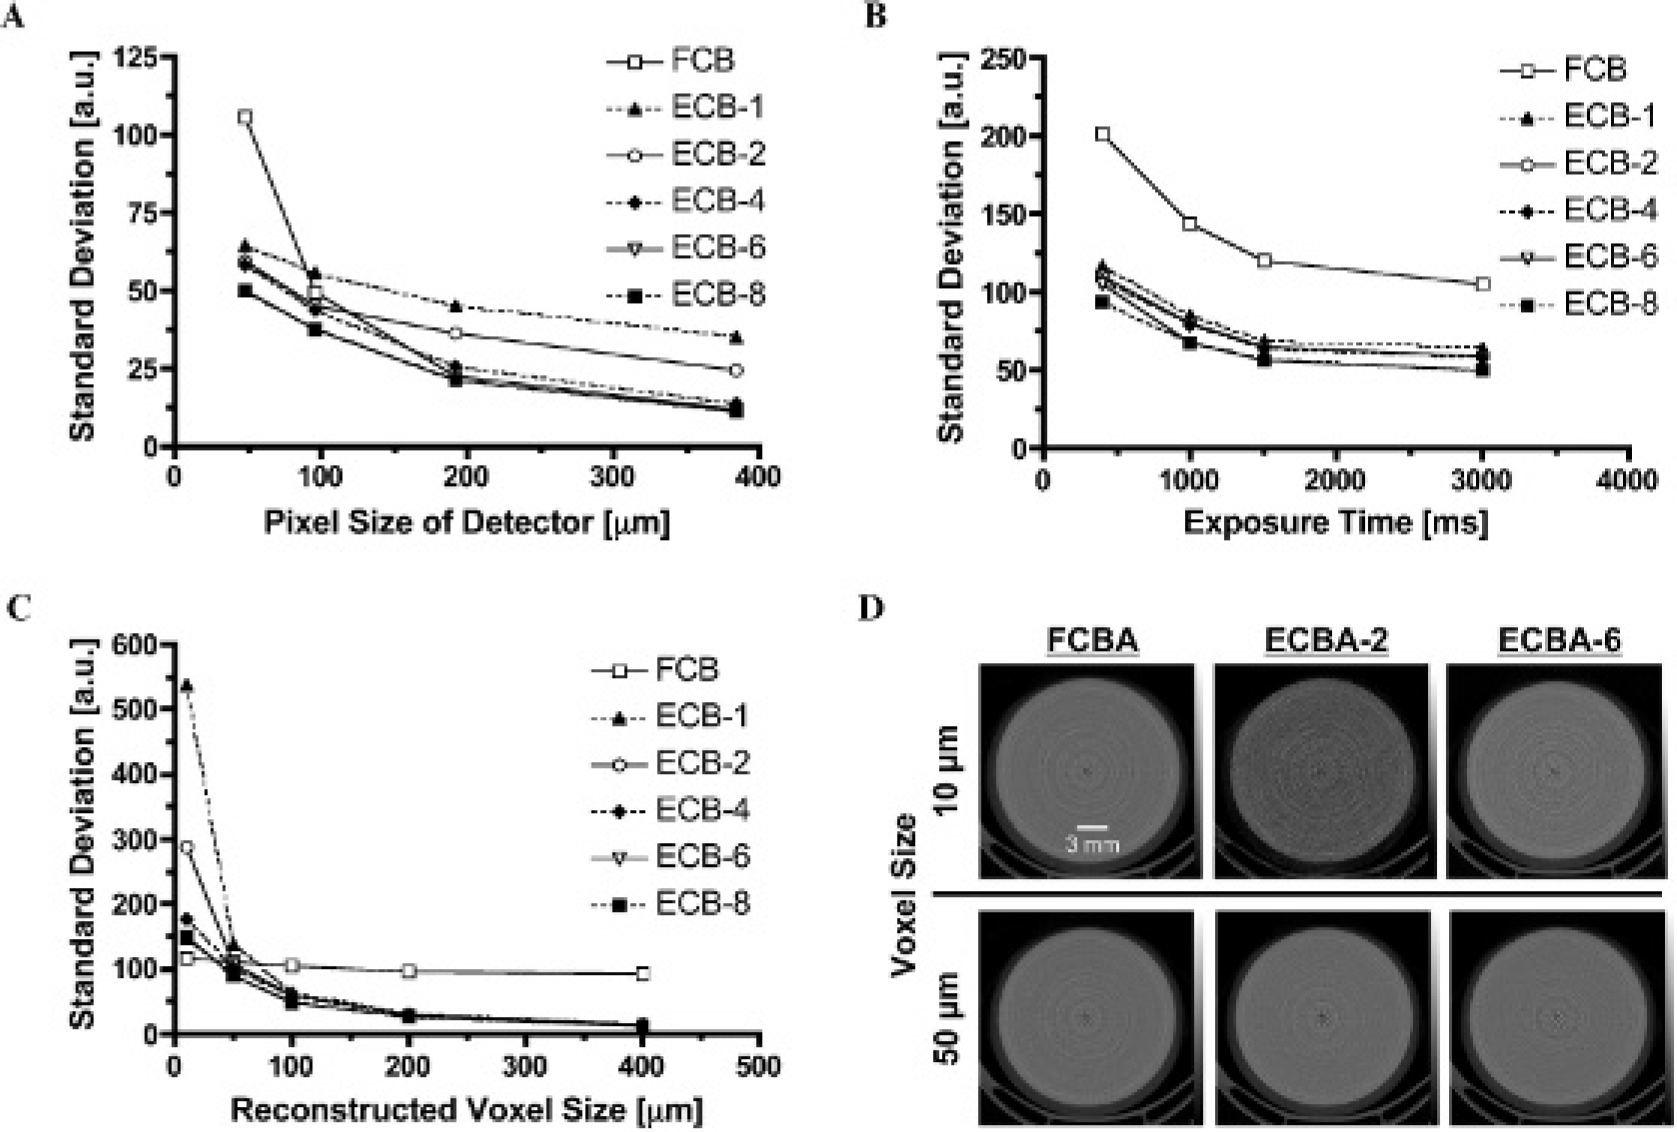
Analysis of image noise. Image noise was measured using a 21 mm diameter syringe phantom as detailed in Materials and Methods. A, The relationship between the standard deviation of image noise and detector pixel size as a function of the reconstruction algorithm. B, The relationship between the standard deviation of image noise and exposure time as a function of the reconstruction algorithm. C, The relationship between the standard deviation of image noise and reconstructed voxel size as a function of the reconstruction algorithm. D, Reconstructed phantom images obtained using 10 μm (top) or 50 μm (bottom) reconstruction voxels as a function of the reconstruction algorithm. ECB = exact cone beam; ECBA = exact cone beam algorithm; FCB = fast cone beam; FCBA = fast cone beam algorithm.
Based on this study, we selected a detector pixel size of 48 μm, an exposure time of 3,000 ms/projection, the ECBA-6 reconstruction algorithm, and a reconstruction voxel size of 50 μm to achieve the highest possible resolution and image quality for in vivo experiments.
In Vitro Imaging of Single HA Crystals
Single HA crystals were imaged sequentially by high-resolution CT and bright-field microscopy. A single crystal with a diameter of approximately 300 μn X 100 urn is seen clearly in the reconstructed CT image, which coregistered perfectly with the optical microscopy image (Figure 5 and Supplementary Video).

Computed tomography (CT) of a single hydroxyapatite (HA) crystal. Bright-field microscopy image (left), CT image (middle), and a merge of the two (right). Arrows indicate a single HA crystal measuring 300 μm X 100 μm. CT parameters included 45 kVp, 177 μA current, 3,000 ms/projection, 360 projections/rotation, and a detector pixel size of 48 μm. FM = iodine-containing fiducial markers. A supplementary video showing the 3-D reconstruction is available from the corresponding author.
In Vivo and Ex Vivo Imaging of Breast Cancer Microcalcifications
Longitudinal monitoring of syngeneic breast cancer in rats revealed the first evidence of tumor microcalcification 14 days postinjection with rBMP-2. As shown in a representative animal (Figure 6), the first two detectable calcifications, presumably single crystals or extremely small clusters, had dimensions of 300 μm and 100 μm in diameter. After initial nucleation, sites of microcalcification expanded rapidly over the next 19 days, with high-resolution CT being capable of following individual clusters and quantifying tumor volume and calcification volume over time. 9 The effect of reconstructed voxel size on image quality (see also Figure 3, right, and Figure 4C) is shown in Figure 7 for an excised tumor. As reconstructed voxel size was reduced from 400 μm to 50 μm, image quality improved steadily, albeit at the expense of reconstruction time, which increased from 30 minutes for 400 μm voxels to 180 minutes for 50 μm voxels.

In vivo imaging of the genesis and growth of breast cancer microcalcifications over time. High-resolution computed tomography (CT) of a syngeneic rat breast cancer at days 14, 16, 19, and 33 days postinjection with recombinant bone morphogenetic protein 2 (rBMP-2). Shown are the maximal intensity projection (MIP; left) and two transaxial (TA) slices (middle and right), whose positions are indicated with dotted and dashed lines on the MIP. Arrows indicate 300 μm (TA #1) and 100 μm (TA #2) microcalcifications first seen at day 14, which grew over time. CT acquisition parameters included 45 kVp, 177 μA current, 3,000 ms/projection, 360 projections/rotation, and a detector pixel size of 48 μm. Reconstruction parameters included the exact cone beam algorithm (ECBA) with a sampling number of 6 (ECBA-6) and a voxel size of 50 μm. Data are representative of three independent experiments.
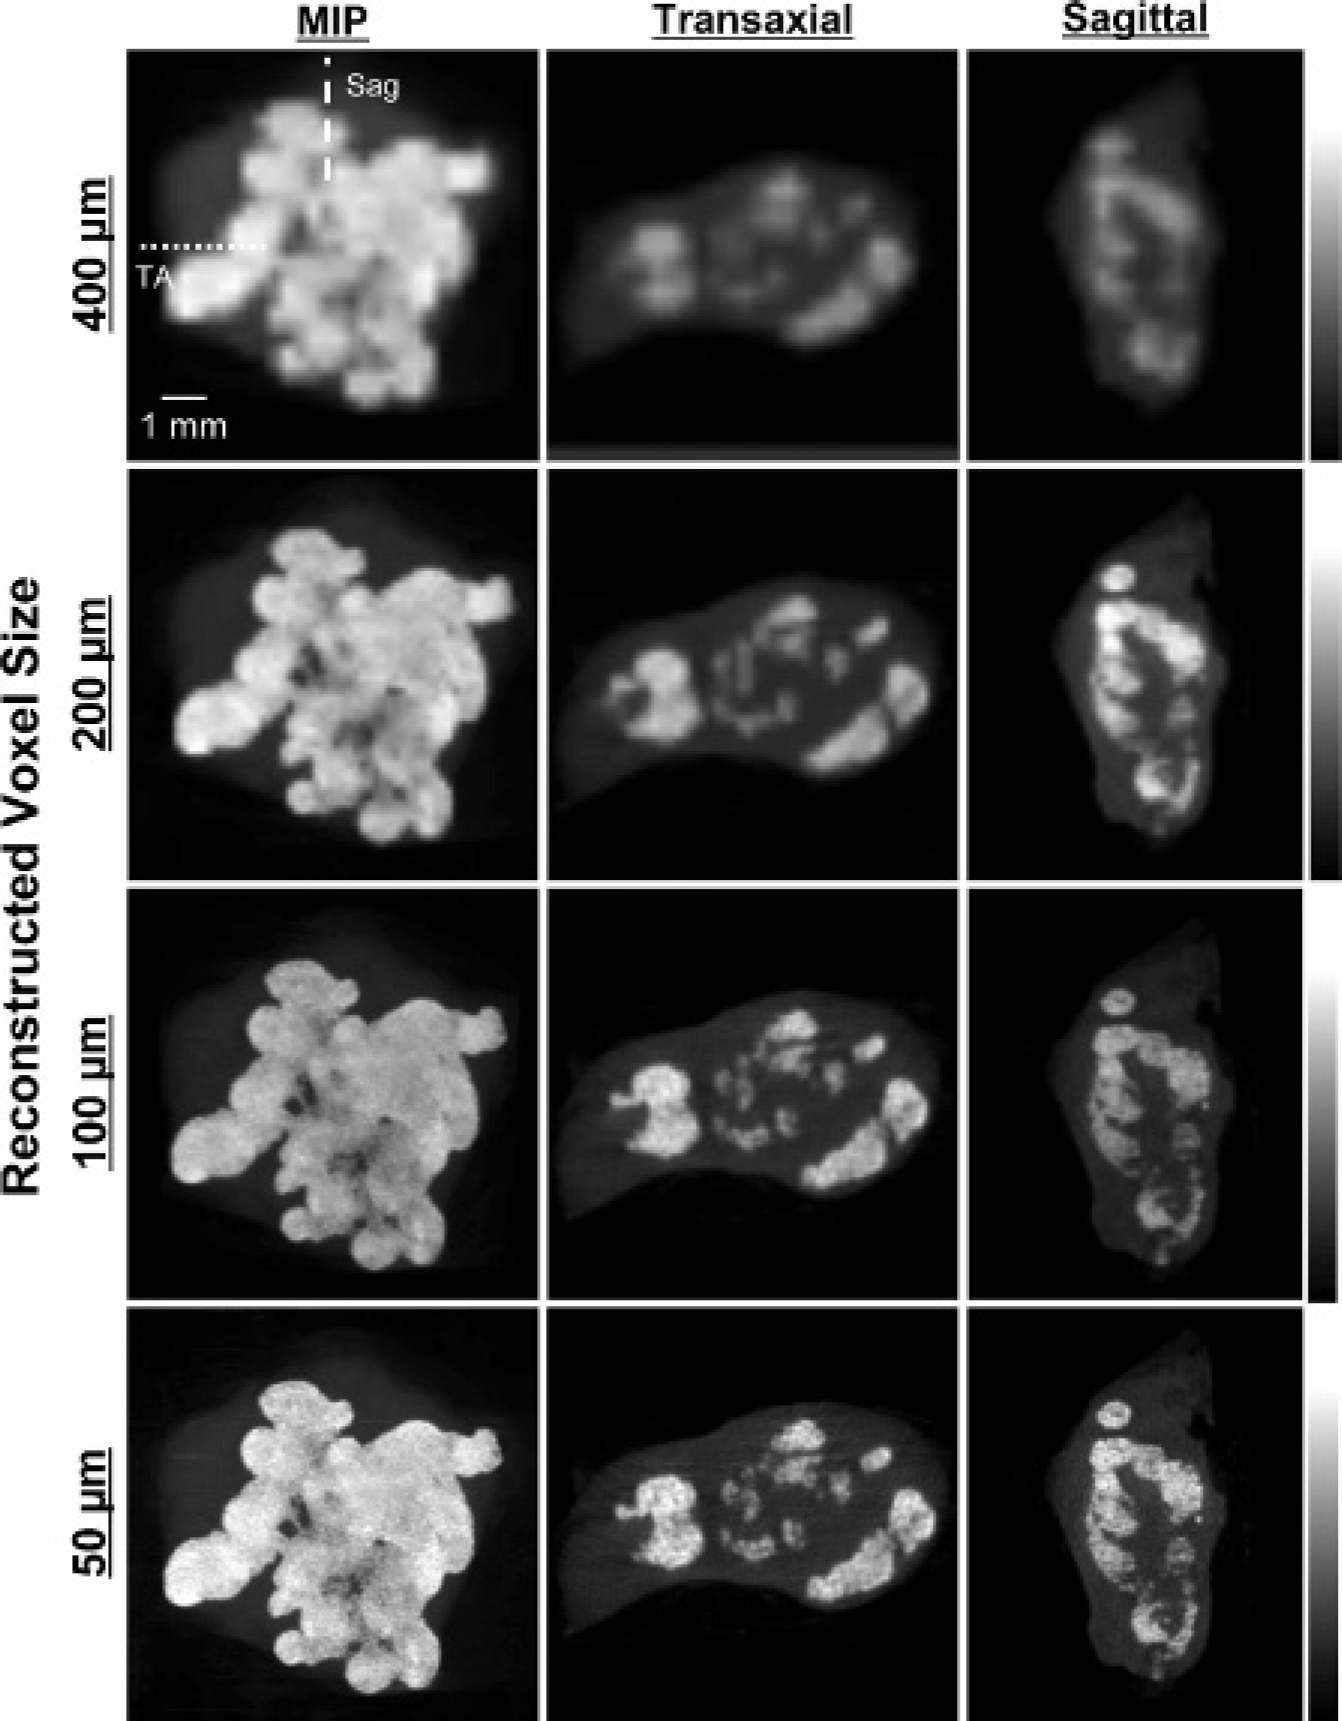
Ex vivo imaging of breast cancer microcalcifications. High-resolution ex vivo computed tomography (CT) of a syngeneic rat breast tumor 33 days postinjection with recombinant bone morphogenetic protein 2 (rBMP-2). Shown are maximal intensity projections (MIPs; left), and transaxial (TA) and sagittal (Sag) slices as indicated with dotted and dashed lines, respectively. CT acquisition parameters included 45 kVp, 177 μA current, 3,000 ms/projection, 360 projections/rotation, and a detector pixel size of 48 μm. Reconstruction parameters included the exact cone beam algorithm (ECBA) with a sampling number of 6 (ECBA-6). Reconstructed voxel size was varied from 400 μm (top row, instrument default) to 50 μm (bottom row). Data are representative of three independent experiments.
Discussion
To the best of our knowledge, this is the first report of imaging single breast cancer microcalcifications in vivo using high-resolution CT. We purposely used a commercially available scanner for the study to demonstrate that systematic optimization of acquisition and reconstruction parameters can result in satisfactory imaging without specialized hardware or software. Nor did the in vivo results we presented employ correction for respiratory motion of the rib cage to which the breast tumor was adhered. The addition of such a correction would be expected to improve image quality even further, toward that seen during ex vivo scanning (compare Figure 6 to Figure 7).
The detection of single breast cancer microcalcifications by high-resolution CT and the ability to quantify calcification volume over time 9 have several implications. First, groups such as ours that are interested in developing HA-specific contrast agents5–7 now have an in vivo gold standard to which to compare the sensitivity of various imaging modalities. For example, when developing an HA-specific radiotracer for positron emission tomography (PET), it is now possible to know the precise location of single HA crystals in a tumor, which in turn will permit measurement of the limit of detection of PET radiotracers as a function of PET voxel size and scanner sensitivity. This is particularly important in PET, where voxel resolution will typically be ≈ 10-fold lower than CT. Second, the technology we describe (ie, a combination of animal model and high-resolution CT scanning) will permit biologists interested in the mechanism of breast cancer microcalcification to quantify calcification burden after modulation of gene expression. In a previous study, for example, we demonstrated that the effect of rBMP-2 was humoral, rather than local, in inducing microcalcifications. 8 Finally, our technology provides a convenient method to test possible pharmacologic modulators of breast cancer microcalcification. For example, rBMP-2-like agents could be developed that increase the sensitivity of screening mammography by inducing microcalcification (ie, increasing detectability) of otherwise occult malignancies.
Our study is complementary to ongoing clinical studies using dedicated clinical breast CT scanners pioneered by researchers at the University of California, Davis. 22 In a study by Gong and colleagues, breast calcifications on the order of 175 μm in diameter could be detected using their system. 4 In our study, we evaluated the use of the FCBA versus the ECBA and found that the best tradeoff between resolution and image noise was found with the ECBA and an optimal sampling frequency (ie, detector binning). Resolution of the ECBA improved by 28 μM (21%) of the FWHM compared to the FCBA. We believe that this is due to the fact that projection data are interpolated using adjacent pixels using the FCBA, which degrades resolution. In contrast, the ECBA is reconstructed by binning each pixel on the detector into squares according to the sampling number. We suggest that the ECBA is superior for high-resolution imaging of in vivo microcalcifications. Other parameters that appear to optimize high-resolution imaging include a detector pixel size of 48 μm and a reconstructed voxel size of less than 100 μm. Of note, the default-reconstructed voxel size for rat imaging on the NanoSPECT/CT is 400 μm, which is far from optimal.
Given that small pixel and voxel sizes are required to obtain high-resolution images, there is the risk that image noise might be increased in the process. We evaluated noise as a function of pixel size, exposure time, and reconstructed voxel size. The image noise of the FCBA is significantly increased compared to that of the ECBA when detector pixel size is held constant at 48 μm. The SD increases as pixels are interpolated to a larger size; therefore, image noise was higher with the FCBA compared to the ECBA. We also evaluated the correlation between image noise and reconstructed voxel size. Given that projected data are interpolated based on voxel size prior to back-projection, the image noise of the FCBA was relatively independent of voxel size. In contrast, because projection data are not interpolated with the ECBA, image noise depends on the voxel size. The image noise of the ECBA also depends on the relationship between detector pixel size and reconstructed voxel size. Specifically, when the reconstructed voxel size is smaller than the detector pixel size, image noise is increased dramatically. The number of rays used to reconstruct each voxel decreases when the pixel size of the detector is much greater than the reconstructed voxel size. Our data suggest that if the pixel size of the detector is larger than the voxel size, the ECBA may help reduce image noise.
Acquisition and reconstruction times are important parameters. Marxen and colleagues reported a high-resolution CT scanner that had a 38 lp/mm improvement in resolution over our data. 17 However, the acquisition of CT data took ≈ 2 hours to image mice. Given that small animals are stressed by anesthesia, minimization of scan time is important. In the optimized protocol we describe, the total scan time for visualizing single microcalcifications is only 18 minutes, thus providing both high resolution and practicality.
Footnotes
Acknowledgments
We thank Eugenia Trabucchi for administrative assistance and Lorissa Moffitt and Mary McCarthy for editing.
Financial disclosure of authors: We gratefully acknowledge funding from the following sources: National Institutes of Health High-End Instrumentation Grant (S10-RR-023010) to J.V.F.; Lewis Family Foundation to J.V.F.; Foundation for Promotion of Cancer Research to K.I.; Tokyo Metropolitan University to K.I.; BIRD of Japan Science and Technology Agency to K.I. and H.F.
Financial disclosure of reviewers: None reported.