
Abstract
Imaging the location and extent of cancer provides invaluable information before, during, and after surgery. The majority of “image-guided” methods that use, for example, positron emission tomography (PET) involve preoperative imaging and do not provide real-time information during surgery. It is now well established that the inherent optical emissions (Cerenkov radiation) from various β-emitting radionuclides can be visualized by Cerenkov luminescence imaging (CLI). Here we report the full characterization of CLI using the positron-emitting radiotracer 89Zr-DFO-trastuzumab for target-specific, quantitative imaging of HER2/neu-positive tumors in vivo. We also provide the first demonstration of the feasibility of using CLI for true image-guided, intraoperative surgical resection of tumors. Analysis of optical CLIs provided accurate, quantitative information on radiotracer biodistribution and tissue uptake that correlated well with the concordant PET images. CLI, PET, and biodistribution studies revealed target-specific uptake of 89Zr-DFO-trastuzumab in BT-474 (HER2/neu positive) versus MDA-MB-468 (HER2/neu negative) xenografts in the same mice. Competitive inhibition (blocking) studies followed by CLI also confirmed the in vivo immunoreactivity and specificity of 89Zr-DFO-trastuzumab for HER2/neu. Overall, these results strongly support the continued development of CLI as a preclinical and possible clinical tool for use in molecular imaging and surgical procedures for accurately defining tumor margins.
IMAGE-GUIDED SURGERY provides the surgeon with unprecedented information as to the nature, location, and extent of diseased tissue. For example, in operative cancer patients, imaging modalities including computed tomography (CT) and magnetic resonance imaging (MRI), as well as the nuclear imaging techniques of γ-camera imaging, single-photon emission computed tomography (SPECT), and positron emission tomography (PET), have been used to identify tumor masses and disease stage and facilitate minimally invasive surgical resection, with varying degrees of success. 1
For women with breast cancer, primary forms of treatment include lumpectomy, mastectomy, and lumpectomy combined with irradiation therapy.1,2 The margin status of the resected tissue is an important prognostic factor in defining both the efficacy of surgery and the likelihood of tumor recurrence. In the clinic, margin status is usually assessed by a combination of gross specimen examination by surgeons and pathologists, typically using hematoxylin and eosin stains. 3 Clinically, the occurrence of tumor-positive margins as defined by intraoperative pathology is very high, with reported rates of reexcision in the range of 48 to 59%.2,3 It is evident that there is a crucial requirement for developing novel methods to assist surgeons in defining tumor localization and margin status during the primary operation.
Vermeeren and colleagues recently demonstrated the effective use of a portable laparoscopic γ-probe coupled to a γ-camera for intraoperative detection of sentinel lymph nodes using 99mTc nanocolloids.4,5 Their studies also demonstrate the feasibility of operating on patients who have received a recent dose of radiolabeled agent. In contrast to this intraoperative technique, most “image-guided” surgery that employs PET/SPECT detection relies on preoperative imaging of the patient to identify the location of tumors, which provides the surgeon with the anatomic and potentially physiologic status of the lesions prior to surgery. However, in the surgical situation, these imaging modalities do not currently provide information on margin identification and status and, consequently, are of limited use for “guiding” intraoperative resection. Furthermore, these scanners are large and expensive and require trained personnel to run the acquisition.
What if the distribution of β-emitting radiotracers and radiotherapeutics could be imaged in real time, during the surgical procedure? This would allow the surgeon to use many of the various PET and radiotherapy agents that are already in clinical use, including radiolabeled monoclonal antibodies (mAbs), with high target specificity. In 2009, Robertson and colleagues introduced the concept of Cerenkov luminescence imaging (CLI), whereby the inherent optical emissions from various β-emitting radiotracers can be visualized by use of a sensitive charge-coupled device. 6 Subsequently, we and others verified the origins and relative intensities of the optical emissions from a range of radionuclides, including 18F, 64Cu, 89Zr, 124I, 131I, and 225Ac.7–12 In preliminary studies, we characterized the 89Zr (half-life = 78.41 hours, electron capture = 76.6%, β+ = 22.3%, Emax [β+] = 897 keV, Eave [β+] = 396.9 keV, Rave [β+] = 1.18 mm, Eγ = 908.97 keV, Iγ = 100%), radiolabeled mAb, and 89Zr-DFO-J591, as the first radioimmunoconjugate for CLI of prostate-specific membrane antigen (PSMA)-expressing prostate xenografts in vivo.7,13 The advantages of using 89Zr-radiolabeled mAbs for both PET and CLI include high target specificity, high in vivo stability, and the relatively long half-life of 89Zr, which facilitates temporal imaging studies at time points beyond those attainable with 18F, 64Cu, 68Ga, and 86Y. In addition, we demonstrated that region-of-interest (ROI) analysis of in vivo CLI data is quantitative and correlates strongly with the measured PET signal. 7
In this work, we present a new application of the use of 89Zr-DFO-trastuzumab PET radiotracer for target-specific, quantitative CLI of HER2/neu-positive tumors in vivo. 14 Changes in optical image data are correlated with the concordant PET image data, and the signal specificity is confirmed by comparison of the measured radiotracer uptake in BT-474 (HER2/neu positive) and MDA-MB-468 (HER2/neu negative) tumor models. In addition, competitive inhibition studies measured by CLI and PET also demonstrate that subtle changes in radiotracer distribution can be observed optically. Finally, we provide the first demonstration of the use of CLI for true image-guided, intraoperative surgical resection of tumors. The data presented strongly support the continued development of CLI as both a preclinical and a clinical tool for use in both molecular imaging and surgical procedures.
Materials and Methods
General Details
All chemicals, unless otherwise stated, were purchased from Sigma-Aldrich (St. Louis, MO) and were used as received. Water (> 18.2 MΩ/cm at 25°C; Milli-Q, Millipore, Billerica, MA) was purified by passing through a 10 cm column of chelex resin (Bio-Rad Laboratories, Hercules, CA) at a flow rate < 1.0 mL/min. All instruments were calibrated and maintained in accordance with previously reported routine quality control procedures. 15 89Zr radioactivity measurements were made using a Capintec CRC-15R Dose Calibrator (Capintec, Ramsey, NJ) with a calibration factor of 465. For accurate quantification of radioactivities, experimental samples of positron-emitting radionuclides were counted for 1 minute on a calibrated Perkin Elmer Automatic Wizard 2 Gamma Counter (Perkin Elmer, Waltham, MA) using a dynamic energy window of 800 to 1,000 keV for 89Zr (909 keV emission). 89Zr radiolabeling reactions were monitored by using silica gel–impregnated glass fiber instant thin-layer chromatography (TLC) paper (Pall Corp., East Hills, NY) and analyzed on a radio-TLC plate reader (Bioscan System 200 Imaging Scanner coupled to a Bioscan Autochanger 1000 [Bioscan Inc., Washington, DC] using Win-Scan Radio-TLC software version 2.2, LabLogic, Sheffield, United Kingdom). Solvent systems included diethylenetriamine pentaacetic acid in water (DTPA, 50 mM, pH 7) and phosphate-buffered saline. The BT-474 (HER2/neu positive) and MDA-MB-468 (HER2/neu negative) human breast cancer cell lines were obtained from the American Type Culture Collection (Manassas, VA), and cells were grown by serial passage using standard methods. 14
Radionuclides and Radiochemistry
89Zr was produced in high radiochemical and radionuclidic purity via the 89Y(p,n)89Zr transmutation reaction on an EBCO TR19/9 variable beam energy cyclotron (Ebco Industries, Richmond, BC) in accordance with previously reported methods. 16 Bioconjugation and 89Zr radiolabeling of trastuzumab functionalized with the chelating ligand desferrioxamine B (DFO) were conducted in accordance with previously reported methods. 14 The DFO-trastuzumab was radiolabeled to give 89Zr-DFO-trastuzumab. After purification by using spin column size-exclusion chromatography (molecular weight cutoff > 30 kDa), 89Zr-DFO-trastuzumab was formulated in sterile saline for injection with a radiochemical purity > 99% and a specific activity of 178 MBq/mg (4.8 mCi/mg). Isotopic dilution assays revealed that the DFO-trastuzumab conjugated had an average of 3.3 ± 0.2 chelates per mAb. In vitro cellular binding assays using BT-474 (HER2/neu positive) cells demonstrated that the 89Zr-DFO-trastuzumab remained active with an immunoreactive fraction of 0.77 ± 0.06 (n = 3). 17
Xenograft Models
All animal experiments were conducted in compliance with Institutional Animal Care and Use Committee guidelines and the National Institutes of Health (NIH) Guide for the Care and Use of Laboratory Animals. 18 All animal procedures were performed under anesthesia by inhalation of 1 to 2% isoflurane (Baxter Healthcare, Deerfield, IL) and oxygen mixture. Animals were sacrificed by CO2 asphyxiation. Female athymic nu/nu mice (20–22 g, 6–8 weeks old) were obtained from Taconic Farms Inc. (Hudson, NY) and were allowed to acclimatize at the Memorial Sloan-Kettering Cancer Center (MSKCC) vivarium for 1 week prior to implanting tumors. Mice were provided with food and water ad libitum. BT-474 and MDA-MB-468 tumors were induced on the lower right and left flanks, respectively, by subcutaneous injection of 4.0 × 10⁶ cells in a 100 μL cell suspension of a 1:1 v/v mixture of media with reconstituted basement membrane (BD Matrigel, Collaborative Biomedical Products Inc., Bedford, MA). Palpable tumors (50–150 mm3) developed after a period of 10 to 14 days. The tumor volume (V/mm3) was estimated using previously described methods. 14 All surgical procedures were conducted under anesthesia, and the animals were sacrificed immediately at the end of the procedures without waking.
PET Imaging
PET imaging experiments were conducted on a microPET Focus 120 scanner (Concorde Microsystems, Knoxville, TN). 19 Mice were administered 89Zr-DFO-trastuzumab formulations (4.07–4.26 MBq, [110–115 μCi], 23–24 μg of mAb, in 200 μL sterile saline for injection) via intravenous tail vein injection. For the competitive inhibition (blocking) studies, mice received a coinjection of 89Zr-DFO-trastuzumab (3.15–3.52 MBq, [85–95 μCi]) with nonradiolabeled trastuzumab to give a total dose of 125 μg of trastuzumab per mouse. Approximately 5 minutes prior to recording PET images, mice were anesthetized by inhalation of 1 to 2% isoflurane-oxygen gas mixture and placed on the scanner bed. PET images were recorded at various time points between 3 and 144 hours postinjection. List-mode data were acquired for between 10 and 30 minutes using a γ-ray energy window of 350 to 750 keV and a coincidence timing window of 6 ns. For all static images, scan time was adjusted to ensure that a minimum of 20 million coincident events were recorded. Data were sorted into two-dimensional histograms by Fourier rebinning, and transverse images were reconstructed by filtered backprojection into a 128 × 128 × 63 (0.72 × 0.72 × 1.3 mm) matrix. The reconstructed spatial resolution for 89Zr was 1.9 mm full-width half-maximum at the center of the field of view. Image data were normalized to correct for nonuniformity of response of the PET, dead-time count losses, positron branching ratio, and physical decay to the time of injection, but no attenuation, scatter, or partial-volume averaging correction was applied. An empirically determined system calibration factor (in units of [mCi/mL]/[cps/voxel]) for mice was used to convert voxel count rates to activity concentrations. The resulting image data were then normalized to the administered activity to parameterize images in terms of percent injected dose per gram (%ID/g). Manually drawn three-dimensional volumes of interest (VOI) were used to determined the average %ID/g (decay-corrected to the time of injection) in various tissues/phantom tubes. Images were analyzed using ASIPro VM software (Concorde Microsystems).
Optical Imaging
Optical images were acquired using the Xenogen Ivis 200 optical imager (Caliper Life Sciences, Alameda, CA). Cerenkov radiation was detected using the bioluminescence setting (integration times: 2, 3, 4, and 5 minutes; f/stop: 1; binning: 1, field of view B) with no light interference from the excitation lamp.
Animals were anesthetized and imaged at various time points between 3 and 144 hours postadministration of 89Zr-DFO-trastuzumab. Images were collected using open filter for planar imaging. Images were collected and analyzed using Living Image 3.6 and 2.6 software (Caliper Life Sciences), respectively. The average radiance (p/s/cm2/sr) was used for quantitative ROI analysis. Background correction was performed either through the use of dark images acquired at the equivalent instrument integration settings immediately before experimental image collection or by ROI analysis of a region in the same experimental image but remote from the area of interest. For quantitative comparison, ROI data were decay-corrected to the time of injection.
CLI-Guided Surgery
Surgical resection of the BT-474 (HER2/neu positive) tumor located on the lower right flank was performed at the end of the temporal CLI and PET imaging studies immediately prior to full biodistribution studies. Optical imaging was conducted following the same methods described above. Anesthesia was maintained throughout the entire procedure followed by CO2 asphyxiation immediately after the surgery.
Biodistribution Studies
In vivo biodistribution studies were conducted at the end of the optical and immuno-PET imaging to validate the uptake and localization of 89Zr-DFO-trastuzumab observed in mice bearing dual subcutaneous BT-474 and MDA-MB-468 tumors (n = 4). Mice were anesthetized and then sacrificed by CO2 asphyxiation at 144 hours postadministration. Thirteen tissue samples were collected, including the tumors, rinsed in water, dried in air for 5 minutes, weighed, and then stored at 4°C for 14 days to allow the activity to decay to a level suitable for counting on the γ-counter. Count data (counts per minute) were background and decay-corrected before a standard calibration curve was used for the numerical conversion to activity (kBq). The %ID/g for each tissue sample was then calculated by normalization to both the total amount of activity injected (kBq) and the organ mass (g).
Statistical Analysis
Data were analyzed using the unpaired, two-tailed Student t-test. Differences at the 95% confidence level (p < .05) were considered statistically significant.
Results
In previous studies, we provided the first pilot demonstration of quantitative CLI of the tumor uptake of an immuno-PET radiotracer, 89Zr-DFO-J591, for imaging PSMA expression in prostate cancer xenografts. 7 Here we describe the first use of CLI for image-guided surgical resection. In addition, we provide details of a full study demonstrating the ability of CLI to measure in a fully quantitative sense the target-specific tumor uptake of 89Zr-DFO-trastuzumab14,20–22 in BT-474 and MDA-MB-468 (HER2/neu negative) breast tumor models.
CLI and PET
Temporal CLIs and PET images recorded between 3 and 144 hours following intravenous administration of 89Zr-DFO-trastuzumab in mice bearing subcutaneous human BT-474 (HER2/neu positive; lower right flank) and MDA-MB-468 (HER2/neu negative; lower left flank) xenografts are presented in Figure 1. The uncorrected optical CLI data showing the radiotracer distribution in normal mice (left panel; mice 1–4) and trastuzumab-treated (block) mice (right panel; mice 5–8) are given in Figure 1A. Figure 1, B and C, shows representative maximum intensity projection (MIP) PET images recorded between 3 and 144 hours postadministration of 89Zr-DFO-trastuzumab in normal (mouse 1) and trastuzumab-treated (mouse 7) animals, respectively.

Temporal images of 89Zr-DFO-trastuzumab uptake (4.07–4.26 MBq [110–115 μCi], 23–24 μg mAb; 200 μL sterile saline) recorded in dual BT-474 (HER2/neu positive; lower right flank) and MDA-MB-468 (HER2/neu negative; lower left flank) tumor-bearing mice between 3 and 144 hours postadministration. A, Optical CLI signal observed for 89Zr-DFO-trastuzumab tumor uptake in four normal mice (left panel) and four mice treated with a blocking dose (125 μg/mouse) of nonradiolabeled trastuzumab (see Figure S1 for control optical images). Corresponding temporal maximum intensity projection (MIP) PET images of two representative mice from the (B) normal (mouse 1) and (C) blocking (mouse 7) groups. The upper and lower thresholds of the CLIs and PET images have been adjusted for visual clarity, as indicated by the scale bars. For the MIP images, the higher and lower intensity thresholds were set at 100% and 15%, respectively.
Both the optical and PET images demonstrate that 89Zr-DFO-trastumab uptake in BT-474 tumors can be visualized above the background. Furthermore, uptake is specific for the HER2/neu-positive tumors, which display an approximate fivefold higher optical signal than the radiotracer uptake observed in the HER2/neu-negative MDA-MB-468 xenografts. Interestingly, as with the PET data, the CLIs recorded at 3 to 48 hours show that background activity located primarily in the blood pool (heart, lungs, and liver) can be seen throughout the mouse. 89Zr-DFO-trastumab uptake in these BT-474 tumor models is known to increase for up to 72 hours in an exponential manner consistent with the expected in vivo pharmacokinetics of a radiolabeled IgG1 immunoglobulin. 14 As the radiotracer is extracted from the circulation by specific targeting to the HER2/neu antigen, tumor activity increases and blood pool activity decreases with a concordant lowering of optical signal intensity in the background tissues. In addition, by the 72- to 144-hour time points, the 89Zr-radionuclide decays through 1 to 2 half-lives. Radioactive decay has the effect of lowering the overall signal intensity observed from the mice. At longer time points, the optical signal from background tissue and MDA-MB-468 tumors decreased to levels below the noise. In contrast, owing to the higher radiotracer uptake, Cerenkov emission intensity from the BT-474 tumors remained visible, with improved tumor contrast. In this respect, qualitative analysis of the CLI data was found to be entirely consistent with the changes in radiotracer uptake in tumor and background tissues observed by PET imaging (see Figure 1B).
The optical images also demonstrated the ability of CLI to distinguish between normal and trastuzumab-treated mice (Figure 1, A [right panel] and C). Administration of a blocking dose of trastuzumab competed effectively with the 89Zr-DFO-trastuzumab for the available HER2/neu antigen, thereby reducing radiotracer uptake in the BT-474 xenografts to values comparable to the uptake in the MDA-MB-468 tumors. Radiotracer uptake in the HER2/neu-negative and the blocked HER2/neu-positive tumors was confirmed previously to be consistent with the “enhanced permeation and retention” mechanism. 14 Again, the CLI data were found to be qualitatively consistent with the radiotracer biodistribution observed by PET.
To demonstrate the feasibility and accuracy of using CLI for quantitative analysis of radiotracer distribution, ROI analysis of the two-dimentional optical images was compared to the tissue uptake as measured from VOI analysis of the PET data. Time-activity curves (TACs) showing the average and maximum radiance (in units of p/s/cm2/sr) signal intensity measured from the CLI data of 89 Zr-DFO-trastuzumab uptake in the BT-474 and MDA-MB-468 xenografts for both the normal and blocking experiments are given in Figure 2, A and B, respectively. Corresponding mean and maximum (%ID/g) tumor TACs derived from the PET images of the same mice at equivalent time points are presented in Figure 2, C and D. Quantitative analysis is consistent with the qualitative assessment of the CLIs and PET images. At all time points ≥ 24 hours, radiotracer uptake in the BT-474 tumors in mice 1 to 4 was higher than that observed in either the MDA-MB-468 tumors (mice 1–8) or the blocked BT-474 tumors (mice 5-8) (see supplementary Tables S1 to S3 for full statistical analysis of the data).

Time-activity curves (TACs) showing change in 89Zr-DFO-trastuzumab accumulation in BT-474 and MDA-MB-468 tumors in both normal and trastuzumab-treated mice. TACs are derived from region-of-interest (ROI) and volume-of-interest (VOI) analysis of the CLIs and PET images, respectively. (A) Average and (B) maximum radiance (p/s/cm2/sr) versus time for the optical CLI data. (C) Mean and (D) maximum %ID/g tumor uptake of 89Zr-DFO-trastuzumab as measured from the PET image data.
The correlations observed between the quantitative CLI and PET data for the average radiance versus mean %ID/g and the maximum radiance versus maximum %ID/g for all tumors (mice 1–8) at 3, 24, 48, 96, and 144 hours postinjection are shown in Figure 3, A and B, respectively. Both plots show strong positive correlation between the optical CLI and PET data with correlation coefficients of R = .82 and R = .89 for the average and maximum data, respectively. Interestingly, in comparison to the mean PET tumor uptake data, the average CLI data (see Figure 3A) appears to slightly overestimate the amount of activity present, giving a linear fit with a gradient of 1.15 × PET signal. In contrast, for the maximum data (see Figure 3B), CLI appears to underestimate the activity present with a gradient of 0.75 × PET signal. This underestimation of the maximum data from CLI is likely due to light attenuation and scattering from the subcutaneous tumor (vide infra). Overall, these data demonstrate that, in principle, given careful calibration of the instrumentation, CLI can provide fully quantitative data on radiotracer uptake in subcutaneous xenograft models.

Scatterplots showing the correlation between the observed background and decay-corrected CLI optical signal intensity and the quantitative decay-corrected PET image data for (A) the average radiance and mean %ID/g and (B) the maximum radiance and maximum %ID/g data. Each scatterplot contains image data recorded at 3, 24, 48, 96, and 144 hours postinjection of the radiotracer for all normal and trastuzumab-treated (block) groups of mice (total n = 8 mice; 8 BT-474 and 8 MDA-MB-468 tumors; 5 time points).
Biodistribution Data
At the end of the imaging experiment (144 hours), the mice were sacrificed and the organs collected for ex vivo biodistribution studies to quantify the accumulation of 89Zr radioactivity (Figure 4). Biodistribution data are consistent with those reported previously14,20 and demonstrate that 89Zr-DFO-trastuzumab uptake in BT-474 tumors is very high (47.2 ± 6.3%ID/g) versus MDA-MB-468 (7.2 ± 1.4%ID/g; p = .008), blocked BT-474 (21.9 ± 7.5%ID/g; p = .005), and blocked MDA-MB-468 (6.5 ± 0.4%ID/g; p = .007) tumors. Full biodistribution data are presented in supplementary Table S4. These ex vivo data support the conclusions from the imaging studies and provide further validation of the quantitative accuracy of the CLI and PET image data.
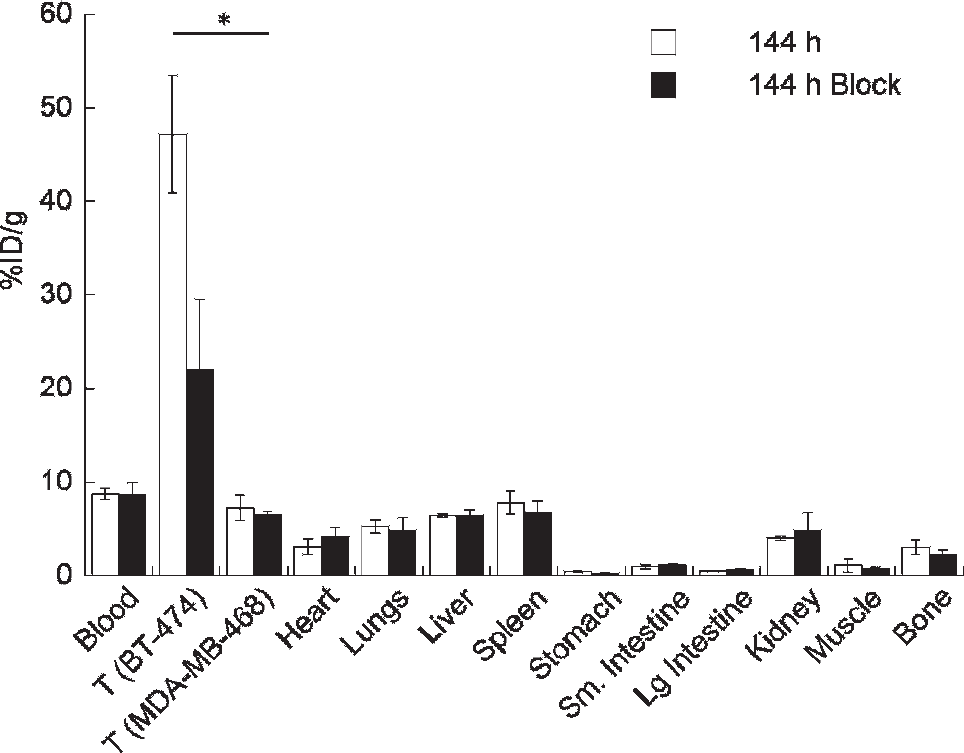
Bar chart showing selected tissue biodistribution data (%ID/g) for the uptake of 89Zr-DFO-trastuzumab in female, athymic nu/nu mice at the end of the optical CLI and PET imaging experiments (144 hours postinjection). *p < .05.
Intraoperative CLI-Guided Surgery
Figure 5 shows a series of CLIs recorded before, during, and after surgical resection of the BT-474 (HER2/neu positive) tumor located on the lower right flank at 144 hours postadministration of 89Zr-DFO-trastuzumab. All images are presented with identical upper and lower radiance thresholds as indicated by the scale bar. A background image of the surgical workspace and scanner bed is presented as a control in Figure 5A, demonstrating no background CLI. The optical CLI signal observed in the preoperative anesthetized mouse prior to surgical incision shows clear delineation of the BT-474 tumor (see Figure 5B). Note that prior to exposing the tumor mass, the average radiance of the BT-474 tumor was approximately 1 × 10⁴ p/s/cm2/sr. The intraoperative image recorded after surgical incision and exposure of the tumor (red circle) is shown in Figure 5C. As expected, the optical signal intensity showed a marked increase to the average tumor radiance of approximately 1.4 × 10⁴ p/s/cm2/sr. This increased radiance is due to decreased photon attenuation and scattering by removal of the skin. Figure 5D shows the complete loss of optical signal intensity emitted from the mouse on the lower right flank (formerly the location of the BT-474 tumor) and translocation of the signal with the tumor mass (placed in the upper left corner). As a further control, Figure 5E demonstrates that the optical signal is associated with the tumor mass now separated from the mouse. Finally, the postoperative optical image of mouse 4 after closing up the surgical field demonstrates the loss of optical signal in the former location of the BT-474 tumor (see Figure 5F). The entire procedure, including surgical resection and acquisition of all images, was completed in < 40 minutes.

Intraoperative optical CLI of mouse 4 during surgical resection of the BT-474 (HER2/neu positive) tumor at 144 hours postadministration of 89Zr-DFO-trastuzumab. A, Background CLI of the scanner bed recorded immediately prior to commencing surgery. B, Preoperative optical CLI of mouse 4 prior to surgical incision. C, Intraoperative optical CLI of the exposed tumor immediately prior to resection. Note the increased intensity of the CLI signal owing to reduced attenuation and scattering from removal of the skin. D, Resected tumor (upper left corner) and the exposed incision site showing the complete loss of CLI signal in the exposed region of the mouse. E, CLI of the excised BT-474 tumor alone. F, Postoperative CLI of the mouse after closing the incision site with sutures. All CLIs are shown at the same radiance scale for direct quantitative comparison.
Overall, these pre-, post-, and intraoperative optical images demonstrate to our knowledge for the first time the feasibility of developing CLI as a novel surgical tool for improving surgical identification of active tumor lesions showing positive radiotracer uptake and for supporting the surgeon.
Discussion
The studies presented here build on our previous work, in which we demonstrated the potential of using the prompt optical Cerenkov emissions for noninvasive, quantitative in vivo imaging of radiolabeled antibodies. 7 The phenomenon of Cerenkov radiation from β-particle-emitting radionuclides is well established.6–11,23 Rather than presenting a further demonstration of the origins of the optical emissions, we sought to demonstrate the potential use of CLI for quantitative imaging of radiotracer distribution, and further explore how this new imaging modality may be developed and applied for preclinical and clinical applications.
The in vivo imaging and biodistribution studies confirm that accurate qualitative and quantitative information about radiotracer uptake and subcutaneous tumor localization can be obtained from temporal CLI data. Further, we provide a thorough comparison between the TAC data derived from the optical and PET imaging, which confirmed the linearity between the measured light emission intensity and the coincident positron emission data. The observed qualitative and quantitative differences between 89Zr-DFO-trastuzumab uptake in the BT-474 tumors in mice 1 to 4 and the other three tumor models demonstrate that CLI is sensitive enough to distinguish (with statistical significance) between subcutaneous tissues, with an image contrast ratio on the order of 2:1 target-to-background uptake. Given the encouraging results presented here, it seems likely that novel uses of quantitative CLI can be developed using many other common radiotracers and radiotherapeutics, including immuno-PET, and other small molecule agents, such as [18F]-fluorodeoxyglucose.6–11
The image-guided surgery demonstrates that CLI can be used as a very efficient method for identifying small tumor masses with high sensitivity, defining the localization or extent of tumor lesions with accurate delineation of tumor margins, and monitoring the progress of or guiding surgical resection. It is of interest to note that from ex vivo analysis, the absolute amount of 89Zr activity in the BT-474 tumor following tumor resection was only 20.4 kBq (0.55 μCi). Although, in these studies, we did not explicitly investigate the absolute lower limit of activity concentration required for in vivo delineation of subcutaneous tissue, our observations do demonstrate the high degree of sensitivity of CLI, which further supports the development of novel optical intraoperative or even laparoscopic or endoscopic tools based on CLI for clinical application.
Other intraoperative imaging methods used clinically, in, for example, sentinel lymph node detection, include visual staining with patent blue and γ-probe detection of 99mTc nanocolloids.4,5 However, each of these methods has its limitations. Patent blue is known to migrate very rapidly, providing only a transient window of opportunity for visualizing lesions. The use of γ-probe imaging is limited by the requirement to use large amounts of radioactivity and by the low spatial resolution of γ-ray detection. In contrast to PET and CLI, γ-ray detection is also nonquantitative. Optical imaging by CLI has the potential to circumvent many of these problems by providing almost real-time, quantitative information on radiotracer uptake with high sensitivity while limiting the radiation dose to the patient and surgical teams. Importantly, many clinically used advanced radiotracers approved by the Food and Drug Administration, such as labeled antibodies, can be used without the need for bulky and expensive equipment. Instead, a relatively inexpensive optical device based on CLI detection could be used. This unique combination of optical imaging from radiotracers makes intraoperative CLI a highly attractive approach.
As a result of the unique imaging characteristics of Cerenkov radiation, CLI has the potential to find future use in a wide range of preclinical and clinical applications. These applications include but are not restricted to the optimization of radiopharmaceutical design or target identification via high-throughput in vivo screening; the development of low-cost radiotracer imaging equipment that might be used as an alternative to PET in certain circumstances; the use of prompt optical Cerenkov luminescence emissions in a technique analogous to autoradiography; in vivo Cerenkov luminescence tomography 11 ; the use of broad-spectrum Cerenkov emissions as an internal excitation source for fluorescent markers or photoexcitable/cleavable reporter systems; coregistered three-dimentional CLI/PET as a validation tool of bioluminescent reconstruction algorithms; and, as demonstrated here, CLI as the basis of new optical laparoscopic tools for intraoperative, image-guided surgery. In combination with the high target specificity provided by 89Zr-radiolabeled mAbs, it is conceivable that a patient could be imaged by PET at 24 to 72 hours postadministration of the radiotracer to locate tumor lesions, enter surgery approximately 24 hours after the first PET image with CLI used to define accurate tumor margins, and then undergo postoperative PET imaging to confirm the efficacy of the surgical procedure.
Conclusions
In this work, we presented experimental confirmation of the potential of using Cerenkov radiation from β-particle-emitting radiopharmaceuticals as a qualitative and quantitative tool for assessing radiotracer distribution in vivo. Changes observed in the CLI data measured with respect to time, tumor model, and radiopharmaceutical formulation were fully consistent with the corresponding PET data recorded in the same mice. An excellent correlation was found between the average and maximum ROI data between the optical and PET images. Further, all image data were corroborated by quantitative ex vivo assessment of radiotracer biodistribution.
We also present the first demonstration of the use of CLI as a tool facilitating image-guided surgical identification and resection of tumors based on the optical signature of localized radiotracers. Overall, these studies pave the way for further use and development of CLI as a novel optical imaging modality for both preclinical and clinical applications.
Footnotes
Acknowledgments
We thank Bradley Beattie and Drs. NagaVaraKishore Pillarsetty, Pat Zanzonico, and Michael R. McDevitt for informative discussions and advice.
Financial disclosure of authors: This work was supported in part by the Office of Science (BER), US Department of Energy (Award DE-SC0002456 to J.S.L.), the Geoffrey Beene Cancer Research Center of MSKCC (to J.S.L.), and the NIH (P30 CA008748-44S5; R25T CA096945, A.R., fellow). Technical services provided by the MSKCC Small-Animal Imaging Core Facility are gratefully acknowledged and were supported in part by NIH grants R24 CA8308, P30 CA08748 and CA086438.
Financial disclosure of reviewers: None reported.