
Abstract

Chip Fabrication and Setup
The microfluidic chips used in this study were implemented as a two-layer polydimethylsiloxane (PDMS) microfluidic chip similar to published procedures, summarized briefly as follows. 1 The channels on the upper layer are flow microchannels used for the reagent inlets, filling chambers, and output of generated droplets, whereas the channels on the lower layer are control channels that can be pressurized or depressurized to open or close the corresponding microvalve(s). Silicon wafer molds composed of photoresist-patterned microstructures for fabrication of the fluid and control layers were created by standard photolithographic techniques. Both molds were pretreated with trimethylsilyl chloride vapor for 10 minutes to facilitate the release of final PDMS replica. Well-mixed PDMS prepolymer (GE RTV615, total weight 36 g, mixing ratio A:B = 5:1) was poured onto the fluid layer mold to give a 6 mm–thick fluidic layer with approximately 40 μm channel depth. Another portion of PDMS prepolymer (GE RTV615, total weight 10 g, mixing ratio A:B = 20:1) was mixed and then spin-coated onto the control layer mold at 1,500 rpm for 60 seconds. The fluidic and control layers were cured at 80°C for 15 and 18 minutes, respectively. After baking, the fluidic layer replica was peeled from the mold and aligned onto the control layer, and then the assembly was baked at 80°C for at least 6 hours to adhere the layers. The chip was peeled off the mold when the fluidic and control layers were firmly bonded together. Holes were then punched to form ports connected to the fluidic layer channels for reagent inlets and outlets and ports connected to the control layer channels for microvalve and pump actuation with hydraulic fluid (water). Adhesion of the chip to a clean glass microscope slide to seal the control channels was achieved by corona discharge treatment. The microfluidic device was baked in an oven at 80°C for 72 hours to restore the intrinsic hydrophobicity of PDMS surfaces, which is needed to minimize reagent loss and nonspecific binding of biomolecules on channel walls when moving aqueous droplets.
Microvalve control lines were filled with water as hydraulic fluid. Microvalves were actuated by pressurizing the corresponding control channels (up to 60 psig) via electronic solenoid valves (Series S070, SMC, Toyko, Japan). All valves were automatically controlled through a data acquisition module (USB-4750, Advantech, Milpitas, CA) driven by a custom software program written in Lab View (National Instruments, Austin, TX). The microfluidic system includes two microfluidic chips (a distribution chip of pH buffers and a DMDG chip connected by tubing). The DMDG chip is composed of three functional parts (see Figure 1B): (1) a droplet generation core, where specific quantities of reagents are measured and merged into composition-specific droplets; (2) a peristaltic pump, which produces serial compressed nitrogen pulses that can precisely deliver intact droplets to the desired location; and (3) a mixing channel. Figure S1 shows the external solution distribution chip (see Figure S1A) and the droplet generation core (see Figure S1B).

A, The distribution chip includes 1 washing buffer channel, 1 compressed nitrogen channel (for pushing out pH buffers), and 14 different pH buffer inlets that provide pH control buffers. B, The DMDG core includes five reagent inlets, one vacuum inlet, one washing inlet, one waste outlet, one compressed nitrogen inlet, and one droplet outlet. All the reagents are loaded into the chip by compressed nitrogen.
The unique features of our DMDG chip (see Figure 1B) are (1) independent control of volume and composition for every droplet, enabling screening with minimal reagent consumption; (2) the ability to pause, modify, and restart the droplet generation process, for example, for replacement or change of reagents; and (3) the use of nitrogen gas rather than oil to separate droplets, eliminating the need for oil removal steps afterward. Using the microvalves to isolate each reagent inlet, the incoming reagents are not in contact with each other until the moment of droplet formation. They will be rapidly mixed and reacted thereafter while moving along the microfluidic channel. This is particularly critical because some radiolabeling tags, such as [18F]SFB, are often unstable and prone to hydrolyze or decompose at a higher pH.
Anti-PSCA A2 Diabody
PSCA is a cell surface glycoprotein overexpressed in prostate cancer. Over 80% of human prostate cancers examined, including local disease and the metastatic bone lesions, express PSCA. We have previously demonstrated that different antibody fragments derived from humanized 2B3 anti-PSCA antibody, including minibodies (80 kDa) and diabodies (50 kDa) labeled with 124I, were able to specifically image PSCA-expressing xenografts in mice by microPET. Humanization resulted in a loss of affinity compared to the parental monoclonal antibody, necessitating affinity maturation using molecular evolution by yeast display. 2B3 single-chain Fv variants were generated by error-prone polymerase chain reaction and were expressed as a library on the surface of yeast cells. Three yeast clones with improved affinity, A2, A11, and C5, were selected, with A2 demonstrating highest affinity. The A2 diabody construct was generated by fusing the VH and VL domain with a 5-amino acid linker, and a 6 histidine tag was added to the C-terminus for purification and detection. The protein sequence of A2 diabody is as follows: DIQLTQSPSSLSASVGDRVTITCSASSSVRFIHWYQQKPGKAPKRLIYDTSKLASGVPSRFSGSGSGTDFTLTISSLQPEDFATYYCQQWGSSPFTFGQGTKVEIKGSTSGGGSEVQLVESGGGLVQPGGSLRLSCAASGFNIKDYYIHWVRQAPGKGLEWVAWIDPEYGDSEFVPKFQGRATMSADTSKNTAYLQMNSLRAEDTAVYYCKTGGFWGRGTLVTVSSAAAEQKLISEEDLNGAAHHHHHH. A2 diabody was purified using Ni-NTA affinity chromatography. To measure the pH stability of A2 diabody, we incubated the protein at different pH values from 7.4 to 9.8 for 30 minutes. The pH was then neutralized to pH 7.4 using 1 M Tris-HCl, pH 7.4. Binding to recombinant PSCA protein was measured by enzyme-linked immunosorbent assay (A2 diabody was detected with an alkaline phosphatase conjugated anti-Myc monoclonal antibody [Invitrogen, Carlsbad, CA]). The results are presented in Figure S2 as a percentage of maximum binding.

The stability of A2 diabody (as measured by PSCA binding) in different pH buffers for 30 minutes (n = 3).
Radiosynthesis of [18F]SFB
[18F]SFB has been synthesized and produced routinely by a one-pot, microwave-assisted procedure (Figure S3). Briefly, modified from the published procedures, we developed a simplified radiosynthesis using an anhydrous deprotection strategy and microwave heating. 2 This three-step process can be performed in a one-pot matter, thus shortening the reaction time (< 60 minutes). The final radiochemical yield of [18F]SFB is about 30 to 40% (n > 30), with a radiochemical purity > 98% after radio-high-performance liquid chromatography (HPLC) purification. The [18F]SFB is concentrated on a polystyrene cartridge and eluted with diethyl ether. After solvent removal, [18F]SFB is reconstituted in PBS buffer (pH 7.4) before loading onto microfluidic chips for optimizing labeling reaction parameters (see Figure 1C).
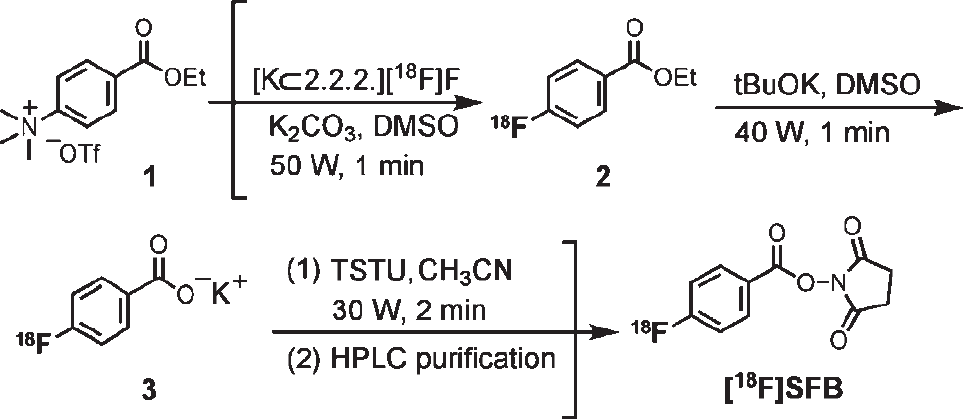
The one-pot microwave-assisted [18F]SFB synthesis.
pH Stability Test of [18F]SFB
The stability of [18F]SFB in different pH buffer was measured (Figure S4). Ten different pH buffer solutions (50 μL) were loaded into 10 individual V-vials. [18F]SFB (5 μL) was immediately added into each vial. Sequentially, the samples were injected into HPLC for analysis after 10 minutes. In the case of stability test in pH 7.4 buffer, the samples were analyzed at various time points (10, 20, 30, 60, and 120 minutes). The percent decomposed [18F]SFB versus intact [18F]SFB at different time points were plotted. [18F]SFB remained stable (> 90%) in pH 7.4 buffer after 2 hours.

A,[18F]SFB stability in different pH buffers for 10 minutes is shown. B, The stability of [18F]SFB in pH 7.4 buffer over a 2-hour time period.
Droplet Generation and Washing Process
Figure S5 describes the main features and step-by-step operation of droplet generation. A droplet composed of several reagents in well-defined volume ratios can be generated in each cycle by running the steps of Table S1. In Figure 1D, section I is used for [18F]SFB, section II for A2 Db and buffer 2, and section III for pH control buffer, respectively. The detailed operation sequence showing valve states for droplet generation is as follows: (1) the filling chambers are evacuated (≈–75 kPa) to remove air and thereby accelerate filling (≈100 ms); (2) the reagents are driven into these chambers by positive pressure (≈172 kPa; 100 ms–60 s); and (3) the reagents are merged into a single end-to-end multicomponent droplet (≈100 ms) and (4) pushed out of the reagent filling chambers via a series of nitrogen gas pulses (≈35–172 kPa) from an on-chip peristaltic pump (≈100 ms–10 s). A sealing step (50 ms) is inserted after each step to compensate for any slight variations in valve response times and ensure no cross-contamination of reagents. Because reagents are filled into isolated chambers with well-defined conditions, droplet formation is therefore not affected by long-range hydrodynamic interactions or the “history” of previously generated droplets (as is the case in continuous flow devices), enabling every droplet to be precisely and independently controlled.

Droplet generation process.
Sequence of Operations to Perform Droplet Generation
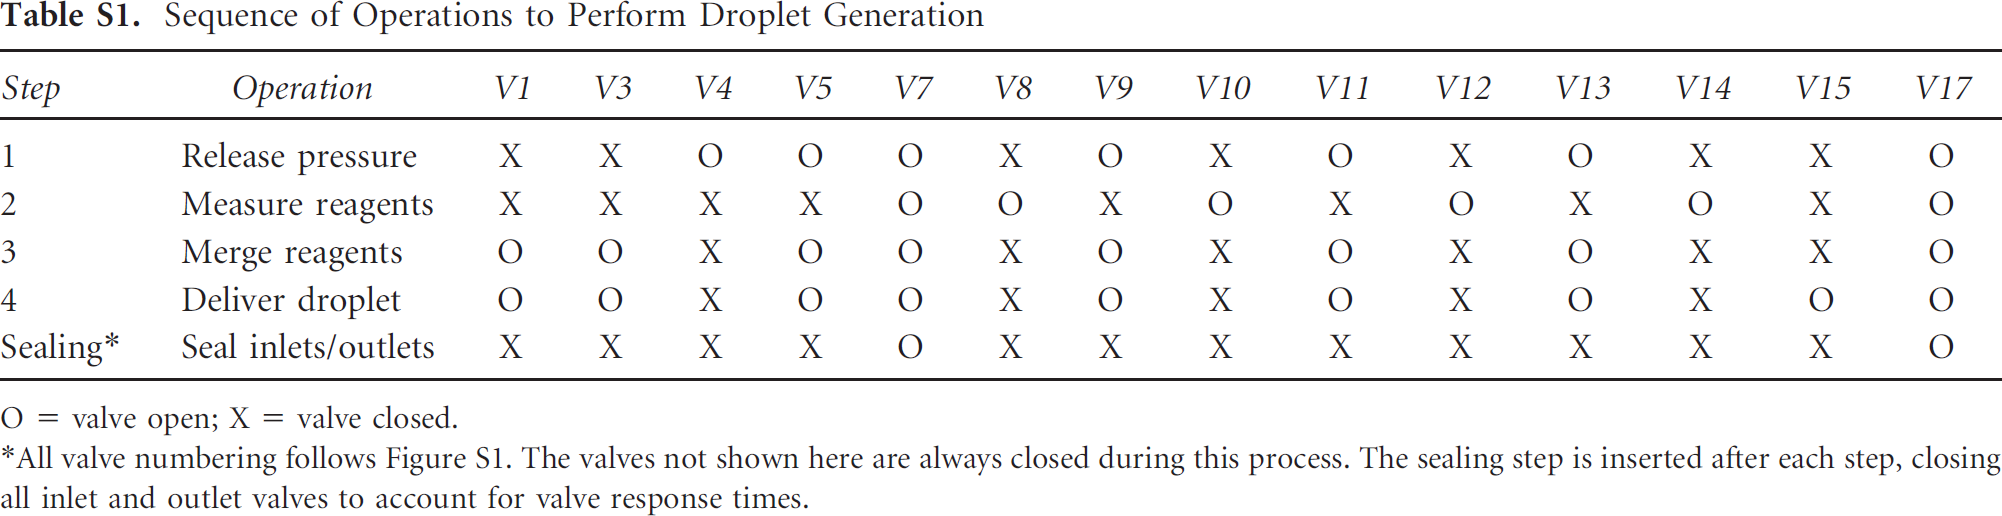
O = valve open; X = valve closed.
All valve numbering follows Figure S1. The valves not shown here are always closed during this process. The sealing step is inserted after each step, closing all inlet and outlet valves to account for valve response times.
The DMDG chip is washed by filling sections I-III with deionized (DI) water and flushing to output, following the steps in Table S2.
Sequence of Operations to Wash Droplet Generator
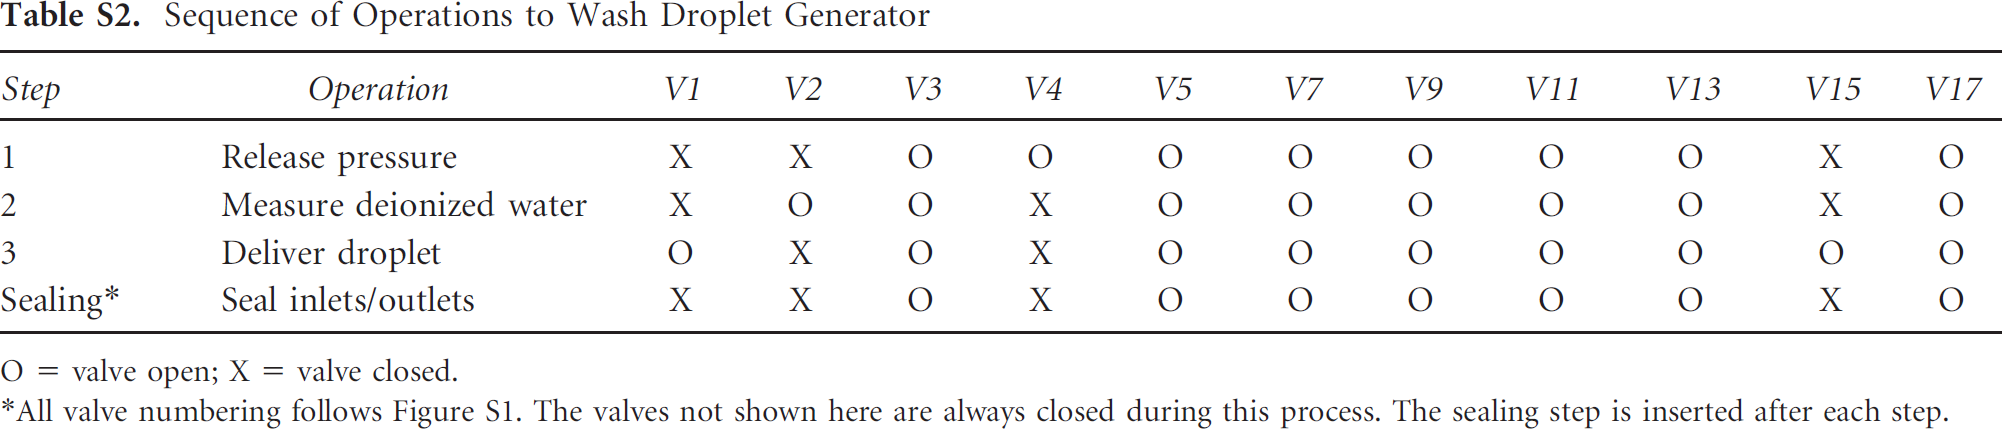
O = valve open; X = valve closed.
All valve numbering follows Figure S1. The valves not shown here are always closed during this process. The sealing step is inserted after each step.
Adjustment of pH Condition
One of the unique features of our DMDG chip is its capability of pausing and restarting droplet generation at any time during the operation process. By stopping the droplet generation process, switching pH of the reaction mixtures can be achieved using an external microfluidic distribution chip connected to vials with different pH control buffer solutions. The entire changing pH control buffers and the subsequent cleaning process are automated and accomplished in less than 1 minute. Afterward, the entire process is resumed again to produce droplets with a new composition.
The volume ratio for [18F]SFB, A2 Db, and standard pH control buffer (pH 4, 4.5, 5, 5.5, 6, 8, 8.72, 10, 11, 12, 13) is fixed (1:1:1). All three sections (I, II, and III) have the same fixed volume (≈40 nL, five-chamber units) for filling reagent. To change the pH control buffer automatically, the operation of the DMDG chip was synchronized with the distribution chip. As an example (Figure S6 and Table S3), pH buffer No. 7 is provided from the distribution chip by opening valve P7. To switch to pH buffer No. 8, valve P7 on the distribution chip is closed and valve P2 is opened to admit compressed nitrogen. At the same time, valves V14, V15, and V16 in the DMDG chip are opened. All pH buffer No. 7 contained in the two chips and the tubing between them is pushed out to the waste by nitrogen. After a few seconds, valve P1 is opened to admit PBS buffer to clean the channel. Next, valve P2 is opened to admit compressed nitrogen and expel PBS buffer from the fluid path. Then valve P8 is opened to flow pH buffer No. 8 into the DMDG chip for a few seconds. Valve V8 is then closed and the droplet generator washing cycle is performed, such that the DMDG chip is ready to generate the next droplets using this pH control buffer. In summary, using the droplet generator in combination with the pH control buffer distribution chip, droplets containing mixtures of labeling reagents at different pH values can be quickly and easily produced, and pH conditions can be rapidly optimized. In a typical experiment, 11 different pH control buffers are available from an external solution distribution chip (see Figure S6).

Schematic of the process of switching pH control buffer.
Example Sequence of Operations to Switch pH Control Buffer

O = valve open; X = valve closed.
All valve numbering follows Figure S1. The valves not shown here are always closed during this process. The sealing step is inserted after each step.
pH Measurement
Owing to the small volume of each droplet, the exact pH value of each droplet was subsequently estimated or determined by mixing the standard pH buffers, pH 7.4 PBS buffer and pH 8.7 borate buffer, in the same volume ratios in larger quantities. The final pH of each solution was determined by a conventional pH meter (Accumet AP62 pH/mV Meter, Fisher Scientific, Houston, TX). The final pHs of 11 different conditions were estimated to be 5.08, 6.60, 8.13, 8.42, 8.60, 8.68, 8.72, 8.88, 9.24, 9.42, and 10.00.
Optimization of pH on Chip
The result of screening optimal pH condition of labeling A2 Db (2 mg/mL) stored in pH 7.4 buffer using a DMDG chip is shown in Figure S7 (at 30°C, 5 minutes). Readers can refer to the section “adjustment of pH condition” for more detailed operation sequences of changing pH on chip.

Screening optimal pH labeling condition (at 30°C, 5 minutes) using a DMDG chip. A2 Db (2 mg/mL) is stored in pH 7.4 buffer (n = 3).
Adjustment of A2 Db Concentration
The flexible, microvalve-based DMDG chip is designed to facilitate adjustments of composition such that pH and biomolecule concentration can be independently controlled. From Figure 1E, the radioactive tag, biomolecule, and pH control buffer are filled into section I, section II, and section III, respectively. All three sections have the same fixed volume (≈40 nL, five-chamber units). To change the concentration of biomolecule, section II is subdivided using microvalves into two chambers for biomolecule and dilution buffer (same buffer as that in which biomolecule is stored). For example, section II can contain two-chamber units (≈16 nL) of biomolecule and the rest (three-chamber units) dilution buffer (Figure S8A). Because the total droplet volume remains unchanged, only the concentration of biomolecule is affected by this dilution. If the pH of biomolecule solution is the same as the pH of the control buffer, the dilution factor of biomolecule can be extended from 1:5 to 1:10. This is achieved by merging section II and section III and using inlet 5 and inlet 6 sequentially to load biomolecule and then dilution buffer (Figure S8B). As an example, eight-chamber units can be filled with biomolecule at first. Then the biomolecule inlet is closed and the chamber is connected with the rest of the two-chamber units. pH control buffer would continue to fill the remainder of the 10-chamber units, resulting in a final biomolecule concentration that is 80% of the original stock solution. In the present study, the original biomolecule reagent stock was 2 mg/mL in pH 8.7 buffer, and final reaction concentrations from 0.13 to 1.3 mg/mL could easily be produced on-chip.

Adjusting concentration of A2 Db. A, If pH buffer of A2 Db is different from pH control buffer (inlet 7), the concentration of A2 Db can be adjusted only by changing the ratio of A2 Db (inlet 5) and buffer 2 (inlet 6), which is the same buffer in which A2 Db is stored, in section II. B, If A2 Db buffer is the same as pH control buffer, the concentration of A2 Db can be adjusted by changing the ratio of A2 Db (inlet) and pH control buffer (inlet 7) in sections II and III. (Inlet 6 is not used in this case.)
To determine the specific activity of [18F]FB-A2 Db, its radioactivity was measured using a dose calibrator (CRC-25R, Capintec, Ramsey, NJ). The concentration (ie, amount) of A2 Db is determined by UV absorption measurement (280 nm). The molecular weight of A2 Db and its extinction coefficient were calculated according to its amino acid sequence (ProtParam Tool, ExPASy, SIB). Calculated SAs (Ci/mmol) were derived by dividing total radioactivity obtained after purification by mmoles of diabody in the labeling reaction (based on a molecular weight of 55,000 Da). It was also corrected by the radiochemical purity of final purified product determined by iTLC.
Scale-up Using the Bench-Scale Method
After optimizing pH and concentration, these labeling conditions can be scaled up. The same batch of PSCA A2 Db solution in a borate-saline buffer (1 mg/mL, pH 8.7, 50 mM) and [18F]SFB in a pH 7.4 PBS buffer were used to conduct labeling reactions to compare the bench-scale method and microfluidic approach. Both methods used the same conditions: one-unit volume of [18F]SFB and two-unit volumes of anti-PSCA A2 diabody. After mixing and reacting for 5 minutes at 30°C, the radiochemical yields were measured by iTLC and SEC-HPLC (Biosep SEC S-2000, Phenomenex, Torrance, CA). For iTLC, the radiolabeled conjugates were evaluated by mobilization in normal saline. Strips were cut in half (bottom half: bound radiolabel; top half: free radiolabel) and counted in a gamma counter (Wizard 3). Using this method, the radiochemical yields were 21.5% from the microfluidic chip and 22.1% from the vial. The radiochemical yields of the same batch of radiolabeled conjugates by SEC-HPLC were 21.8% and 23.3%, respectively (Figure S9). Radiolabeled diabody was separated from free [18F]SFB and [18F]FBA by a spin column (Micro Biospin 6 column, which had been preequilibrated with PBS and used according to the manufacturer's provided protocol). Following separation on the spin column, the radiochemical purity of [18F]FB-A2 Db was greater than 95% (Figure S10).

Size-exclusion chromatographic analyses of crude [18F] FB-A2 Db obtained by the microfluidic chip approach and bench-scale method. The first peak is [18F]FB-A2 Db. The labeling yields are 21.8% from the chip approach and 23.3% from the bench-scale approach. Radioactivity (black); UV trace: 254 nm (red) and 280 nm (green).

Size-exclusion chromatographic analyses of final purified [18F]FB-A2 Db.
MicroPET/CT Imaging of Hydrolyzed [18F]SFB
As a control experiment, 4-[18F]fluorobenzoic acid ([18F] FBA, ie, hydrolyzed [18F]SFB), was also injected into the tail vein of a tumor-bearing mouse and microPET and CT scans were performed 2 hours postinjection (Figure S11).

Coregistered microPET/CT scan images of a nude mouse injected with 4-[18F]fluorobenzoic acid ([18F]FBA, ie, hydrolyzed [18F]SFB) 2 hours post–tail vein injection.
Optimization of [18F]SFB Labeling Anti-HER2 Diabody
We also applied this microfluidic-based method to optimize the [18F]SFB labeling of a different protein (an anti-HER2 diabody; the concentration of stock solution is approximately 0.5 mg/mL). After screening for the optimal pH and concentration, it was found that the optimal pH is around 8.6 and the optimal concentration is around 0.33 mg/mL (Figure S12). Using this optimized labeling condition, we succeeded in obtaining enough [18F]FB-anti-HER2 Db (RLY = 18.2%) for microPET studies in a xenografted mouse (MCF-7/HER2) (Figure S13).
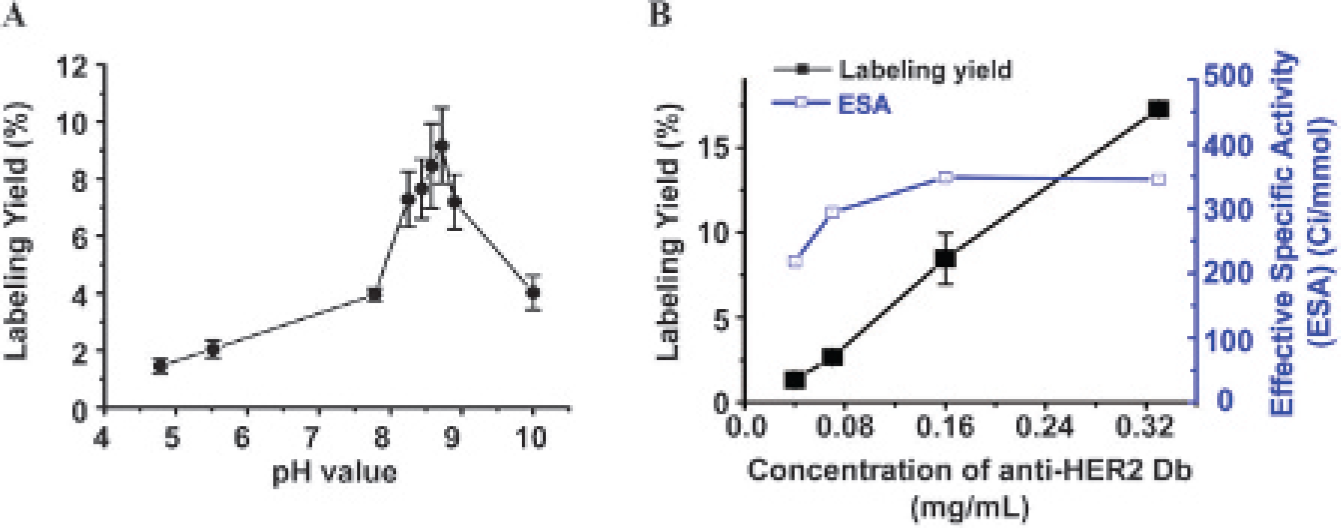
(A) Screen pH (n = 3, anti-HER2 Db: 0.17 mg/mL) and (B) concentration (n = 3) of anti-HER2 Db using a microfluidic chip.
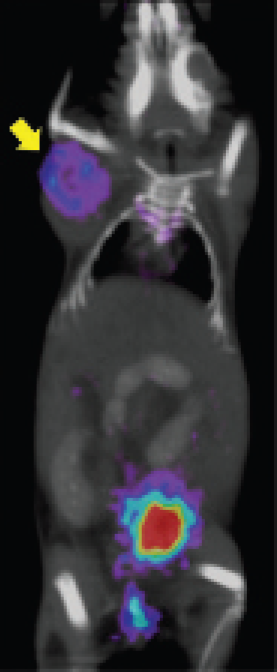
Coregistered microPET/CT scan images of a tumor-bearing mouse (MCF-7/HER2 overexpressing cells) injected with [18F]FB–anti-HER2 Db (6 hours postinjection).
MicroPET/CT Imaging of [18F]FB–Anti-HER2 Diabody
There are two short movie clips available on-line to show: Movie S1. Process of droplet generation: first droplet. Movie S2. Change in droplet composition on the fly.