
Abstract
Human epidermal growth factor receptor 2 (HER2) overexpression in breast cancers is associated with poor prognosis and resistance to therapy. Current techniques for estimating this important characteristic use ex vivo assays that require tissue biopsies. We suggest a novel noninvasive method to characterize HER2 expression in vivo, using optical imaging, based on HER2-specific probes (albumin-binding domain–fused-(ZHER2:342)2-Cys Affibody molecules [Affibody AB, Solna, Sweden], labeled with Alexa Fluor 750 [Molecular Probes, Invitrogen, Carlsbad, CA]) that could be used concomitantly with HER2-targeted therapy. Subcutaneous tumor xenografts, expressing different levels of HER2, were imaged with a near-infrared fluorescence small-animal imaging system at several times postinjection of the probe. The compartmental ligand-receptor model was used to calculate HER2 expression from imaging data. Correlation between HER2 amplification/overexpression in tumor cells and parameters, directly estimated from the sequence of optical images, was observed (eg, experimental data for BT474 xenografts indicate that initial slope, characterizing the temporal dependence of the fluorescence intensity detected in the tumor, linearly depends on the HER2 expression, as measured ex vivo by an enzyme-linked immunosorbent assay for the same tumor). The results obtained from tumors expressing different levels of HER2 substantiate a similar relationship between the initial slope and HER2 amplification/overexpression. This work shows that optical imaging, combined with mathematical modeling, allows noninvasive monitoring of HER2 expression in vivo.
Radiolabeled trastuzumab,4–7 or F(ab') fragments of trastuzumab, has been used for imaging of HER2-positive tumors. However, owing to the competition of the imaging and therapeutic molecules for binding to these receptors, trastuzumab-based tracers cannot be used to monitor possible changes in HER2 expression caused by treatment with this antibody. A promising alternative to antibodies as targeting agents is the use of Affibody molecules (Affibody AB, Solna, Sweden).8,9 These relatively stable proteins are not only smaller than single-chain antibody fragments and, therefore, require a shorter washout time for an optimal signal to background ratio, but also bind to a different HER2 epitope than trastuzumab. Not interfering with trastuzumab, Affibody molecules may be used to monitor HER2 expression changes in tumors treated with this antibody. We and others have described radioconjugates of Affibody molecules labeled with indium 111, 10 technetium 99m, 9 fluorine 18,11,12 and Alexa Fluor (Molecular Probes, Invitrogen, CA). 8
Owing to its minimal invasiveness, optical imaging presents an attractive option for serial imaging of tumors and monitoring of possible changes of receptor expression during the course of treatment. Reduced fluorescence background and enhanced tissue penetration by near-infrared (NIR) light allow detection of targets located at the depth of several centimeters in the tissues.13,14 Many groups have reported successful in vivo NIR fluorescence imaging.15–19 Although most of these studies are qualitative, quantitative methods necessary for adequate monitoring of the receptor status are beginning to emerge.8,20
In this work, we investigated whether temporal changes in the signal detected in tumor xenografts following injection of an Affibody-based, HER2-specific fluorescence contrast agent could be used to monitor the in vivo status of the receptors.
Materials and Methods
Imaging Probe
Labeling of HER2-specific albumin-binding domain–fused (ABD)-(ZHER2:342)2-Cys Affibody molecules with Alexa Fluor 750 fluorophores and the in vitro and in vivo characteristics of the resulting conjugate were described in detail in our previous report. 8
Tumor Models
The animal study was approved by the Institutional Review Board of the National Cancer Institute (Animal Study Proposal # ROB-117). Twenty-one animals were used. Tumor cells (BT474, MD-MBA-361, MCF7, and U251) expressing different levels of HER2 were implanted into the right flanks of 6- to 8-week-old athymic nude mice as described previously. 8 Briefly, 5 to 10 × 10 6 cells in 0.2 mL of 50% Matrigel (BD Biosciences, Bedford, MA) were injected subcutaneously into the right flanks. Using calipers, tumor size was measured periodically and the tumors were allowed to grow to approximately 5 mm in diameter. The typical weight of the xenografts used for the imaging study was 100 to 300 mg. In the initial set of experiments, we considered three mice in each tumor category (the only exception was the U251 case, that is, the tumor with no HER2 receptors, where data from one mouse were analyzed). The follow-up measurements, aimed at comparison of postinjection temporal variations of the fluorescence intensity in the tumor area with HER2 overexpression as measured in the same tumor by conventional enzyme-linked immunosorbent assay (ELISA) ex vivo, were performed for a sample of five mice with xenografts of BT474 carcinoma, expressing the highest level of HER2 (3+).
Fluorescence Measurements
Fluorescence intensity was quantified using an in-house-created, time-resolved NIR fluorescence small-animal imaging system, 20 operating in reflection geometry. This system includes a time-correlated single-photon counting device (SPC-730, Becker & Hickl, Berlin, Germany) in conjunction with a high–repetition rate tunable pulse laser (Tsunami, Spectra Physics, Mountain View, CA) to detect individual photons. It uses a photomultiplier tube (PMT) (R7422, Hamamatsu Corporation, Hamamatsu City, Japan) as a detector and a temperature-controlled scanning stage (National Aperture, Inc., Salem, NH) with an electrocardiogram and temperature monitoring device (Indus Instrument, Webster, TX). The imaging head of the device incorporates multimode optical fibers, delivering light from an excitation source to the sample and emitted fluorescence signal from the sample to the detector. The fibers were arranged as a linear array with one of the end fibers, coupled to the excitation laser beam, being used as a source fiber, whereas other fibers were used to collect emitted (fluorescent) light. To measure time-resolved fluorescence intensity, emitted light was delivered to the PMT via detection fibers. The small-animal imager scanned the sample surface (eg, skin or other tissue) in a raster pattern, producing a real-time two-dimensional image. A cooled charge-coupled device camera was located on the top of the scanning stage to guide the scan to the region of interest (ROI). In the current study, a laser source of 750 nm was used to excite the fluorophore, and an emission filter of 780 nm was used for fluorescence detection. Our approach does not involve three-dimensional reconstruction of the tissue abnormality, as implied by conventional optical tomography. Instead, we use reflectance imaging of the ROI to realize a novel tool for optical biopsy. This methodology allows us to quantify the tumor cells' characteristics in vivo from the time sequence of fluorescent images.
To analyze the specific target accumulation of the imaging probes, mice were anesthetized by inhalation of isoflurane. Approximately 10 μg of Affibody conjugates was injected into the tail vein and imaged at predetermined time points after injection. The fluorescence signal mean and standard deviation were calculated by averaging the maximum pixel values over the tumor area and corresponding contralateral side. In the initial series of experiments, aimed at quantification of the time courses of fluorescence intensities for different types of carcinomas, measurements started 3 hours after injection and were performed during 72 to 75 hours after injection (at 8 time points: ti = 3, 6, 12, 20, 24, 30, 48, 72 hours for BT474; ti = 3, 6, 10, 18, 21, 26, 48, 75 hours for MD-MBA-361; ti = 3, 6, 12, 21, 24, 28, 48, 72 hours for MCF7). In the follow-up series, focused on analysis of individual variations in HER2 expression for the same type of tumor (BT474), two time points were added to the measurement sequence to investigate more accurately the initial rise in the fluorescence intensity after injection of the contrast agent (t0 = 1–2 hours and t4 = 13–14 hours).
Enzyme-Linked Immunosorbent Assay
HER2 expression level in xenograft tissue was assessed by ELISA. Ex vivo tumor tissue was homogenized in a suspension buffer supplemented with a protease inhibitor mix (Roche Applied Science, Indianapolis, IN) and ethylenediaminetetraacetic acid (EDTA) (5 mM), followed by HER2 extraction and centrifugation. The assay was performed according to the protocol provided by the manufacturer (Calbiochem, Gibbstown, NJ) using a serial dilution of recombinant HER2 protein as a standard. HER2 concentration is expressed in nanograms of HER2 per milligram of total protein.
Mathematical Model
Theoretical analysis of the data is based on the compartmental ligand-receptor model, a simpler version of the one used for quantification of the specific receptor density in positron emission tomographic (PET) studies. 21 The non-equilibrium, nonlinear model includes three compartments (free ligand in blood plasma, free ligand in tissue, and, specifically, HER2 receptor–bound ligand with concentrations Ca*,F*, and B*, respectively). Association of fluorescent ligands (Affibodies) with HER2 receptors is determined by the kinetic rate kon. The total concentration of available HER2 receptors in the tumor, B′max, limits the binding process.
Several assumptions were made in this study to simplify our analysis:
The dissociation rate constant is low enough to disregard the ligand-receptor dissociation during the whole observation period of 0 to 72 to 75 hours. The end of the initial distribution phase, when free ligands are uniformly distributed in the mouse bloodstream, occurs before t1 = 3 hours. The HER2 receptor–bound ligands' concentration in the tumor area B* is negligible at t = t1. Local free ligand concentration in the tumor tissue F*(t) is constant during the measurement period, t ⩾ t1.
Applicability of these assumptions for our case is substantiated by analysis of the experimental data presented below. To avoid potential misunderstanding, it is worth noting that characteristic time scales for specific accumulation of the contrast agent in the tumor area are expected to be much longer in the case of conjugates of Alexa Fluor 750 with an ABD-containing Affibody used in this study, compared to those observed for HER2-specific Affibody conjugates used in PET imaging studies.
At the first approximation, accumulation of the HER2-bound fluorescence-labeled Affibody molecules in the tumor is described by a simple equation:

similar to equation 6A from the article by Delforge and colleagues. 21 Thus, for F* = const:

If the fluorescence intensity, as a function of time, is measured over a relatively long period of time up to t > 1/konF*, equation 2 is a good starting point to quantify B′max, although, if kon or F* is not known, only relative values of B′max for different tumor types can be found.
Fluorescence intensity, originating from the tumor area, consists of three major components, related to free ligands in blood and tumor tissue, and ligands bound to HER2 receptors, respectively:

where coefficients α, γ, and ε are assumed constant, decay time τ is to be determined from contralateral measurements, and the initial concentration of bound ligands (the last term) is zero. We suggest that concentration of free ligands in tumor tissue F* = constant, for t ⩾ t1 (ie, after the initial distribution phase). Hence, the natural steps to separate their contributions are as follows:
Normalize intensity data for all mice to the same initial level, corresponding to some early time point, say, the average value of Exclude the effect of free ligands in blood plasma from measured intensities by subtracting values of Fit obtained data points with the function
Results
Considerable changes in fluorescence intensity over time were observed after probe injection. Whereas significant variations in the temporal course of fluorescence intensity from the tumor were apparently correlated with the tumor type, the temporal data from the contralateral side were similar for all cases. The above observation reflects an approximately exponential decrease in the free fluorescence ligand concentration in the blood, most likely owing to clearance of the fluorophore. In Figure 1A, we present corresponding exponential fits Ibl(t) = Ibl(0)exp(− λt) for MCF7 and MDA-MB361 temporal profiles of fluorescence intensity. Data after the background subtraction have been averaged over the corresponding samples. It should be noted that the washout time,
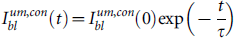
Here the exponential decay time is similar, τ = 27 to 28 hours for the two sites. Higher tumor intensities can be explained by the higher blood volume compared to normal tissue, resulting from angiogenesis. For t ⩾ 30 hours, tumor data imply an additional contribution to fluorescence intensity from some other (ie, other than blood) ligand compartment, for example, free ligands in tissue. This potential contribution slowly increases with time (from 5,140 to 5,828 units between t = 48 hours and t = 75 hours).

A, Exponential decay a exp(-bt) fit to contralateral data for MCF7 and MDA-MB361 cases. B, U251 tumor and contralateral data (after background subtraction) (residual values for long times t = 48, 72 hours I1, 2 = 5140, 5828, respectively).
For analysis of HER2 receptor concentration, we use the temporal variation of the difference between signal from the tumor area and that of the contralateral side. This allows us to eliminate the background and, partly, the contribution from the free ligands in blood. A special procedure to exclude additional blood contribution, resulting from increased blood volume in the tumor area, is described in the next section.
Imaging data from the tumor area, taken at some arbitrary time point after injection, may seem similar for different types of tumors. All of them present a bright spot close to the tumor center. However, a close look at corresponding temporal dependencies of the fluorescence intensity reveals important qualitative differences in these profiles for tumors with different levels of HER2 expression. This fact is illustrated by Figure 2A, where the difference between the signal from the tumor and that of the contralateral side is presented as a function of time for four tumor types, differing in HER2 expression. All of the data have been normalized on an initial time point (3 hours). One can see that there is a clear maximum in this intensity dependence for carcinomas with overexpressed HER2, and it is most prominent for BT474 tumor that has the highest expression level of HER2. On the other hand, for a U251 tumor with no HER2 overexpression, this intensity just decreases with time.
To substantiate our assumption that most of the specific probe accumulation at the tumor occurs after t1 = 3 hours, even for the BT474 carcinoma, expressing the highest level of HER2, we present in Figure 2B a typical dependence of the difference between signal from the tumor area and that of the contralateral side, measured for one of the mice in the second series of measurements, when the data for shorter times, t0 = 1 hour, are available. The obtained curve presents a steep rise in fluorescence intensity up to the maximum value, reached at t ≈ 20 hours.
In Table 1, we present temporal data (tumor minus contralateral side), averaged over all tumor category subsamples that are the basis for further investigation.
We used the simple kinetics model, as described above, to estimate relative concentrations of HER2 receptors for three types of tumors from the data in Table 1 (tumor minus contralateral side), averaged over each tumor category subsample. Because it is complicated to control the initial concentration of labeled Affibody molecules in the blood circulation, owing to different total blood volume in the mouse circulation and inaccuracies in preparation of marker solution for injection, it is reasonable to start with normalization of intensity data for all mice at the same initial level, say, the average value of
In Figure 3, the results of this procedure are presented for BT474, MDA-MB361, and MCF7 xenografts. Obtained parameters of initial slope P = ab and asymptotic intensity S = y0 + a, which are presented in Table 2, were compared with known parameters from the literature data on amplification and overexpression of HER2 in breast carcinoma cell lines (see the values published in Pegram and colleagues 22 and Kallioniemi and colleagues 23 ).

A, Difference between normalized tumor–contralateral side data, as a function of time, for four tumor types, differing in HER2 expression. B, Difference between normalized tumor–contralateral side data (BT474 xenograft), measured at shorter time intervals in the first 25 hours for one of the mice in the second series of measurements.
Difference in Intensities between Tumor and Contralateral Side Data for Each Tumor Category

Data averaged over each subsample.
The correlation found between tumor cell characteristics and parameters, directly estimated from the optical images, is shown in Figure 4 and Figure 5. Three plots in Figure 4A illustrate the observed correlation of the slope P with HER2/neu expression (I), HER2 gene copies per cell (II), HER2 gene copy per 17 cen (III) (17 cen = chromosome 17 centromere probe signals), and columns 2, 3, and 4 from Table 1 of Pegram and colleagues 22 (columns 3 and 4 are obtained by the fluorescence in situ hybridization method 8 ). Which of these intrinsic parameters better describes the concentration of HER2 in vivo, B′max, is not clear at this point. However, one can see that over the broad range of HER2 characteristics, all of these plots are well represented by linear regression, passing through the origin, as expected from equation 2, although larger deviations from linearity are observed for HER2/neu expression.

Fitting of normalized tumor–contralateral site data by a function y = y0 + a*(1-exp(-bx)).
Similar results are observed for the asymptotic parameter S (see Figure 4B): linear dependencies on the above-mentioned tumor HER2 characteristics, I, II, III, although not passing through the origin (S ≠ 0 for B′max = 0, implied by zero value of I, II, and III), possibly owing to the contribution of unlabeled Affibody molecules in the tumor tissue (second term in the left hand side of equation 4). It is worth noting that, according to linear regression fit, the residual intensity for B′max = 0 is Ir ≈ 5,600 ± 250 au, which is close to the residual intensity of ≈ 5,800 au, observed at t = 72 hours for the case of tumor U251 without HER2 receptors (after subtraction of blood contribution). Parameters are summarized in Table 3.
To further substantiate our methodology and to improve its statistical significance, in the follow-up experiments, we compared postinjection temporal variations of the fluorescence intensity in the tumor area with individual HER2 overexpression, measured ex vivo in the same tumor by conventional ELISA. This analysis was performed for an additional sample of five mice with xenografts of BT474 carcinoma (3+ in the conventional HER2 classification). Estimated initial slopes, characterizing the temporal profile of fluorescence intensities from the tumor after marker injection, were compared to values of HER2 overexpression obtained by ELISA for the individual mouse after sacrificing the animal. It should be emphasized that the estimates of these initial slopes and the results of ELISA of the individual tumors were performed completely independently and then compared. We found that if we arranged the tumor data points in the order according to the ELISA reading, corresponding slopes would also be arranged in a similar order, that is, from the lowest to the highest one. If compared characteristics (slope, ELISA reading) were not correlated, the probability p of such realization by chance was an inverse of a number of possible permutations,
Parameters Initial Slope P = ab, and Asymptotic Intensity S = y0 + a Extracted from the Fit of Experimental Data for Three Tumor Types to the Theoretical Model y = y0 + a(1–e−bx)*
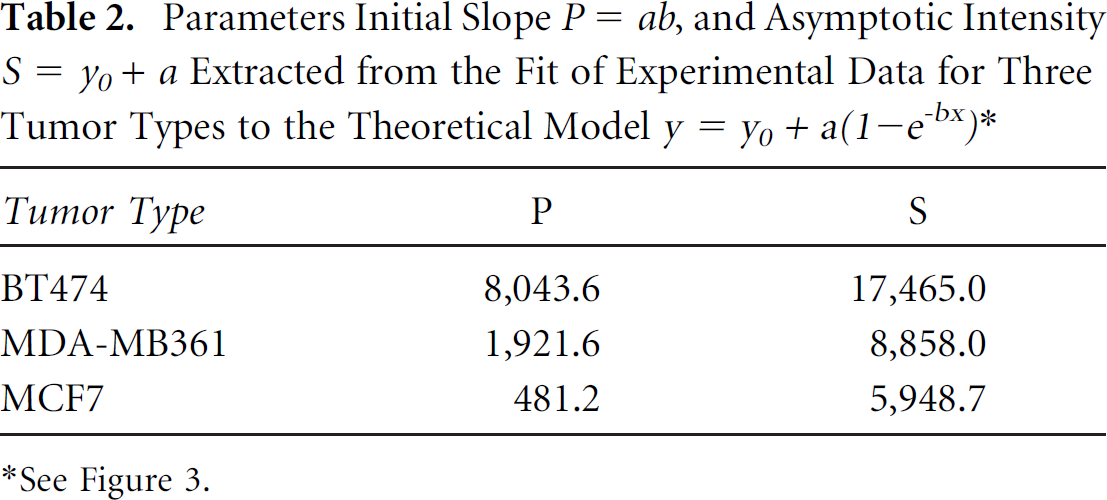
See Figure 3.

A, Correlation between parameter P = ab (intial slope) in the exponential regression and quantitative characteristics of amplification and overexpression of HER2 for breast carcinoma cell lines MCF7, MDA-MB361, and BT474. B, Correlation between parameter S = y0 + a (asymptotic intensity) in the exponential regression and quantitative characteristics of amplification and overexpression of HER2 for breast carcinoma cell lines MCF7, MDA-MB361, and BT474.
Discussion
Analyzing the NIR signal from in vivo experiments presents a complex problem. Strong light scattering in tissues results in inferior resolution of optical imaging for deep tissue abnormalities. Nevertheless, taking into account the known advantages of NIR imaging, several research groups pursue the application of this modality for imaging and quantification of breast abnormalities, located at different depths up to 4 to 9 cm in breast tissue.14,24–28 The general idea of these efforts is to map optical parameters of the tissue abnormality (eg, scattering and absorption coefficients—see a recent review and references there 29 ), and relate the perturbations in optical parameters to variations in the physiologic status of the tissue, that is, blood volume/oxygenation. However, up to now the results of optical mammography for characterization of abnormalities have not been sufficiently conclusive to be clinically important. Using a bolus of indocyanine green as a nontargeted absorbing contrast agent allows one to improve the detectability of regions with increased blood volume, but no significant variations in washout kinetics of tumors and healthy breast tissues were observed.
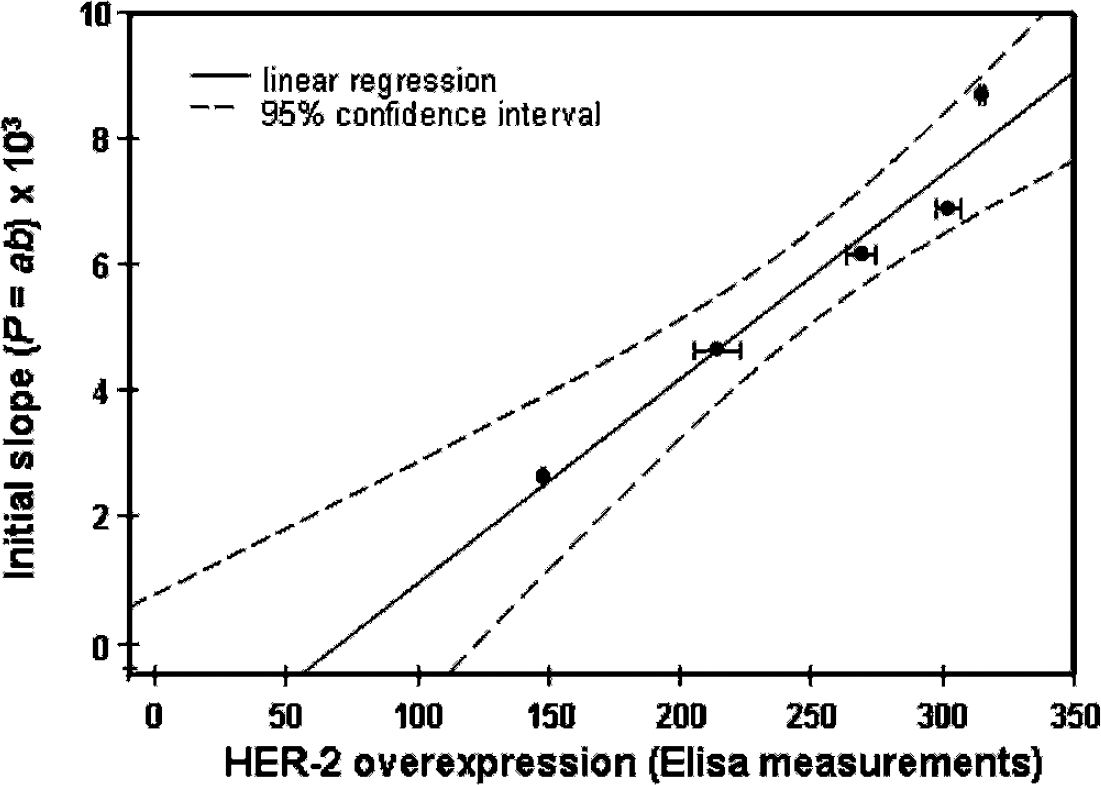
Correlation between parameter P = ab (intial slope) in the exponential regression and overexpression of HER2 for breast carcinoma cell BT474, measured by ELISA ex vivo after optical imaging of the same mouse at different time points in vivo.

17 cen = chromosome 17 centromere probe signals; ELISA = enzyme-linked immunosorbent assay.
It should be noted that our focus on analysis of signal changes as a function of time does not involve high-resolution mapping of the ROI and sophisticated three-dimensional reconstruction algorithms (that up to now have not been successfully realized for clinical studies). Although limited in its scope to evaluation of overexpression of specific receptors in the tumor area (ie, in the region with highest fluorescence intensity, originating from specific markers), it is much less sensitive to many uncertainties (e.g. depth of the fluorophore, optical parameters etc.), characteristic for deep tissue imaging, and can be useful for “optical biopsy” of the tumor in vivo, for example, for patient selection or to monitor the response to therapy. Our approach is based on comparison of fluorescent images of the ROI, obtained at subsequent time points after injection of the contrast agent. Under the reasonable assumption that optical properties of the tissue/tumor and imaging geometry are not changed after injection (at least for ≈ 30 to 70 hours in the considered case of mouse imaging), the attenuation coefficient, related to photon migration in the turbid media, stays the same. Therefore, one can expect that after initial curve normalization at t = t1 (see above), variations in fluorescence intensities owing to a specific marker are determined by kinetics of its binding to corresponding receptors and/or its washout from the blood circulation.
Observed correlation between tumor cells' HER2 amplification/overexpression and parameters directly estimated from the sequence of optical images (in particular, initial slope, characterizing the temporal dependence of the fluorescence intensity detected in the tumor) implies that the suggested approach provides a promising tool for in vivo characterization of HER2 overexpression in individual tumors.
In conclusion, it should be emphasized that direct quantification of HER2 expression in vivo, using maps of absolute fluorescence intensity in the ROI, is impossible owing to many complicating factors, such as unknown total blood volume in circulation, dose of fluorescence markers injected, intensity variation with time after injection likely owing to changes in the fraction of fluorophores, bound to the receptors versus those in the bloodstream, washout of the imaging probe, etc. We believe that only analysis of temporal variations of the fluorescence intensities after injection of the contrast agent, performed in the frames of a compartmental kinetic model (similar to that described above or more sophisticated), can provide quantitative information about HER2 expression in the tumor.
For characterization of tumors, our approach presents an attractive alternative to much more complex schemes of deep tissue optical imaging, such as diffuse optical tomography (which is well known to be a mathematically ill-posed problem) or scanning time-domain optical mammography that can take into account photon migration effects only over very simplifying assumptions, concerning the turbid media (ie, tumor and surrounding tissue).
Although the diffusion effects may not be as significant a factor for our approach as they are for known optical methods for deep tissue imaging, the transition from the animal model to the clinical studies should require a lot of effort, in particular, to find the proper nontoxic fluorescence marker, design an experimental setup, and develop an adequate kinetic model (similar to that of the mouse, but with different time constants).
Conclusion
Analysis of the temporal profiles of the fluorescence intensities measured in the tumor-associated ROI provided the parameters needed to monitor the in vivo status of the receptors in tumor xenografts characterized by different levels of amplification and expression of HER2.
Footnotes
Acknowledgment
Financial disclosure of authors: This research is supported by the Intramural Research Program of the Eunice Kennedy Shriver National Institute of Child Health and Human Development and the National Cancer Institute, National Institutes of Health.
Financial disclosure of reviewers: None reported.