
Abstract
Infiltrated monocytes play a crucial role in the demyelination process during multiple sclerosis (MS), an inflammatory disease of the central nervous system (CNS). Still, methods to monitor their infiltration pattern over time are lacking. In this study, magnetoelectroporation (MEP) was used to label rat monocytes with the superparamagnetic iron oxide particles Sinerem, Endorem, and Supravist. Supravist-labeled monocytes were injected in rats that we induced with experimental autoimmune encephalomyelitis, a model for MS. Imaging at 4.7 and 9.4 T revealed multiple foci of decreased signal intensity predominantly located in the cerebellum. Immunohistochemical evaluation confirmed the presence of intracellular iron in infiltrated cells, indicating the suitability of MEP to specifically follow labeled monocytes in vivo in this disease model. This technique may be further optimized and potentially used in MS patients to assess monocyte migration into the brain and to monitor the efficacy of therapeutic agents aimed at blocking cellular migration into the CNS.
The success of cellular MRI relies on specific and efficient labeling of cells with SPIO without interfering with cell function. Ideally, cells of interest should be isolated from the subject, labeled ex vivo with magnetic resonance contrast agents, and reinjected in a short period of time. To visualize neuroinflammatory processes using intravenous injections of ex vivo labeled monocytes, we and others have shown that cellular MRI is capable of tracking mononuclear cells that are recruited toward large ischemic lesions in the central nervous system (CNS).9,10
However, imaging of monocyte infiltration in CNS pathologies with multiple small lesions, as in the case of MS, is still a major challenge related to smaller-sized lesions and consequently an accumulation of a low number of labeled monocytes. So far, no successful strategy to track monocytes in experimental autoimmune encephalomyelitis (EAE), using monocytes labeled with SPIO, has been described. EAE, widely used as an animal model of MS, mimics the important pathologic events during MS, that is, increased permeability of the blood-brain barrier (BBB) and the formation of cellular infiltrates in the CNS.11,12 These infiltrates are present throughout the brain and spinal cord and mainly consist of monocyte-derived macrophages, which are caused by myelin degradation and tissue damage. 13 Therefore, selective inhibition of monocyte infiltration is an attractive therapeutic strategy to limit inflammatory tissue damage. To design an effective treatment, it is desirable to specifically intervene at the moment of monocyte entry.
Cellular MRI applied to tracking monocytes in EAE may be able to elucidate the spatiotemporal pattern of monocyte infiltration during the course of the disease. To increase the magnetic resonance detection limit for a small cluster of monocytes that infiltrate the CNS, a high load of contrast agent per cell is crucial. Here we describe the use of a novel labeling technique, magnetoelectroporation (MEP), that efficiently labels leukocytes within a few milliseconds14–16 and demonstrate that it is a promising method for labeling and tracking monocytes by MRI into multiple CNS lesions.
Materials and Methods
All procedures described in this study were approved by the local ethical committee and were performed in accordance with international guidelines on handling laboratory animals.
Labeling of Monocytes by MEP
Rat monocytes were freshly isolated by perfusion as reported previously. 17 Monocytes were suspended in phosphate-buffered saline (PBS) at a density of 5 to 10 × 106 cells/mL in electroporation cuvettes (0.4 cm; Bio-Rad Laboratories, Hercules, CA). To test the uptake of different iron oxide particles with respect to size and surface charge, we used three different contrast agents: Sinerem (30 nm; Guerbet, Roissy CdG Cedex, France), Endorem (150 nm; Guerbet), and Supravist (26 nm; Bayer Schering AG, Berlin, Germany). Contrast agents were mixed with cell suspensions at a concentration of 1 and 3 mg Fe/mL, cooled on ice for 5 minutes, and subsequently placed in an electroporator machine (BTX electroporation system; Harvard Apparatus ECM830, Holliston, MA). Electroporation was performed according to procedures as described previously 15 with the following parameters: pulse strength = 100 V, number of pulses = 5, pulse time = 5 ms, and interpulse delay = 100 ms. These pulse parameters were optimized in a pilot experiment to efficiently label freshly isolated rat monocytes without affecting cell viability. After electroporation, cell samples were put on ice for 5 minutes, washed three times in PBS, and resuspended at a density of 2 × 10⁷ cells/mL for cell transfusion.
Assessment of Monocyte Viability, Metabolic Activity, and Iron Oxide Particle Incorporation
Cell viability was determined by using a trypan blue exclusion assay. Dead cells were counted with a microscope in a total area of 25 mm2 (approximately 150 cells) using a calibrated counting chamber.
The metabolic activity of labeled monocytes was determined as previously described 16 using a (3-(4,5-dimethylthiazol-2-yl)-5-(3-carboxymethoxyphenyl)-2-(4-sulfophenyl)-2H-tetrazolium) (MTS) assay (CellTiter 96 Aqueous one assay, Promega, Madison, WI). In a 96-well plate, monocytes were incubated with 20 μL of MTS solution at 37°C for 4 hours. The absorbance at 492 nm was measured using a microplate reader (AD200, Beckman Coulter, Fullerton, CA).
To determine intracellular iron uptake histochemically, cytospin samples were stained with Prussian blue. Cells were fixed in acetone and incubated with a 1:1 mixture of 2% potassium hexacyanoferrate (II) and 2 N HCl for 30 minutes, rinsed in distilled water, and counterstained with nuclear fast red for 5 minutes. For intracellular iron quantification, samples containing 1 × 10⁶ labeled monocytes were acid-digested using a ferrozin-based spectrophotometric assay as previously described. 18
In Vitro MRI of Labeled Monocytes
T2 relaxation time measurements were performed using a 4.7 T horizontal bore nuclear magnetic resonance (NMR) spectrometer (Varian, Palo Alto, CA) with the following parameters: 9 × 0.5 mm slices, repetition time (TR) = 3,200 ms, 10 echoes with echo time (TE) spacing = 17.5 ms, field of view (FOV) = 4 × 4 cm; matrix = 128 × 128, number of experiments (NEX) = 3. T2 relaxation times were measured from agar gel (0.4%) suspensions containing a series of samples of labeled monocytes (0.02–0.5 × 10⁶ cells per 250 μL) in 96-well plates. Monocytes were electroporated with Supravist at a concentration of 2 mg Fe/mL. T2 maps were calculated from monoexponential fitting of MRI signal intensities as a function of TE.
Induction of Acute EAE and Intravenous Injection of Labeled Monocytes
Acute EAE (n = 10) was induced in male Lewis Hannover rats (210–240 g, Harlan, Zeist, the Netherlands) as previously described. 19 For EAE induction, rats were injected at day 0 subcutaneously in one hind footpad with 20 μg of guinea pig myelin basic protein (MBP) in PBS mixed with complete Freund adjuvant (Difco Laboratories, Detroit, MI) while anesthetized with 2% isoflurane in a N2O/O2 mixture (70/30). Clinical symptoms were scored daily and graded from 1 to 5: 0, no clinical signs; 0.5, partial loss of tail tonus; 1, complete loss of tail tonus; 2, unsteady gait; 2.5, partial hindlimb paralysis; 3, complete hindlimb paralysis; 4, paralysis of the complete lower part of the body up to the diaphragm; 5, death owing to EAE. At day 10 after immunization, clinical symptoms start to develop, and this day is marked as disease onset. At day 13, clinical scores are maximal, and this point represents the peak of the disease. Freshly prepared monocytes were electroporated (2 mg Fe/mL Supravist) and directly injected (1.0–1.2 × 10⁷ labeled monocytes per animal) in the tail vein of recipient rats at day 10 (n = 4) and day 13 (n = 4). EAE rats without cell injection (n = 2) served as a negative control.
In Vivo MRI Following Intravenous Injection of Labeled Monocytes
Animals were imaged just before and 24 and 72 hours after monocyte injection using a 4.7 T horizontal bore NMR spectrometer (Varian). Prior to MRI, rats were initially anesthetized as described for EAE induction followed by endotracheal intubation for mechanical ventilation with isoflurane (2%) in N2O/O2 (70/30). Slice positions were determined on a transversal scout image, and the central slice was positioned directly caudal to the cerebellum. The slices covered the upper part of the spinal cord, the cerebellum, and the caudal part of the cerebrum. T2 relaxation time measurements were performed with the following parameters: 21 × 1 mm slices, TR = 3,200 ms, 9 echoes with TE spacing = 17.5 ms, FOV = 32 × 32 mm, matrix = 128 × 128, voxel size = 62.50 μL, NEX = 4. T2*-weighted images were acquired using a gradient echo sequence: TR = 2,500 ms, TE = 12.5, NEX = 2. To reduce the intrinsic T2* effects caused by paramagnetic deoxyhemoglobin in erythrocytes, the percentage O2 in the anesthesia gas mix was changed to 100% O2 during T2*-weighted measurements.
Ex Vivo MRI and Histology
Directly after the 72-hour scan, rats were sacrificed by intraperitoneal injection of pentobarbital (euthesate) and perfused transcardially with saline followed by 4% paraformaldehyde in 0.1 M phosphate buffer. Brain and spinal cord were dissected and postfixed in formaldehyde.
Ex vivo MRI experiments were performed using a 9.4 T horizontal bore NMR spectrometer (Varian) with a quadrature surface coil (RAPID, Biomedical, Rimpar, Germany). Brain and spinal cords were immersed in Fomblin (perfluorinated polyether, Solvay Solexis, Weesp, the Netherlands) to prevent air-tissue artifacts. T2*-weighted brain images were acquired using a three-dimensional gradient echo sequence with the following parameters: TR = 25 ms, TE = 12.5 ms, FOV = 25 × 25 × 25 mm, matrix size = 256 × 256 × 256, and NEX = 8, giving a final isotropic resolution of 98 μm and a voxel size of 0.93 μL. For spinal cords, we used an FOV of 100 × 30 × 30 and a matrix size of 512 × 256 × 256.
Following ex vivo MRI, brains were processed for the immunohistochemical detection of infiltrated monocytes (ED1) and the presence of iron oxide particles (Prussian blue) as described elsewhere. 9
Quantitative Analysis of Hypointensities
To quantify regions of low signal intensity as a result of labeled monocyte recruitment, 10 consecutive slices were selected, blindly analyzed, and independently scored by two observers (E.L.A.B. and R.D.O.E.). The slices covered the upper spinal cord, brainstem, and cerebellum. This area was chosen because CNS lesions are likely to develop here and signal changes can be readily identified. For the two time points, 24 and 72 hours after cell injection, the images were compared to the preinjection images and each slice was analyzed for the presence of regions with low signal intensity. The percentage of slices with abnormal hypointensities was calculated.
Statistical Analysis
Data are expressed as mean ± standard error of the mean (SEM). Statistical analysis was performed using the statistical software package Sigmastat (Jandel Scientific Software, San Rafael, CA) (version 3.11, 2004). Data were evaluated by two-way repeated measures analysis of variance, followed by the Student-Newman-Keuls post hoc test. A p < .05 was considered statistically significant.
Results
Labeling Efficiency after Magnetoelectroporation Is Dependent on the Type of Iron Oxide Particle
Monocyte function was assessed after electroporation with three different iron oxide particles. Cell viability was not changed by the electroporation procedure compared to freshly isolated monocytes (Figure 1A). Metabolic activity was slightly decreased, independent of the presence or absence of iron oxide particles (Figure 1B). To quantitatively assess particle incorporation by monocytes, the iron content in the cell samples was determined. No increase in intracellular iron content was detected after electroporation with Sinerem compared to monocytes electroporated without contrast agents (Figure 2A). Electroporation with Endorem and Supravist resulted in elevated iron levels. Increasing the Endorem concentration did not improve labeling efficiency, whereas an increase in Supravist concentration to 3 mg Fe/mL resulted in an increase of 400% in intracellular iron compared to unlabeled monocytes.
Prussian blue staining of cytospin samples (Figure 2B) confirmed these findings. No iron-positive cells were detected for electroporated monocytes with Sinerem, whereas following MEP with Supravist (1 mg Fe/mL), we observed labeled monocytes containing multiple iron-positive clusters (blue color) distributed throughout the cytoplasm. After electroporation with 3 mg Fe/mL Supravist, an increase in iron oxide particle accumulation was observed. However, many extracellular iron clusters were also present.
Monocytes Labeled by MEP Decrease T2 Relaxation Time In Vitro
Based on labeling and viability assessments, Supravist at 2 mg Fe/mL was selected to efficiently label rat monocytes by MEP for future studies. To determine the change in T2 relaxation time, agar phantoms containing monocytes labeled with Supravist were imaged. Loss of signal is observed with increasing cell concentrations. Quantification of T2 relaxation times for the different monocyte concentration shows a 60% decrease in signal for 2 × 10⁶ labeled monocytes per milliliter (Figure 3).
Injection of Labeled Monocytes in EAE Rats Results in Focal Hypointensities in the CNS
Rat monocytes were electroporated with Supravist (2 mg Fe/mL) and immediately injected (1.0–1.2 × 10⁷ labeled monocytes per animal) at day 10 when EAE rats started to lose tail tonus (disease onset, mean clinical score 0.2 ± 0.11) and at day 13 when all animals are clinically ill (peak of the disease, mean clinical score 3.3 ± 0.42) (Figure 4A).
Imaging was performed just prior to monocyte injection and after monocyte injection (24 and 72 hours). Small areas of decreased signal intensity were detected in the cervical cord, brainstem, and cerebellum (Figure 4B), suggesting infiltration of labeled monocytes.
To quantify hypointensities in the CNS of EAE rats following monocyte injection, the percentage of slices that contained changes in signal intensity compared to the preinjection images was determined (Figure 4C). Injection of labeled monocytes at disease onset resulted in hypointense regions in approximately 30% of the slices (31 ± 2.4% in the 24-hour scan and 29 ± 5.5% in the 72-hour scan). Monocyte injection at disease peak resulted in low signal intensities in 51 ± 2.4% of the slices in the 24-hour scan, which was significantly higher compared to disease onset (p < .05). The percentage of slices containing hypointensities had declined at 72 hours (44 ± 6.6%, p > .05 versus disease onset).

A, Cell viability measured by trypan blue exclusion after MEP in the absence (vehicle) or presence of iron oxide particles. Cell viability has not changed compared to nonelectroporated monocytes (fresh). B, Monocyte metabolic activity decreased after MEP in the absence (vehicle) and in the presence of iron oxide particles compared to nonelectroporated monocytes (fresh). Data are the mean ± SEM of three individual experiments.
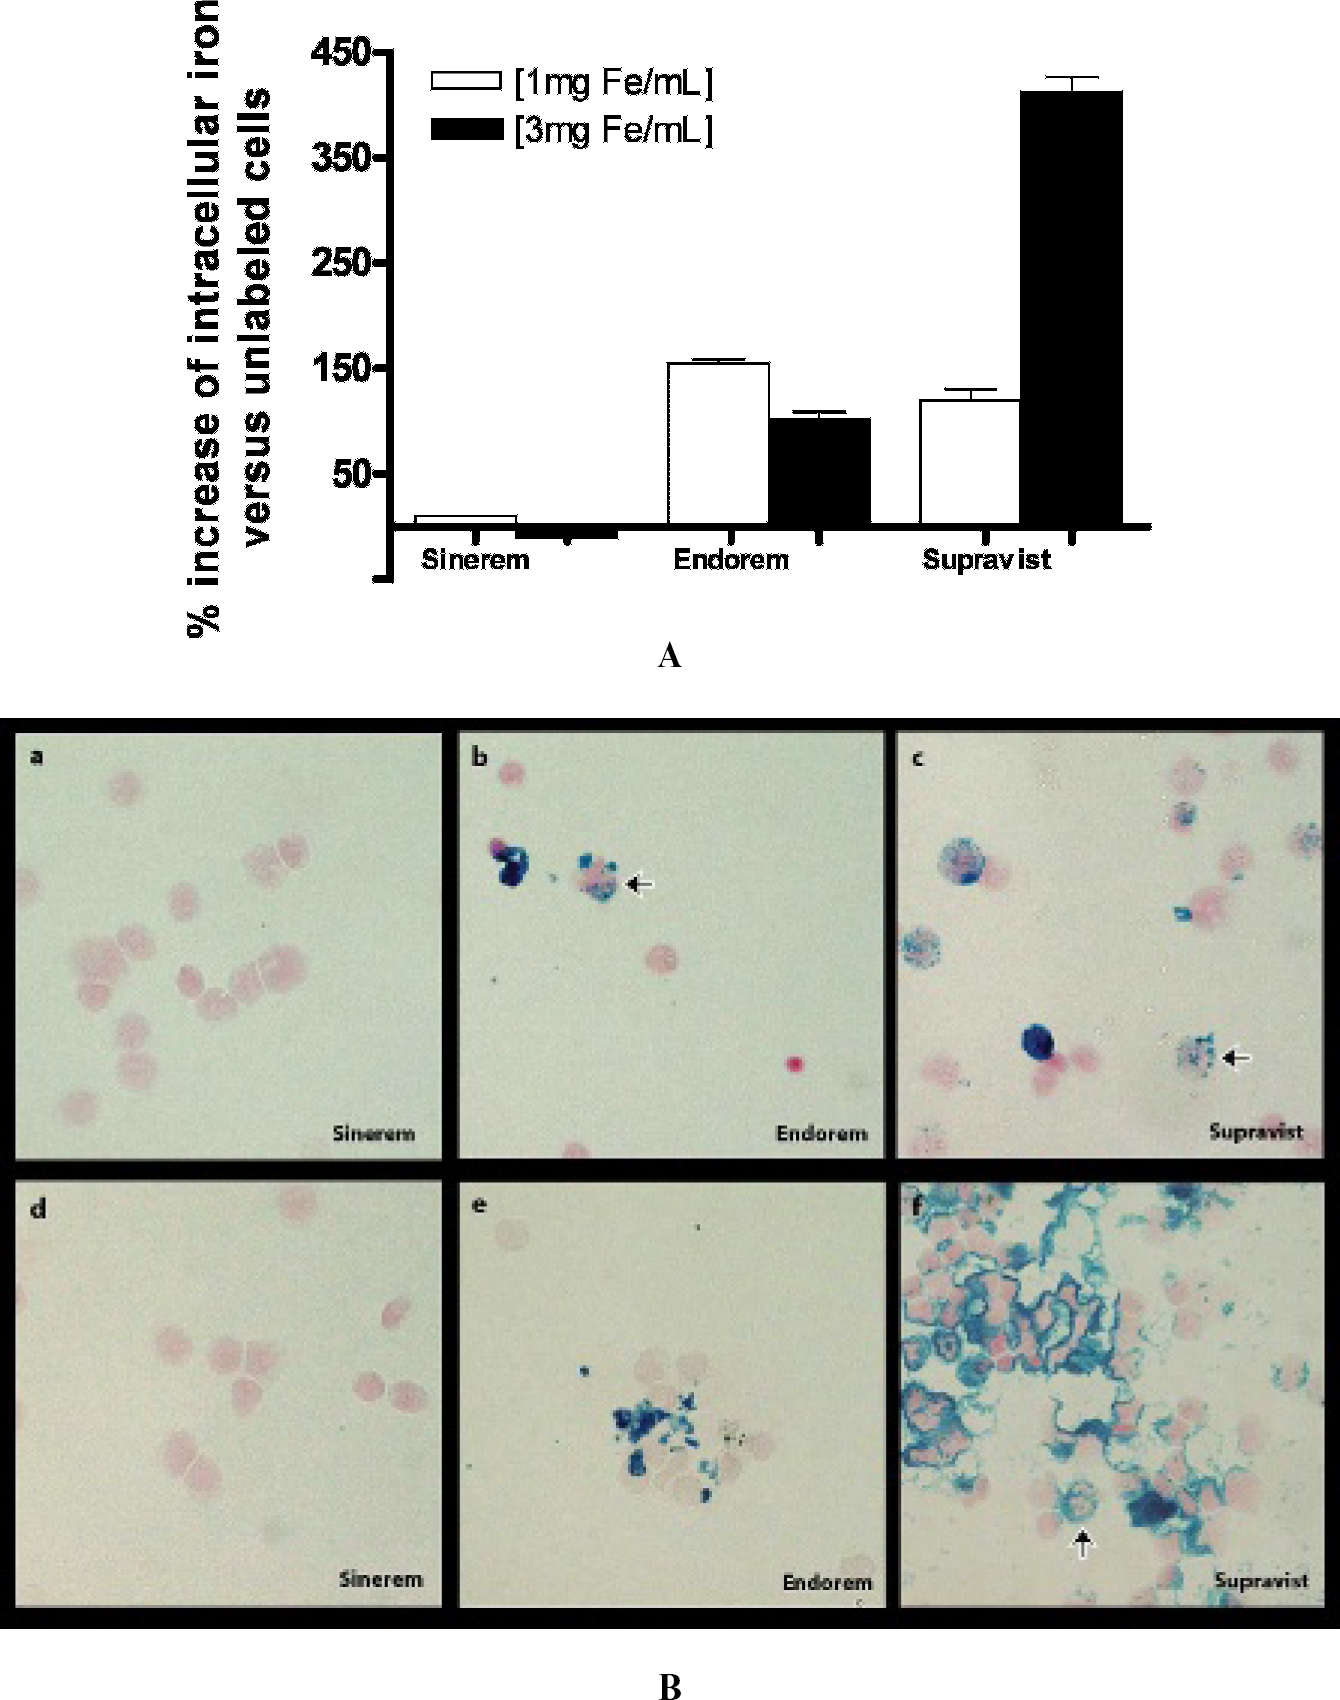
A, Iron incorporation as quantified by the ferrozin assay. No increase in intracellular iron was detected following electroporation with Sinerem. MEP with Supravist at a concentration of 3 mg Fe/mL resulted in a 400% increase in intracellular iron concentration. B, Prussian blue staining of cytospin samples showed the presence of intracellular iron (arrows point to cells with intracellular iron) exclusively for monocytes labeled with Endorem and Supravist. Panels a, b, and c show monocytes labeled at 1 mg Fe/mL, and panels d, e, and f show labeling at 3 mg Fe/mL. Note the presence of extracellular iron clusters, especially after labeling with 3 mg Fe/mL Supravist. Data are the mean ± SEM of three individual experiments (x40 original magnification).
High-Resolution MRI Reveals Focal Hypointensities Predominantly in White Matter
Ex vivo imaging of brains at high field strength (9.4 T) resulted in a three-dimensional data set in which detailed anatomic structures could be visualized (Figure 5). Image resolution (ie, voxel size) was approximately 70 times higher than the in vivo obtained images. In EAE rats without monocyte injections (control), no abnormalities were detected in the CNS (see Figure 5A). Importantly, focal areas of signal decrease were detected in the white matter area of EAE rats that were injected with labeled monocytes. In two of eight EAE animals, a relatively large hypointensity was detected in the lumbar part of the spinal cord (see Figure 5B), pointing to the diffuse pattern of monocyte infiltration in the CNS of EAE rats. The hypointense signal present in the cortex at 72 hours posttransfusion in the sagittal view (middle panel) most likely reflects an artifact.
Histology Reveals Iron-Positive Cells in EAE Brains
To validate the origin of the hypointense areas, corresponding sections of the cerebellum (72 hours after injection of labeled monocytes) were stained for the presence of iron (Prussian blue). Typically, in the area of focal hypointensities on ex vivo MRIs, a number of iron-positive spots were observed in the presence of ED1-positive cells (Figure 6). Note that many ED1-positive cells are present in the lesion, whereas only a few iron-positive spots could be detected, suggesting that only a few USPIO-labeled cells entered the lesions.

A, Typical example of a T2 relaxation time image of agar phantoms containing increasing numbers of monocytes labeled by MEP with Supravist (2 mg Fe/mL). A strong decrease in signal intensity is observed for increasing concentrations of labeled monocytes. B, Corresponding T2 relaxation times of labeled monocytes. At a concentration of 2 × 10⁶/mL, monocytes labeled by MEP cause a nearly 60% reduction in signal intensity. Data are the mean ± SEM of three individual experiments.
Discussion
In this study, we demonstrated efficient labeling of rat monocytes with iron oxide particles using MEP and report on its successful implementation for in vivo monocyte tracking in rats with EAE.
Cellular MRI requires high amounts of contrast agent per cell without affecting cell function. We here demonstrate that electroporation of cells meets both of these requirements. Moreover, we found that labeling efficiency using MEP depended on the choice of iron oxide particle. Iron staining and quantification revealed that the larger-sized Endorem was preferred over the smaller-sized Sinerem, indicating the importance of the size of the particle. However, the best results were obtained with Supravist, which emphasizes the advantage of an ionic surface charge. As shown by Prussian blue staining, Supravist has a different distribution pattern within the cell compared to Endorem. Supravist is taken up by the monocytes; however, at a concentration of 3 mg Fe/mL, clusters of extracellular iron particles occur, giving rise to the high iron content as measured by the ferrozin assay. This phenomenon was not observed at 1 mg/mL or with the Endorem labeling. Owing to this observation, we have decided to use the concentration of 2 mg/mL Supravist, which was found not to give this tremendous increase in iron loading. Previous studies using other procedures similarly showed that cell labeling efficiency is dependent on both the size20–22 and the charge of the iron oxide particle. 23 In contrast to cell labeling by straightforward incubation, MEP is a voltage-based method causing a temporary loss of cell membrane integrity, which drives the uptake of contrast agents present in the medium.14,16,24 Here we provide magnetic resonance evidence for the labeling efficiency using MEP and report on T2 relaxation times determined for rat monocytes labeled with Supravist. Importantly, we obtained better results using MEP than previously achieved for rat monocytes using an optimized incubation protocol. 21 An improved labeling strategy will benefit the detection of small amounts of labeled monocytes in vivo.
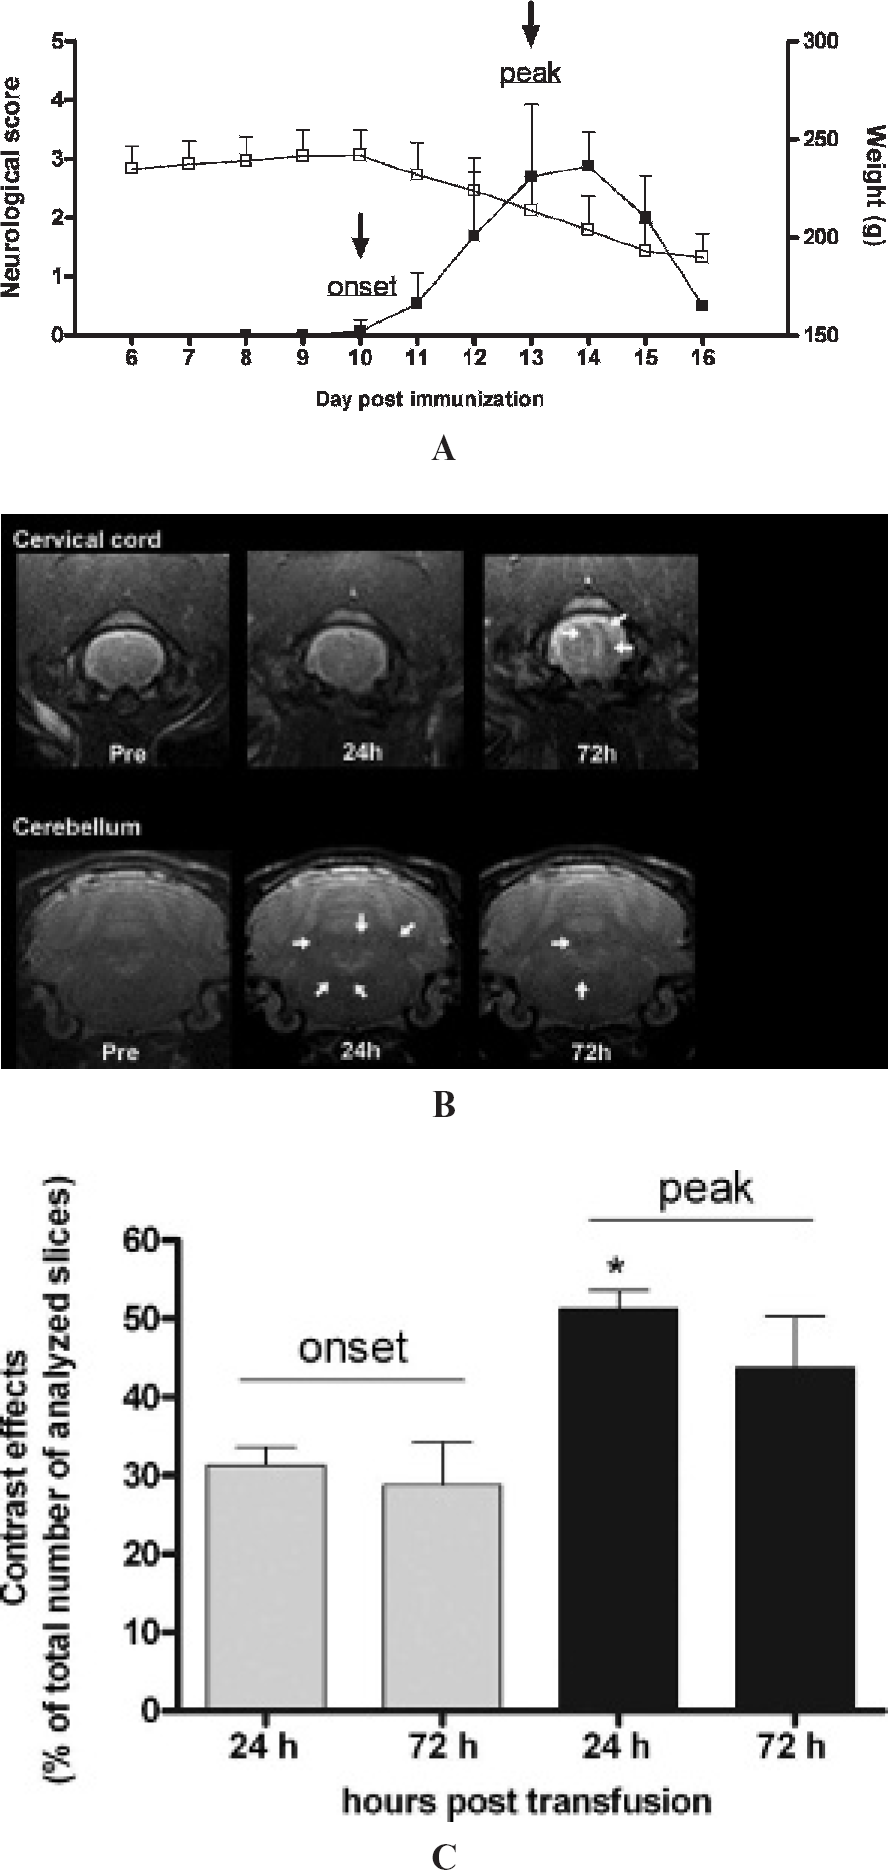
A, Time course of (■) neurologic scores and (□) body weight of acute experimental autoimmune encephalomyelitis (EAE) in rats. Animals were immunized with myelin basic protein emulsified in complete Freunds adjuvants at day 0 (n = 10). Neurologic symptoms were scored daily. The black arrows indicate the injection of MEP-labeled monocytes at day 10 and day 13 after immunization. B, Typical example of T2*-weighted images of EAE rats injected at disease onset. Hypointensities (arrows) after injection of labeled monocytes are detected in the 24-hour scan and the 72-hour scan, predominantly in cerebellum and cervical cord. C, To quantify the loss of signal intensity, the percentage of slices that contained abnormal hypointensities is plotted for each time point. Injection of labeled monocytes resulted in an increase in slices with abnormal hypointensities for all time points. At disease peak, this increase was significantly higher 24 hours after injection compared to disease onset (p < .05 versus 24-hour onset and 72-hour onset).

A, Ex vivo high-resolution T2*-weighted images of experimental autoimmune encephalomyelitis (EAE) brains showing infiltrated labeled monocytes. No hypointense areas are detected in control EAE brains (upper panel). In animals that were administered labeled monocytes, focal areas of signal loss were detected in the white matter (arrows in middle and lower panels). B, Ex vivo T2*-weighted images of EAE spinal cord in sagittal orientation. In two of eight rats that received labeled monocytes, hypointense regions were detected (arrow, lower panel) in the lumbar cord.
To test the improved detection level of monocytes, we injected monocytes labeled with Supravist in EAE rats at onset and peak of the disease. On monocyte injection, we showed that abnormal hypointensities could be detected in vivo, which were predominantly located in the cervical cord and cerebellum. Previous studies have also reported on hypointense regions in these areas after intravenous injections of free USPIO particles,7,25,26 and it was suggested that USPIO-related signal changes reflect the presence of monocyte infiltrates. However, we previously showed that monocyte labeling efficiency by incubation with Sinerem in vitro was low, 9 and in a recent study, it was shown that Sinerem was not incorporated into leukocytes in the circulation of rats. 27 In unpublished pilot experiments, we were not able to track Endoremlabeled monocytes in EAE using labeling procedures we previously described, that is, straightforward ex vivo labeling with Endorem (4 mg Fe/mL; 1.5 hours). 9 Clearly, multiple pathways exist for the uptake of USPIO in vivo, such as BBB leakage and transcytosis by endothelial cells.7,28 To monitor and intervene in an inflammatory response, it is crucial to discriminate between leakage and monocyte infiltration. Therefore, tracking of ex vivo labeled monocytes is highly desirable. In our study, despite the high iron load per monocyte, the hypointense regions in the EAE brain detected by in vivo MRI were small. This may reflect competition by endogenous (unlabeled) monocytes at the inflammatory sites. However, our approach was able to discriminate between disease onset and peak in this model and showed that monocyte migration into the CNS was increased at the peak of the disease scores.

Histologic analysis for the presence of USPIO (Prussian blue) and infiltrated monocytes (ED1) in the brain of experimental autoimmune encephalomyelitis rats 72 hours after the injection of labeled monocytes. A, Ex vivo high-resolution T2*-weighted image of the cerebellum containing focal hypointensities (white box). B, In the corresponding area, several ED1-positive infiltrates are detected (brown color). C and D, ED1-positive infiltrates are magnified (left image) and the sequential section is stained for the presence of iron oxide particles (right image). Iron-positive cells (arrows) are in close proximity (C) or attached to (D) the vessel wall. Note that only a few cells are iron positive, suggesting that only a few labeled cells actually entered the lesions.
To facilitate the detection of small infiltrates containing a few labeled monocytes, we also obtained high-resolution images ex vivo at a high magnetic field strength. Here we show that rat EAE brains scanned at 9.4 T outlined small areas of signal loss predominantly located in white matter myelin, the primary target of infiltrated monocytes in MS. 13 Compared to the in vivo images, hypointense abnormalities were much more detectable on the ex vivo images. The voxel size of the ex vivo images was 0.93 μL, whereas the in vivo images were collected with a voxel size of 62.6 μL. Ideally, in vivo images should have been obtained with similar resolutions, especially with translation of results to a clinical setting. However, this may be very challenging when experimental time is a limiting factor. The experimental time for the presented in vivo images in this study was approximately 11 minutes, whereas for the ex vivo images, it was 218 minutes. In retrospect, it would have been better to collect the in vivo images with a three-dimensional sequence with a similar short repetition time, as was done for the ex vivo images. Time could have been dramatically reduced, although it would still be hard to obtain comparable high-resolution images within a reasonable time.
Recently, SPIO-labeled T cells, which were adoptively transferred to induce EAE in a mouse model, were detected by MRI in the lumbar cord at disease onset. 29 It is suggested that T-cell entry precedes the infiltration of monocytes. Interestingly, in our study, we detected in a few rats hypointense areas in similar areas of the spinal cord, reflecting the infiltration of labeled monocytes. These results suggest that the lumbar cord is a vulnerable area in EAE and sensitive to cellular infiltration. The use of high-field MRI provides excellent tissue characterization and thereby better localization of small clusters of iron oxide–loaded cells in CNS pathologies.
Histologic analysis demonstrated the presence of iron-positive spots corresponding to the areas of low signal intensity on the ex vivo T2*-weighted images. So far, this has been described only in animal models with large brain lesions using incubation procedures to label monocytes.10,21 Our histologic data underline the strength of MEP to label monocytes efficiently. Future studies should consider cellular incorporation of a fluorescent label to gain a better insight into the fate of injected monocytes.
In conclusion, our study demonstrates that MEP is a potent labeling strategy and provides the opportunity to specifically visualize the migration process of monocytes in vivo. A key feature of MEP is the high iron load per cell, which brings single-cell visualization within reach. Therefore, MEP contributes to a better understanding of monocyte infiltration kinetics and indirectly to an accurate design and evaluation of therapies aimed at limiting monocyte entry into the CNS. Given that MEP is an easily implemented labeling strategy, successful with clinical grade contrast agents and ultrafast, bench to bedside translation may be of interest in the near future.
Footnotes
Acknowledgments
We thank Guerbet for kindly providing the contrast agents Sinerem and Endorem. The contrast agent Supravist was kindly provided by Bayer Schering Pharma.
Financial disclosure of authors: This work was supported by the Dutch MS Research Foundation (MS 01–470, MS 02–489 and W06–02), the Netherlands Organization for Scientific Research (NWO), the Du Pré Grant of Multiple Sclerosis International Federation (MSIF), NMSS RG 3630, and the TEDCO Maryland Stem Cell Fund ESC-06–29–01.
Financial disclosure of reviewers: None reported.