
Abstract
Positron emission tomography–computed tomography (PET-CT) uses CT attenuation correction but suffers from misregistration artifacts. However, the quantitative accuracy of helical versus cine CT in the same patient after optimized coregistration by shifting both CT data as needed for each patient is unknown. We studied 293 patients undergoing cardiac perfusion PET-CT using helical CT attenuation correction for comparison to cine CT. Objective, quantitative criteria identified perfusion abnormalities that were associated visually with PET-CT misregistration. Custom software shifted CT data to optimize coregistration with quantitative artifact improvement. The majority (58.1%) of cases with both helical and shifted helical CT data (n = 93) had artifacts that improved or resolved by software shifting helical CT data. Translation of shifted helical CT was greatest in the x-direction (8.8 ± 3.3 mm) and less in the y- and z-directions (approximately 3.5 mm). The magnitude of differences in quantitative end points was greatest for helical (p = .0001, n = 177 studies), less for shifted helical but significant (p = .0001, n = 93 studies), and least for cine (not significant, n = 161 studies) CT compared to optimal attenuation correction for each patient. Frequent artifacts owing to attenuation-emission misregistration are substantially corrected by software shifting helical CT scans to achieve proper coregistration that, however, remains on average significantly inferior to cine CT attenuation quantitatively.
Such a comparison is important because some PET-CT scanners do not have cine CT capability. Therefore, we explored the quantitative accuracy, clinical benefits, and limitations of using software-shifted helical CT attenuation correction as an alternative that is more widely available than cine CT attenuation correction in cardiac PET.
Material and Methods
Study Patients
We studied consecutive patients undergoing diagnostic myocardial perfusion rest–dipyridamole PET-CT for potential coronary artery disease (CAD) evaluation or follow-up imaging at the Weatherhead PET Center for Preventing and Reversing Atherosclerosis of the University of Texas Medical School-Houston and Memorial Hermann Hospital. All subjects signed a clinical informed consent approved by the Committee for the Protection of Human Subjects of the University of Texas Health Science Center. Additionally, we identified subsets of patients with paired studies on the same patient but using two different CT attenuation techniques (helical CT and shifted helical CT, or helical CT with cine CT).
PET Acquisition Protocol
Patients were instructed to fast for 4 hours and abstain from caffeine, theophylline, and cigarettes for 24 hours before the study. PET-CT was performed using a Discovery ST 16-slice PET-CT multislice bismuth germanate tomograph (GE Healthcare, Waukesha, WI) in two-dimensional mode with extended septa at a reconstructed inplane resolution of 5.9 mm full width at half-maximum (FWHM). Patients were positioned in the scanner using laser guides aligned to the base of the throat and confirmed by a CT scout scan. External body markers were used to ensure correct positioning throughout data acquisition. Emission images were obtained over 6 minutes after intravenous injection of 1,295 to 1,850 MBq (35–50 mCi) of generator-produced rubidium 82 (82Rb) and contained 24 to 60 million total counts, of which 12 to 30 million were true coincidence counts. Selected patients with severe unresolved complex attenuation issues on shifted helical or cine CT-PET scans were restudied on a Positron Corporation (Fishers, IN) PET scanner with rotating rod attenuation acquisition and correction using the same rest-stress and imaging protocol and the same doses of 82Rb.
Immediately after completing the resting 82Rb scan, dipyridamole (0.142 mg/kg/min) was infused for 4 minutes. Four minutes after completion of the dipyridamole infusion, the same dose of 82Rb was given intravenously. Emission image acquisition was started at 70 seconds (or 80 seconds for patients with heart failure or heart rates below 55 beats per minute) after the beginning of 82Rb infusion. For dipyridamole-induced angina, aminophylline (125 mg) was given intravenously. All protocols, data acquisition, processing, and quantification of cardiac PET and PET-CT are as previously reported.10,15–19
CT Acquisition Protocol
Helical and cine CT scans were performed both before rest emission imaging and after stress emission imaging. All patients were imaged using helical CT attenuation correction. Helical CT transmission scans were obtained at 120 kV and 100 mA over 29 seconds during normal breathing (in a subset of patients) or over 4 seconds at end-expiratory breath-hold (in another subset of patients) as we compared slow versus fast methods of helical CT acquisition to minimize artifacts. The helical CT acquisition used x-ray collimation of 16 × 1.25 mm, gantry rotation of 0.5 seconds, and helical pitch of 1.75:1. The radiation exposure was 5.7 mGy for the helical CT scan.
A majority subset of patients was also imaged using cine CT attenuation correction as previously described. 10 Cine-mode data acquisition is one of the three optional data acquisitions on the Discovery PET-CT scanner that include axial, helical, and cine modes. The cine CT scan used 120 kV, x-ray collimation of 8 × 2.5 mm, gantry rotation cycle of 0.5 seconds, cine duration of 10 seconds, and 14 cm coverage. Each reconstruction used 360° of CT data over 0.5 seconds. The cine data acquisition lasted for 78 seconds, of which 70 seconds was for 7 cine CT acquisitions of 10 seconds each and 8 seconds was for six table translations of 2 cm each between two cine CT acquisitions.
Tube current for cine CT was 10 mA for patients weighing < 100 kg, 15 mA for 100 to 130 kg, and 20 mA for > 130 kg (lower dose than standard helical protocol). The radiation dose and effective dose equivalent for cine CT were 10 mGy and 2.36 mSv, respectively, for a tube current of 10 mA. For each cine CT scan, 1,232 CT images are reconstructed 2 minutes after the cine CT acquisition and 22 images per slice location during normal respiration before averaging into a composite CT image over several breathing cycles. Interpolation of the average CT attenuation data was performed to make the average CT images align at the locations of the PET slices for attenuation correction.
In view of the inherent blurring introduced by the average CT but not by the helical CT data, we applied 4 and 10 mm FWHM gaussian filtering on the average CT and helical CT data, respectively, before CT attenuation correction.
Image Reconstruction
Custom software was developed to shift the CT data if needed in horizontal and vertical directions in the transaxial plane and in the superior–inferior or z-axis direction of different planes to align the CT heart borders visually with the PET data to achieve good coregistration. Images were reconstructed using filtered backprojection with a Butterworth filter with a cutoff of 0.55 cycles/cm, rolloff of 10 dB/decade, and pixel size of 3.27 × 3.27 mm. Fusion images were made by superimposing attenuation-corrected emission and CT transmission scans in horizontal, coronal, and sagittal views and shifted as needed to achieve optimal attenuation-emission coregistration.
After attenuation correction, the reconstructed PET emission images in DICOM format were exported to an Ultra 60 workstation (Sun Microsystems, Palo Alto, CA) of an mPower-HZL PET scanner (Positron Corporation) for reorientation into long- and short-axis tomographic and topographic three-dimensional displays using previously described automated quantitative software.17,19–22 Quantitative data from 82Rb and 18F phantoms imaged on the Discovery ST scanner have been exported to the mPower-HZL software for automated quantitative analysis, and the quantitative accuracy of exported data has been validated by extensive phantom studies.
A three-dimensional restructuring algorithm generates true short- and long-axis views from reconstructed PET transaxial cardiac images, perpendicular and parallel to the long axis of the left ventricle. From the tomographic data, circumferential profiles are used to reconstruct three-dimensional topographic views of the left ventricle showing relative regional activity distribution divided into lateral, inferior, septal, and anterior quadrant views of the three-dimensional topographic display corresponding to the coronary arteries as previously described17,19–22 and illustrated in Figure 1.
Quantitative PET Image Analysis
Mean activity in each quadrant is normalized to the maximum 2% of pixels in the whole heart data set. Regions of each quadrant are identified with values outside 2.0 and 2.5 SD reference values of 50 healthy volunteers with no risk factors by complete medical history (no hypercholesterolemia, hypertension, diabetes, smoking, obesity, drug or alcohol abuse, other systemic diseases, or family history of CAD). The percentage of circumferential profile outside 2.0 and 2.5 SD was calculated automatically for each quadrant and the whole heart.
The severity of a perfusion defect is quantified as the average relative uptake in a defined quadrant or the lowest quadrant average relative activity, that is, the average relative activity for the quadrant with the lowest average activity of anterior, septal, lateral, and inferior quadrants for each subject, expressed as a percentage of the highest 2% of activity in the image data set. The highest quadrant average relative activity quantifies perfusion in the most normal quadrant for each subject. The size of perfusion defects is quantified as the fraction of the whole cardiac image outside 2.0 and 2.5 SD of controls in each quadrant and whole heart. The combined size and severity of perfusion defects are defined as the percentage of the whole cardiac image with relative activity of less than 60% of maximum activity (100%), which is 3.0 SD below the mean maximum activity of controls. The percentage of the whole cardiac image with relative activity of greater than 80% of maximum activity quantifies the normal area taking both size and severity into account. For a subset of patients done after our initial series studying PET-CT misregistration, absolute activity recovered by the scanner was computed by converting the raw counts to activity in μCi/cc using a linear calibrated conversion formula in automated software for the subgroups of patients processed after quantitative GE-to-Positron data transfer had been validated by phantom experiments.

Taking the pixel by pixel ratio of the stress and rest images defines a stress/rest image. This can be done after both rest and stress scan have either been scaled by their respective maximums (so-called relative stress/rest image) or converted to absolute activity via the linear calibration conversion formula (absolute stress/rest image). Histogram profiles of these stress/rest images are computed to quantify the percentage of the image with low (⩽ 0.66 relative, ⩽ 0.90 absolute), borderline (0.67–1.0 relative, 0.91–1.40 absolute), and normal (> 1.0 relative, > 1.40 absolute) values.
Misregistration Artifacts
On PET perfusion images, artifactual abnormalities owing to misregistration were objectively defined as criteria 1 plus 2, 3, or 4 as follows:
The defect on the PET image was associated with a corresponding area of misregistration on the superimposed CT transmission and PET emission fusion scans. The abnormality on the resting CT-PET scan associated with misregistration was not present in the corresponding stress image after it had been reconstructed with correctly coregistered CT and PET data. The abnormalities on the helical CT-PET scan at rest or stress were not present in the corresponding PET images reconstructed using cine CT or a cine CT that was shifted to visually co-register with the PET scan. The abnormality on helical CT-PET was not present in the corresponding images acquired with an additional separate rest/stress study repeated on the next day using an mPower-HZL standard PET scanner with a rotating rod transmission source and shift software to ensure correct registration of emission and transmission data as previously documented.
15
Therefore, to be counted as having an abnormality owing to PET-CT misregistration, every patient with abnormal helical CT-PET at rest or stress had to have a stress perfusion study with no significant regional defect after correct PET-CT coregistration. Any patient with a defect that persisted on stress PET-CT images or after correct coregistration that was outside 2 SD of healthy subjects was classified as having a “real” defect, not an artifact, even if the defect improved after correct registration. Therefore, our observed prevalence of abnormalities owing to PET-CT misregistration is a conservative estimate.
For PET scans meeting the above criteria for misregistration artifacts, the severity, size, and combined size–severity of perfusion abnormalities in the same quadrant as the PET-CT misregistration were objectively quantified by automated software. Additionally, the perfusion abnormalities owing to PET-CT misregistration with helical CT were visually graded after application of a shifted CT. This visual analysis was secondary to the quantitative end points but performed to ensure the visual relevance of the findings and confirm the objective quantitative results as clinically consistent. The degree of improvement was graded as no change, mild improvement, marked improvement, resolution, or worsening. The optimal amount of shift in each direction was recorded in millimeters when the shifted helical CT produced a superior image compared to helical CT. In addition to automated quantification of abnormalities, each PET study was visually interpreted for which method of CT attenuation produced the least artifact. This optimal set of images was deemed the gold standard for quantitative end points.
Statistical Methods
All statistical tests were performed using STATA version 10.1 (StataCorp, College Station, TX). Continuous variables are expressed as mean ± SD and were compared using the paired t-test. Proportions were compared using the chi-square or Fisher exact test. Differences from the gold standard were summarized using the quadratic mean and are expressed as mean (95% confidence interval). All applicable tests were two-tailed, and a p < .05 was taken as the cutoff for statistical significance.
Results
We identified 293 consecutive patients who underwent PET-CT with data available for analysis, all of whom had helical CT scans for attenuation correction. In 161 cases (55.0%), a cine CT attenuation scan was also acquired. All CT attenuation maps (helical and/or cine) could be shifted if needed using custom software as detailed above to optimize coregistration. The 132 helical CT-PET cases without cine CT served to contribute additional statistical power to the prevalence of misregistration artifacts that resolved after shifting helical CT data to achieve optimal coregistration. The quantitative comparison of helical CT-PET and cine CT-PET was analyzed in the 161 cases with CT data sets, both with optimized coregistration by shifting CT data as needed for each case. Finally, we identified 177 cases with at least two different CT attenuation techniques used on the same patient study.
Defect Location and Improvement
One hundred fifty-nine defects owing to misregistration were identified on studies with helical CT attenuation. These were located in the lateral (n = 66, 41.5%), anterior (n = 50, 31.4%), inferior (n = 36, 22.6%), and apical (n = 7, 4.4%) regions of the left ventricle. Those artifactual defects with at least a mild improvement after shifting the CT data were commonly located in the lateral (n = 20 of 66, 30.3%), anterior (n = 21 of 50, 42.0%), or apical (n = 2 of 7, 28.6%) regions and less commonly in the inferior wall (n = 4 of 36, 11.1%). Thus, inferior misregistration artifacts were less likely corrected by shifting helical CT data compared to other regions.
Seventy-eight defects owing to misregistration were identified on studies with cine CT attenuation. These were located in the lateral (n = 21, 26.9%), anterior (n = 18, 23.1%), inferior (n = 33, 42.3%), and apical (n = 6, 7.7%) regions of the left ventricle. Again, those artifactual defects with at least a mild improvement were commonly located in the lateral (n = 7 of 21, 33.3%) or anterior (n = 6 of 18, 33.3%) walls and less commonly improved by shifting the cine CT data in the inferior (n = 3 of 33, 9.1%) and apical (n = 1 of 6, 16.7%) regions.
Helical versus Shifted Helical CT
Table 1 and Table 2 compare relative myocardial uptake using attenuation correction by helical CT with shifted helical CT in 93 patients (paired studies on the same patient using two different CT attenuation techniques). Only a subset had absolute activity data (n = 13 rest, n = 8 stress) in addition to quantitative relative activity. Figure 2 illustrates a severe artifactual defect owing to attenuation-emission misregistration, corrected by shifting the helical CT data to coregister CT emission scans on the fusion image. Both rest and stress artifacts are included in Table 1, whereas Table 2 distinguishes between artifacts observed on the rest image (n = 66, 71.0%) and on the stress image (n = 27, 29.0%). Both tables demonstrate that shifted helical CT attenuation reduces artifactually abnormal end points compared to helical CT attenuation, owing to better coregistration on the shifted CT-PET images using shifted helical CT.
The change in visual assessment comparing shifted helical CT to helical CT attenuation correction was scored for each study. The results were no change (n = 33, 35.5%), mild improvement (n = 34, 36.6%), marked improvement (n = 19, 20.4%), resolution (n = 1, 1.1%), and worsening (n = 6, 6.5%). The majority of cases (n = 54, 58.1%) had artifacts that improved or resolved by using software-shifted helical CT instead of helical CT. A small minority (n = 6, 6.5%) of cases had worsening artifacts using shifted CT attenuation data when compared to perfusion assessed using unshifted cine CT attenuation data or on a stress study with improved coregistration or with a rotating rod attenuation scan performed later, as detailed in the Material and Methods section.
The absolute spatial translation applied to create the shifted helical CT in each spatial dimension was quantified for each study. The average absolute x-axis shift was 8.8 ± 3.3 mm, y-axis shift was 3.5 ± 3.4 mm, and z-axis shift was 3.3 ± 5.5 mm. The x-direction required the greatest amount of shift, whereas the y- and z-directions had similar shift magnitudes. Owing to the slanted left heart border, vertical respiratory motion may cause lateral PET-CT misregistration in the x-axis.
Helical versus Cine CT
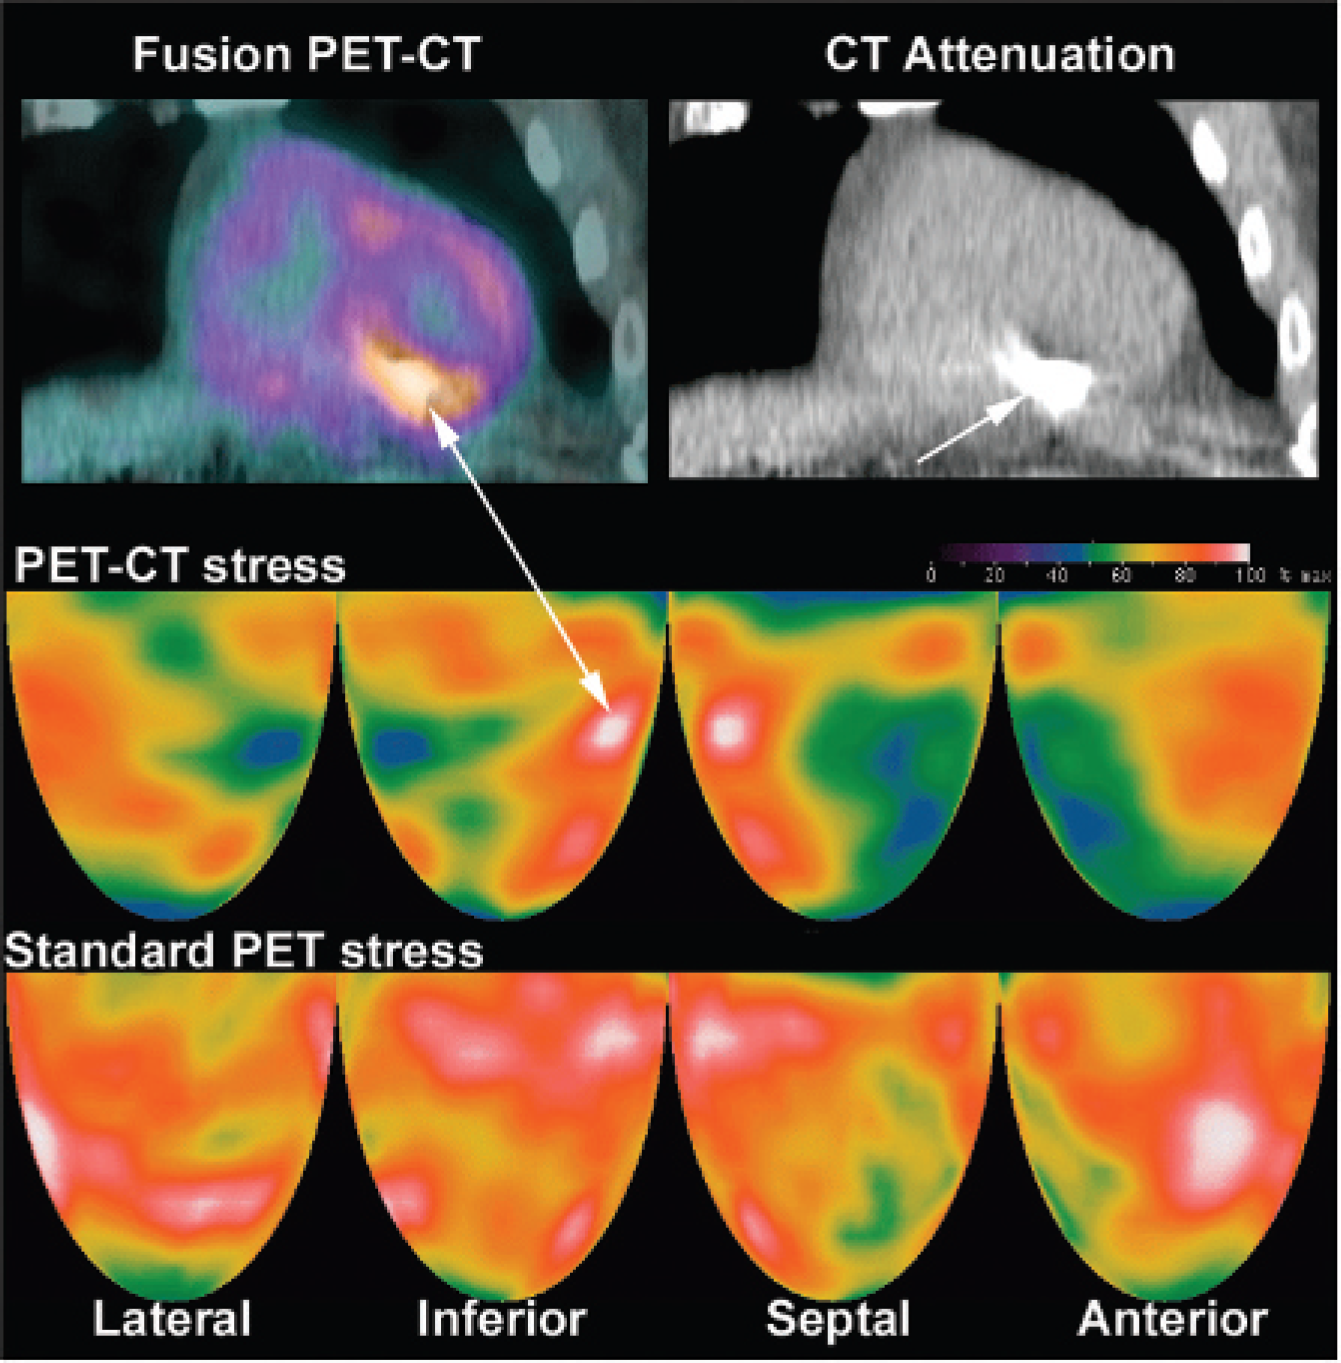
Table 3 and Table 4 compare relative myocardial uptake using attenuation correction by helical CT with cine CT in 161 patients (paired studies on the same patient using two different CT attenuation techniques). Only a subset studied after our intitial analysis of misregistration had absolute activity data (n = 51 rest, n = 16 stress). Figure 3 illustrates an artifactual defect owing to attenuation-emission misregistration that was not corrected by software-shifting the helical CT but was corrected by cine CT data. Both rest and stress artifacts are included in Table 3, whereas Table 4 distinguishes between artifacts observed on the rest image (n = 101, 62.7%) and on the stress image (n = 60, 37.3%). Both tables demonstrate that cine CT attenuation reduces artifactually abnormal end points compared to helical CT attenuation owing to better coregistration on the cine CT-PET images.
Quantitative Relative Defect End Points Comparing Helical and Software-Shifted Helical CT for 93 Paired Studies Demonstrating Rest or Stress Artifacts

CT = computed tomography; NS = not significant; SD = standard deviation.
Quantitative Defect End Points Comparing Helical and Software-Shifted Helical CT Separating Rest and Stress Artifacts for the 93 Paired Studies with Misregistration Artifacts

CT = computed tomography; NS = not significant; Str/rst = stress/rest; % = percentage of left ventricle.
Absolute uptake available only for 13 rest studies and 8 stress studies.
Comparison with Optimal CT Attenuation
In our data, cine CT was identified as the best attenuation scan with the least artifacts in the majority of cases (n = 136, 76.8%), whereas in a minority of cases, helical CT (n = 31, 17.5%) and shifted helical CT (n = 10, 5.6%) were judged to be the optimal attenuation image obtained.
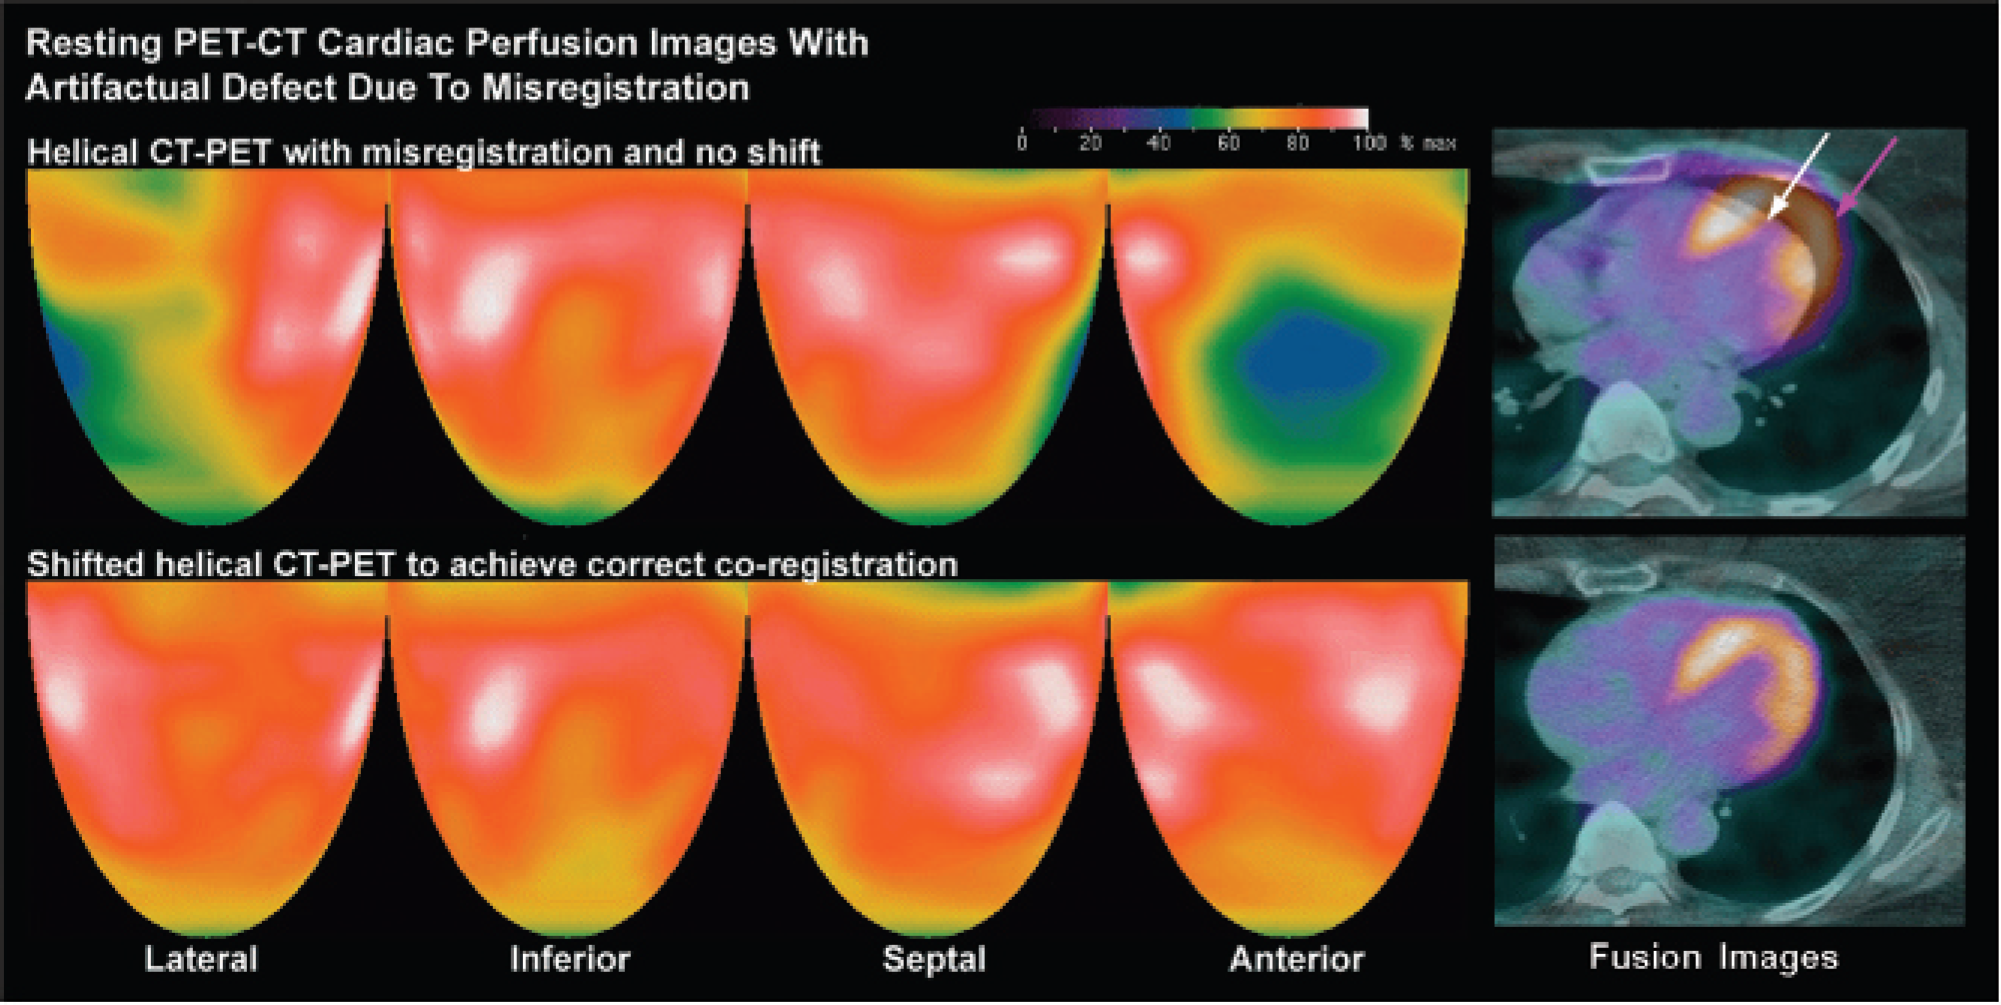
Myocardial perfusion images by helical CT-PET with an artifactual defect (blue and green) owing to misregistration of the CT image (white arrow) and the emission images (purple arrow) on CT-PET fusion images. Shifting the helical CT images to coregister properly with the emission images eliminates this false-positive result. The color bar indicates the relative scale of activity from maximum in white through decreasing steps to red, yellow, green, blue, and black for the lowest activity.
Quantitative Relative Defect End Points Comparing Helical and Cine CT for 161 Paired Studies Demonstrating Rest or Stress Artifacts
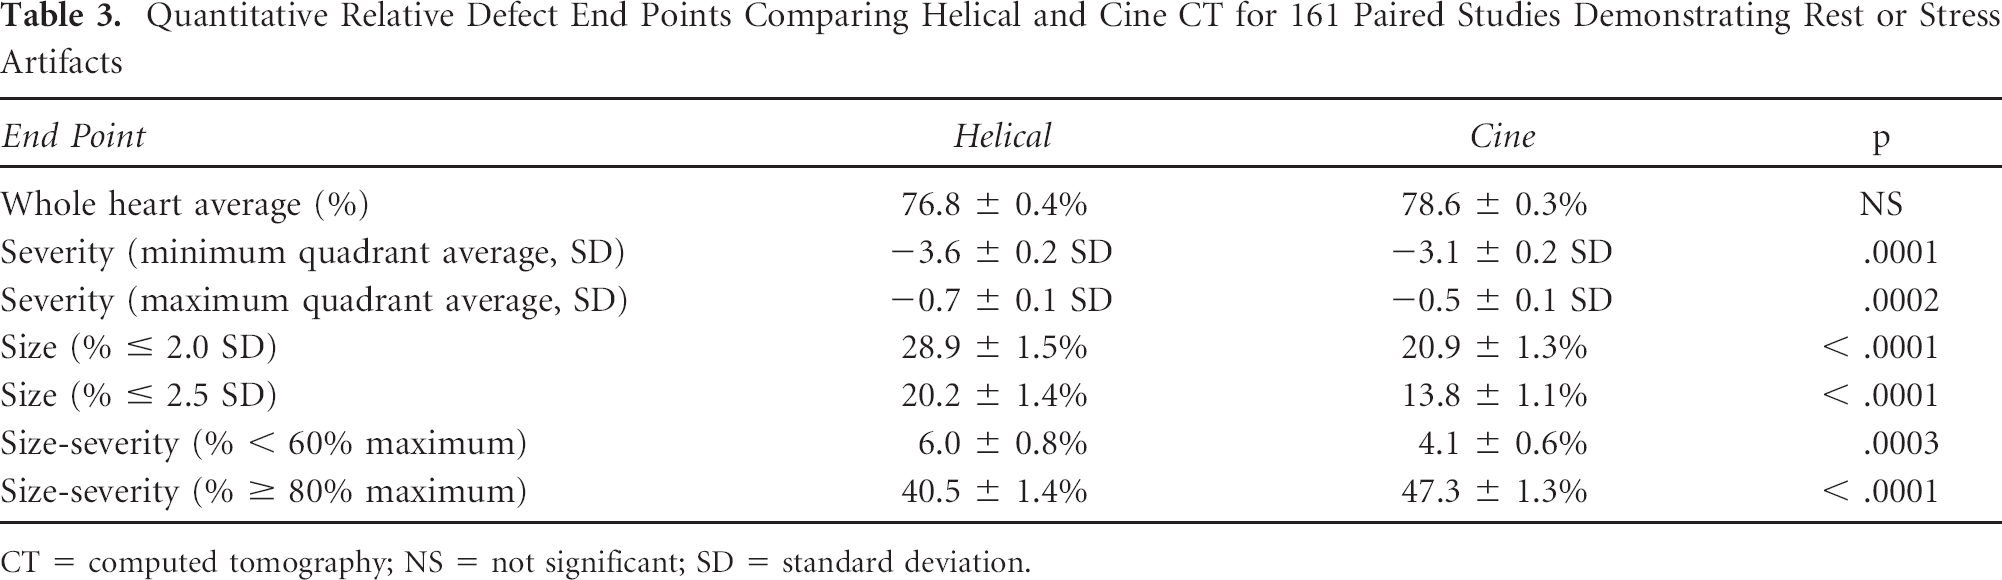
CT = computed tomography; NS = not significant; SD = standard deviation.
Table 5 compares both relative and absolute uptake differences in quantitative end points between each type of attenuation scan and the optimal CT attenuation scan that may have been achieved by shifting either the helical or the cine CT data or both. Absolute activity data were available only for a subset (n = 67 helical, n = 21 shifted helical, and n = 67 cine). Although many end points differ in absolute terms, the magnitude of difference is greatest for helical CT, less for shifted helical CT, and least for cine CT compared to whichever type of attenuation was judged optimal for each patient. End points related to defect size and severity were most affected. For example, the percentage of the scan below 60% of the maximum compared to using optimal CT attenuation differed by an absolute average of 7.5% (relative difference of 2.1) for helical-corrected studies, by an absolute average of 3.7% (relative difference of 1.5) for shifted helical–corrected studies, and by an absolute average of 0.7% (relative difference of 0.2) for cine-corrected studies, which were statistically significant. The percentage of the scan outside 2.5 SD compared to using optimal CT attenuation differed by an absolute average of 13.2% (relative difference of 1.8) for helical-corrected studies, by an absolute average of 9.3% (relative difference of 0.9) for shifted helical–corrected studies, and by an absolute average of 1.6% (relative difference of 0.1) for cine-corrected studies, which were statistically significant.
Cine CT-PET has the least artifacts on average compared to helical or shifted helical CT-PET owing to cine CT most closely matching the average attenuation during breathing while acquiring the emission scan. However, a “big sigh” breath during cine CT may cause significant artifact, illustrated in Figure 4, not seen on helical CT-PET. Because it is easily recognized, the “big sigh” breath cycle can be removed from the CT attenuation data, using the remaining CT data during the remaining breathing cycles for attenuation correction, also shown in Figure 4.
Quantitative Defect End Points Comparing Helical and Cine CT Separating Rest and Stress Artifacts for the 161 Paired Studies with Misregistration Artifacts

CT = computed tomography; NS = not significant; Str/rst = stress/rest; % = percentage of left ventricle.
Absolute uptake available only for 51 rest studies and 16 stress studies.

Artifactual defects on helical CT-PET at rest (green) owing to misregistration (arrows) that improve but remain substantially abnormal after shifting CT data to achieve coregistration. This artifact resolves on resting and stress cine CT-PET where the CT data are acquired over two breath cycles such that the average CT attenuation correction during breathing matches the average attenuation during breathing of the emission data acquisition. The minimal heterogeneity of the resting cine CT-PET that improves with dipyridamole stress is common on people with risk factors for atherosclerosis as a potential marker of early atherosclerosis as previously reported. 18
Some attenuation artifacts on PET-CT cannot be corrected by shifting helical CT or by cine CT. Figure 5 illustrates a patient with an implanted defibrillator where the defibrillator cable in the right ventricle caused a high-density star artifact on the CT scan that overcorrects the inferior region of the emission scan. This overcorrection of the inferior region caused relatively severe anterior and lateral defects despite correct coregistration. In this case, repeat PET imaging using a Positron scanner with a rotating rod attenuation correction eliminated the artifactual anterior and lateral defects, as shown in Figure 5.
Discussion
Our results support the use of software-shifted helical CT attenuation correction in cardiac PET-CT to minimize artifacts owing to transmission-emission misregistration on a case-by-case basis. Both qualitative and quantitative data demonstrate improvement with decreased frequency and severity of artifacts after software shifting of helical CT-PET compared to helical CT-PET images in the same patient with attenuation-emission misregistration.
Quantitative End Point Differences from the Optimal CT Attenuation Technique by Various Attenuation CT Techniques

CT = computed tomography; NA = not available; NS = not significant; Str/rst = stress/rest.
values are expressed as quadratic mean (95% confidence interval), and the p value arises from a paired t-test.
Absolute uptake Δ available only for 67 paired helical comparisons, 21 paired software-shifted helical comparisons, and 67 paired cine comparisons.
Shifted helical CT attenuation correction improves on simple helical CT sufficiently for most visual clinical interpretation. However, it does not achieve as much artifact suppression as cine CT, as shown by Table 3, Table 4, and Table 5 and previous work from our group. 10 In Table 5, absolute activity recovery in using optimized helical CT attenuation correction is significantly different from cine CT that, on average, most closely matches the average attenuation during breathing while emission data are acquired. For quantifying absolute perfusion in cc/min/g 23 accurately, recovering absolute activity becomes crucial because flow models for determining perfusion in cc/min/g markedly enhance small differences in radionuclide uptake that are magnified into large differences in absolute flow.
For cardiac PET, each CT attenuation correction technique has a different propensity to produce artifacts, the greatest with helical CT, next shifted helical CT, next cine CT, and least PET with rotating rod attenuation. Given that PET-CT scanners were designed initially for cancer, brain, or body imaging, these misregistration problems are greater for cardiac imaging that requires different, more complex technical hardware, software, and protocols. Theoretically, classic cardiac PET with a three–rotating rod attenuation correction method would have the least artifacts and therefore the best quantification with the lowest radiation exposure and throughput capacity comparable to that of PET-CT. However, our group has demonstrated that even rotating rod PET attenuation correction can create coregistration problems, 15 and its unsupervised application will not produce consistently optimal results.
Our series of reports on cardiac PET-CT10,15,16 emphasize those technical aspects required for definitive, stand-alone, quantitative, physiologic, cardiac PET imaging as the basis for clinical decisions and management not possible using any other technology.1,17–22 To achieve this goal, our laboratory's current protocol consists of a low-dose resting helical CT scan during a breath-hold, resting emission scan, stress emission scan, and, finally, a cine CT scan while breathing. Images are routinely reconstructed with cine CT attenuation, checked for misregistration, and software-shifted or the helical or software-shifted helical CT attenuation data are used as needed.
Limitations of the Study
Most current commercial PET-CT scanners lack appropriate hardware or software for cine CT. Some have cine CT capacity but average the cine CT data with the helical CT data that biases the cine CT data and lack the capacity for fusion images using the averaged cine-helical CT-PET data for visually assessing and correcting misregistration.

Artifactual defects on cine CT-PET (green) owing to the patient taking a “big sigh” during the cine CT acquisition resulting in a “gap” in attenuation correction seen in the fusion scan (white arrow). Removing the attenuation data during this “sigh” part of the breathing cycle and using the remaining breath cycles of the cine CT for reconstruction substantially reduces the artifact. The helical CT-PET does not show this gap because it is acquired as a brief “snapshot” during a shorter time interval of the breath cycle. The resting heterogeneity on both the corrected cine CT-PET and the helical CT-PET improves after dipyridamole stress with a small remaining stress defect in the distribution of a small anterior coronary artery branch and the distal posterior descending coronary artery (black arrows). The severe resting perfusion heterogeneity that improves after dipyridamole stress is associated with coronary artery disease, 18 likely owing to endothelial dysfunction known to cause resting perfusion heterogeneity.
There are significant trade-offs in dose and resolution between images optimized for cardiac versus extracardiac structures. In view of the higher radiation dose required for high-quality CT imaging of extracardiac structures, it is reasonable to use lower CT dose for PET adequate for attenuation correction without formal interpretation of extracardiac structures that are suboptimally imaged on attenuation scans.
Conclusions
Frequent artifacts owing to attenuation-emission misregistration are substantially corrected in a specific patient by shifting the helical CT scans on attenuation-emission fusion images to achieve proper coregistration using custom software. However, helical CT attenuation correction either with or without shifting remains, on average, significantly inferior to cine CT attenuation on both qualitative and quantitative comparison. Because either helical or cine CT attenuation correction may be suboptimal in any individual patient, cardiac PET-CT for reliable, definitive, quantitative myocardial perfusion as an independent reliable guide to clinical management would optimally have the capacity for both helical and cine CT with software for shifting CT attenuation data to optimize coregistration with emission images as needed for both helical and cine CT-PET protocols.
Artifactual defects (green and blue) caused by defibrillator leads in the right ventricle that show a high-density region or star pattern (arrow) on both helical or cine CT. This localized high density in the attenuation data overcorrects the inferior myocardium, leaving severe relative anterior and lateral defects on rest and dipyridamole stress images. Repeat rest/stress dipyridamole PET using the Positron Corporation scanner with a rotating rod attenuation correction method eliminates this artifact to show a mild stress-induced defect in the anterior septum owing to mild left anterior descending coronary artery disease consistent with the coronary arteriogram.
Acknowledgment
Financial disclosure of authors and reviewers: None reported.