
Abstract
In a previous study, we demonstrated that pcDNA3.1/hNIS (human sodium iodide symporter) vaccination generated hNIS-associated CD8+IFN-γ+ (interferon-γ) T cells, which are known to be involved in antitumor immunity. However, the immune response induced was insufficient to control tumor growth in vivo, which required a novel approach to potentiate hNIS vaccination effects. In the present study, we administered 131II radioiodine therapy prior to hNIS vaccination in CT26/hNIS tumor-bearing mice to facilitate the vaccine-induced immune response. We characterized hNIS-associated cytotoxic T-cell immune response and the antitumor effects induced by this 131II + hNIS combination therapy. The survival rates of CT26/hNIS tumor cells were significantly reduced by 131II treatment compared with the parental CT26 cells in vitro. 131II + hNIS combination therapy stably suppressed tumor growth below or near the original tumor size level of initial treatment, achieving 100% survival rates. Specifically, 131II + hNIS therapy enhanced IFN-γ production, hNIS-associated antitumor cytotoxic T-lymphocyte (CTL) response, and induced more dendritic cells but reduced T-regulatory cells in tumor masses. Collectively, these results suggest that combined therapy effectively enhances hNIS-associated antitumor immune response, leading to CT26/hNIS tumor growth inhibition and complete survival in Balb/C mice. These findings provide a novel and effective means of treating cancer.
MOST OF THE METHODS used to image the expression of “reporter” genes in rodents, primates, and humans require the use of postmortem tissue. However, methods based on the use of human sodium iodide symporter (hNIS) as a reporter gene labeled with 124I, 125I, 131I, or 99mTc allow visualization of various biochemical processes in living tissues. hNIS is a member of the sodium/glucose cotransporter family, which transports iodide into thyroid cells.1,2 Like other reporter genes, the hNIS gene has been used for long-term imaging in gene therapy experiments.3,4
The hNIS gene is widely and uniquely expressed in thyroid cancer tissue, whereas it is not expressed in normal surrounding tissues. This differential expression allows effective radioisotope (131II or 188 Re) therapy on the basis of its physiologic function, which influences prognosis in preclinical and clinical models.5–7 Sodium iodide symporter (NIS)-specific radioiodine accumulation in cancer has been suggested to cause significant reductions in tumor mass in athymic nude mice and immunocompetent mice.6,8,9 Cancer-specific hNIS expression is also an attractive target for immunotherapy. In a previous study, we showed that vaccination with hNIS-encoding plasmid (pcDNA3.1/hNIS) enhanced hNIS-associated antitumor immunity, including the CD8+IFN-γ+ (interferon-γ) T-cell response, with limited effects on in vivo tumor growth inhibition,10 which required additional treatment to sufficiently enhance the efficacy of the hNIS vaccine.
DNA vaccines have been primarily used in cancer immunotherapy. However, their use is limited in large animals and humans because of low immunogenicity,11 which is presumably associated with T-regulatory (Treg) cells and host cytokine imbalances.11–13 It has been demonstrated that DNA vaccines prevent cancer occurrence and recurrence14 and have many advantages over traditional vaccines. For example, DNA vaccines are relatively stable and can be easily manufactured and stored. In addition, multiple antigens can be combined into a single plasmid to target multiple pathogens or multiple components of a single pathogen.15 Therefore, it might be an ideal approach to establish the way to stably enhance the immunogenicity of DNA vaccines.
Radiation therapy injures as well as modifies gene expression in many nonneoplastic cells within the tumor stroma, including endothelial cells, intratumoral lymphocytes, and tumor cells. These changes include increased expression of Fas, major histocompability complex (MHC) class I molecules, intracellular adhesion molecules 1 (ICAM-1), and other cell-surface proteins16–22 (and Y.H. Jeon et al, unpublished results, 2009). These molecular modifications in the cancer microenvironment might cause antigen-presenting cells to detect more antigenic proteins shed by cancer cells and stimulate T cells more actively in an MHC-restricted manner. Alternatively, activated T cells may migrate to cancer tissues or immune-related organs more easily via modified adhesion molecules expressed in vascular endothelial cells. Some reports have shown promising results by combining immunotherapy and radiation therapy.22,23 In this study, we have attempted to enhance the efficacy of hNIS DNA vaccines by combining hNIS vaccination with 131II pretreatment.
Materials and Methods
Generation of cDNA Constructs and Plasmid Preparation
The hNIS-expressing vector FL-hNIS/pcDNA3.1 (pcDNA3.1/hNIS) was a gift from Dr. S. Jhiang (Ohio State University, Columbus, OH). The expression of hNIS was controlled by a cytomegalovirus promoter, and a neomycin resistance gene was also expressed under the control of SV40 promoter. Plasmid DNA was amplified in Escherichia coli DH5α and purified by large-scale plasmid preparation using endotoxin-free Giga Prep columns (Qiagen, Chatsworth, CA). The plasmid DNA produced was dissolved in endotoxin-free tris/EDTA buffer for storage.
Mice
Specific pathogen-free 6-week-old female Balb/C mice were obtained from SLC (Hamamatsu, Japan). All animals were housed under specific pathogen-free conditions and handled in accordance with the guidelines issued by the Seoul National University Animal Research Committee.
Generation of Lentivirus
To construct hNIS-expressing lentiviral vector under the control of ubiquitin C promoter, the hNIS gene was cloned into pLenti6/UbC/V5-DEST (Invitrogen, Carlsbad, CA). Replication-incompetent lentivirus was produced by cotransfecting a lentiviral vector carrying hNIS and a ViraPower Packaging Mix (Invitrogen, Carlsbad, CA) into a 293FT producer cell line. 293FT cells (6 × 10⁶) were transiently transfected using 36 μL Lipofectamine 2000 (Invitrogen) in 10 cm tissue culture plates. The cells were cotransfected with 5 μg of lentiviral vector and 10 μg of packaging plasmids (gag, pol, vsv-g, rev). Culture medium (Dulbecco's Modified Eagle's Medium [DMEM] containing 10% fetal bovine serum [FBS], and 1% penicillin-streptomycin) was changed at 24 hours posttransfection, and lentivirus-containing supernatant was harvested at 48 hours posttransfection. Harvested supernatants were centrifuged at 3,000 rpm for 15 minutes at 4°C to pelletize cell debris and then stored at −80°C for later use. To assess the activity of recombinant virus encoding the hNIS reporter gene, HT1080 human fibrosarcoma cells were infected by adding thawed lentivirus-supernatant containing 10 μg/mL of hexadimethrine bromide (Polybrene, Sigma-Aldrich, St. Louis, MO). hNIS expression was confirmed by measuring 125I uptakes.
Murine Tumor Cell Line Expressing hNIS
CT26 cells (H-2d; murine colon carcinoma cell line is syngeneic in the used Balb/C mouse strain) were infected with viral supernatants generated by a lentiviral vector expressing hNIS. 125I uptake by stable clones (CT26/hNIS) was measured using a gamma counter (GMI, Ramsey, MN). Briefly, CT26 and CT26/hNIS cells (1 × 10⁵, 3 × 10⁵, 5 × 10⁵, 7 × 10⁵) were seeded in 24-well plates. Iodide uptake was examined by incubating cells with 0.5 mL of Hanks' Balanced Salt Solution (HBSS) containing 0.5% bovine serum albumin (BSA, 10 mM of 2-[4-(2-hydroxyethyl)-1-piperazinyl] ethanesulfonic acid-NaOH, 3.7 kBq carrier-free 125I, and 10 μM NaI at pH 7.4 to yield a specific activity of 740 MBq/mmol at 37°C for 30 minutes. Cells were then washed twice with 2 mL of cold iodide-free HBSS and lysed with 0.5 mL of 0.2% sodium dodecyl sulfate. Iodide concentrations were measured using a gamma counter. Experiments were performed in triplicate, and the levels of iodide uptake are presented in counts per minute (cpm).
In Vitro Clonogenic Assay
The procedure used has been previously described in detail.24 Briefly, CT26 or CT26/hNIS cells were grown in 75 cm2 flasks and incubated for 7 hours at 37°C in 5 mL of HBSS containing 37 MBq/10 mL (1 mCi/10 mL) Na131II. The reaction was terminated by removing the radioisotope-containing medium and washing the cells twice with HBSS. Cells were then trypsinized, counted, plated at densities of 250 or 1,000 cells per well in six-well plates, cultured for 10 days in DMEM, fixed with 3:1 methanol and acetic acid, and stained with crystal violet. Macroscopic colony numbers were then counted. Survival rates are presented as percentages of colony numbers in plates containing HBSS only.
Monitoring Tumor Growth Inhibition in Living Mice
Mice (eight/group) were challenged by injecting right hindthighs subcutaneously with 1 × 10⁵ CT26/hNIS cells. Injected mice were placed on a low-iodine diet and given thryoxine-supplemented drinking water for 18 days after the CT26/hNIS challenge to maximize tumor radioiodine uptake and reduce iodide uptake by thyroid glands. At day 18 postchallenge, the mice were administered 3 mCi of 131II or PBS intraperitoneally and on days 19 and 26 postchallenge, mice were immunized with pcDNA3.1 (50 μg/50 μL) or pcDNA3.1/hNIS (50 μg/50 μL) intramuscularly (referred to as the 131II + hNIS, 131II, hNIS, and sham control groups). On days 18 and 48 postchallenge, 99mTc pertechnetate (600 μCi) was injected intraperitoneally, and mice were imaged using a γ-ray camera (ON-410, Ohio Nuclear, Solon, OH). Tumor areas were measured using a caliper on days 18, 28, 35, 42, and 48. Tumor area was defined as length (mm) × width (mm). The above in vivo tumor experiments were performed in triplicate.
Cytokine Analysis
At 33 days postchallenge, draining lymphoid cells were extracted from the lymph nodes of mice in the four treatment groups (eight/group); 4 × 10⁶ of these cells were then added to 4 × 10⁵ of irradiated (50 Gy) CT26/hNIS tumor cells seeded in the wells of 24-well plates and cultured for 2 days. Plates were then centrifuged and supernatants were transferred to 96-well plates and incubated at 4°C overnight. After washing wells with washing buffer (PBS supplemented with 0.5% Tween 20), the wells were incubated in 3% blocking buffer (BSA in PBS containing 0.5% Tween 20) for 1 hour. Rat-antimouse interleukin (IL)-4 (BD PharMingen, San Diego, CA) or rat-antimouse IFN-γ (BD PharMingen) was then applied to plates for 1 hour. Plates were then rewashed, and rabbit-antirat immunoglobulin-horseradish peroxidase (DAKO, Glostrup, Denmark) was added. Reactions were developed and read according to the manufacturer's instructions.
In Vitro Splenocyte Cytotoxicity Assays
At 33 days postchallenge, splenocytes (2 × 10⁷) were extracted from the spleens of mice in the four treatment groups. CytoTox 96 nonradioactive cytotoxicity assays (Promega, Madison, WI) were performed according to the manufacturer's instructions with minor modification. Briefly, splenocytes of treated immunocompetent Balb/C mice were cultured in the presence of human IL-2 (50 U/mL) and irradiated CT26/hNIS cells (5 × 10⁶) for three days. Then 1 × 10⁴ CT26 and CT26/hNIS target cells were added to the wells of 96-well U-bottomed plates (Costar, Chicago, IL), and splenocytes (effector cells) were added to these in a final volume of 100 μL at target to effector ratios of 1:3, 1:7.5, 1:15, and 1:30. Plates were then incubated for 45 minutes in a 5% CO2 humidified chamber at 37°C and centrifuged at 500g for 5 minutes. Aliquots (50 μL) were transferred from all wells to fresh 96-well flat-bottomed plates, and equal volumes of reconstituted substrate mix were added to the wells. The plates were then incubated at room temperature for 30 minutes in the dark. Stop solution (50 μL) was then added, and absorbances were measured at 492 nm. Cytotoxicity percentages were calculated at each effector to target cell ratio using [A (experimental) – A (effector spontaneous) – A (target spontaneous)] × 100/[A (target maximum) – A (target spontaneous)]. hNIS-specific lysis percentages were calculated by subtracting the lysis percentages of CT26 cells by splenocytes from those of CT26/hNIS target cells by splenocytes.
Numbers of CD4+CD25+ and CD11c+CD86+ Cells in the Tumor Tissues of Treated Mice
Tumors were surgically removed on day 33 postchallenge from mice in the four treatment groups (eight/group), minced into small fragments, and incubated in collagenase D (1 mg/mL; Roche Molecular Biochemicals, Mannheim, Germany) for 30 minutes at 37°C with vortexing 5 minutes to facilitate tissue dissociation. Single-cell suspensions were prepared by passing digested tumor tissues through a stainless mesh; dead cells were removed using Ficoll-Paque density gradients. Tumor cell suspensions were then blocked with anti-CD16/32 antibody on ice for 10 minutes to minimize nonspecific binding and treated with antimouse monoclonal antibodies against CD11c (HL 3), CD86 (GL 1), CD4 (H129.19), or CD25 (PC 61) (BD PharMingen). Cell suspensions were then washed in PBS containing 2% FBS and fixed in 0.5 mL PBS containing 1.5% paraformaldehyde. Analyses were counted by flow cytometry (Epics XL, Beckman Coulter, Brea, CA).
Statistical Analysis
All data are presented as means ± SD and are representative of at least two separate experiments. Statistical significance was determined using the unpaired Student t-test. Kaplan-Meier curves were used to determine mouse survival rates and were compared using the log-rank test; p values of < .05 were considered statistically significant.
Results
Establishment of a Stable Cancer Cell Line Expressing hNIS and In Vitro Clonogenic Assays
125I uptake assays were used to determine hNIS gene expression in selected stable cell lines (CT26/hNIS) generated by infecting CT26 cells with hNIS-expressing lentivirus. 125I uptakes were measured by detecting 125I radioactivity from CT26/hNIS cells compared to CT26 cells (Figure 1A). As shown in Figure 1B, the survival rate of CT26/hNIS cells was markedly reduced to 18.6 ± 1.9% in response to 131II compared to CT26 cells, which showed a more than approximately 80% survival rate (p < .001). These results indicate that the stable CT26/hNIS cell line we generated expresses hNIS and that the function of hNIS in this cell line is physiologically normal.
131I + hNIS Therapy Showed a Greater Antitumor Effect against CT26/hNIS Tumors than 131I or hNIS Therapy Alone
To determine whether hNIS generates an antitumor response, we challenged mice with CT26 or CT26/hNIS tumor cells at day 0. We vaccinated these mice at days 3 and 10 postchallenge with pcDNA3.1 or pcDNA3.1/hNIS. As shown in Figure 2, pcDNA3.1/hNIS vaccination had no antitumor effect on CT26 tumors, but pcDNA3.1/hNIS vaccination retarded the growths of CT26/hNIS tumors. These results demonstrated that hNIS contributed substantially to the generation of an antitumor immune response.

Establishment of a stable cell line expressing hNIS and 131II clonogenic assays. A, CT26 cells were transduced with a lentiviral construct containing the hNIS gene driven by ubiquitin C promoter. hNIS gene expression was determined using in vitro 125I uptake assays, and 125I uptake was found to be linearly correlated with cell number. The radioactivities of CT26/hNIS cells increased with cell number, whereas the radioactivities of uninfected CT26 cells remained at basal levels. B, hNIS-transduced cancer cells were selectively killed by 131II. Survival rates are expressed as percentages of colony numbers in plates containing buffer only. Experiments were performed in triplicate, and bars indicate means ± SDs.

Immunotherapy of preestablished CT26 and CT26/hNIS with hNIS DNA vaccination. Mice were challenged subcutaneously with 1 × 10⁵ CT26 cells or CT26/hNIS cells at day 0. At days 3 and 10 postchallenge, mice were immunized intramuscularly with pcDNA3.1 or pcDNA3.1/hNIS. Tumor sizes were measured using a caliper at days 18, 21, 28, 35, and 42. Tumor areas were defined as length (mm) × width (mm). Results shown are representative of two experiments, and bars indicate means ± SDs (n = 5 mice/group).
The above experiments showed that the immune response induced by hNIS delayed tumor growth in vivo, which was relatively weak (see Figure 2). To improve the antitumor effect mediated by hNIS, we introduced 131II therapy ahead of hNIS DNA vaccination primarily expecting that cell death induced by 131II would provide more antigens and a greater immune response.
To investigate the efficiency of 131II + hNIS combination therapy on tumor regression, we performed the treatment as schematically shown in Figure 3. Initially, CT26/hNIS cells were injected into immunocompetent Balb/C mice subcutaneously (day 0), and then 131II was injected intraperitoneally at day 18 postchallenge. Finally, at days 19 and 26 postchallenge, pcDNA3.1/hNIS was injected intramuscularly to boost the immune response against hNIS. Animals were sacrificed at day 33 postchallenge, and cytotoxic T-lymphocyte (CTL) assays and immunologic analyses were performed.
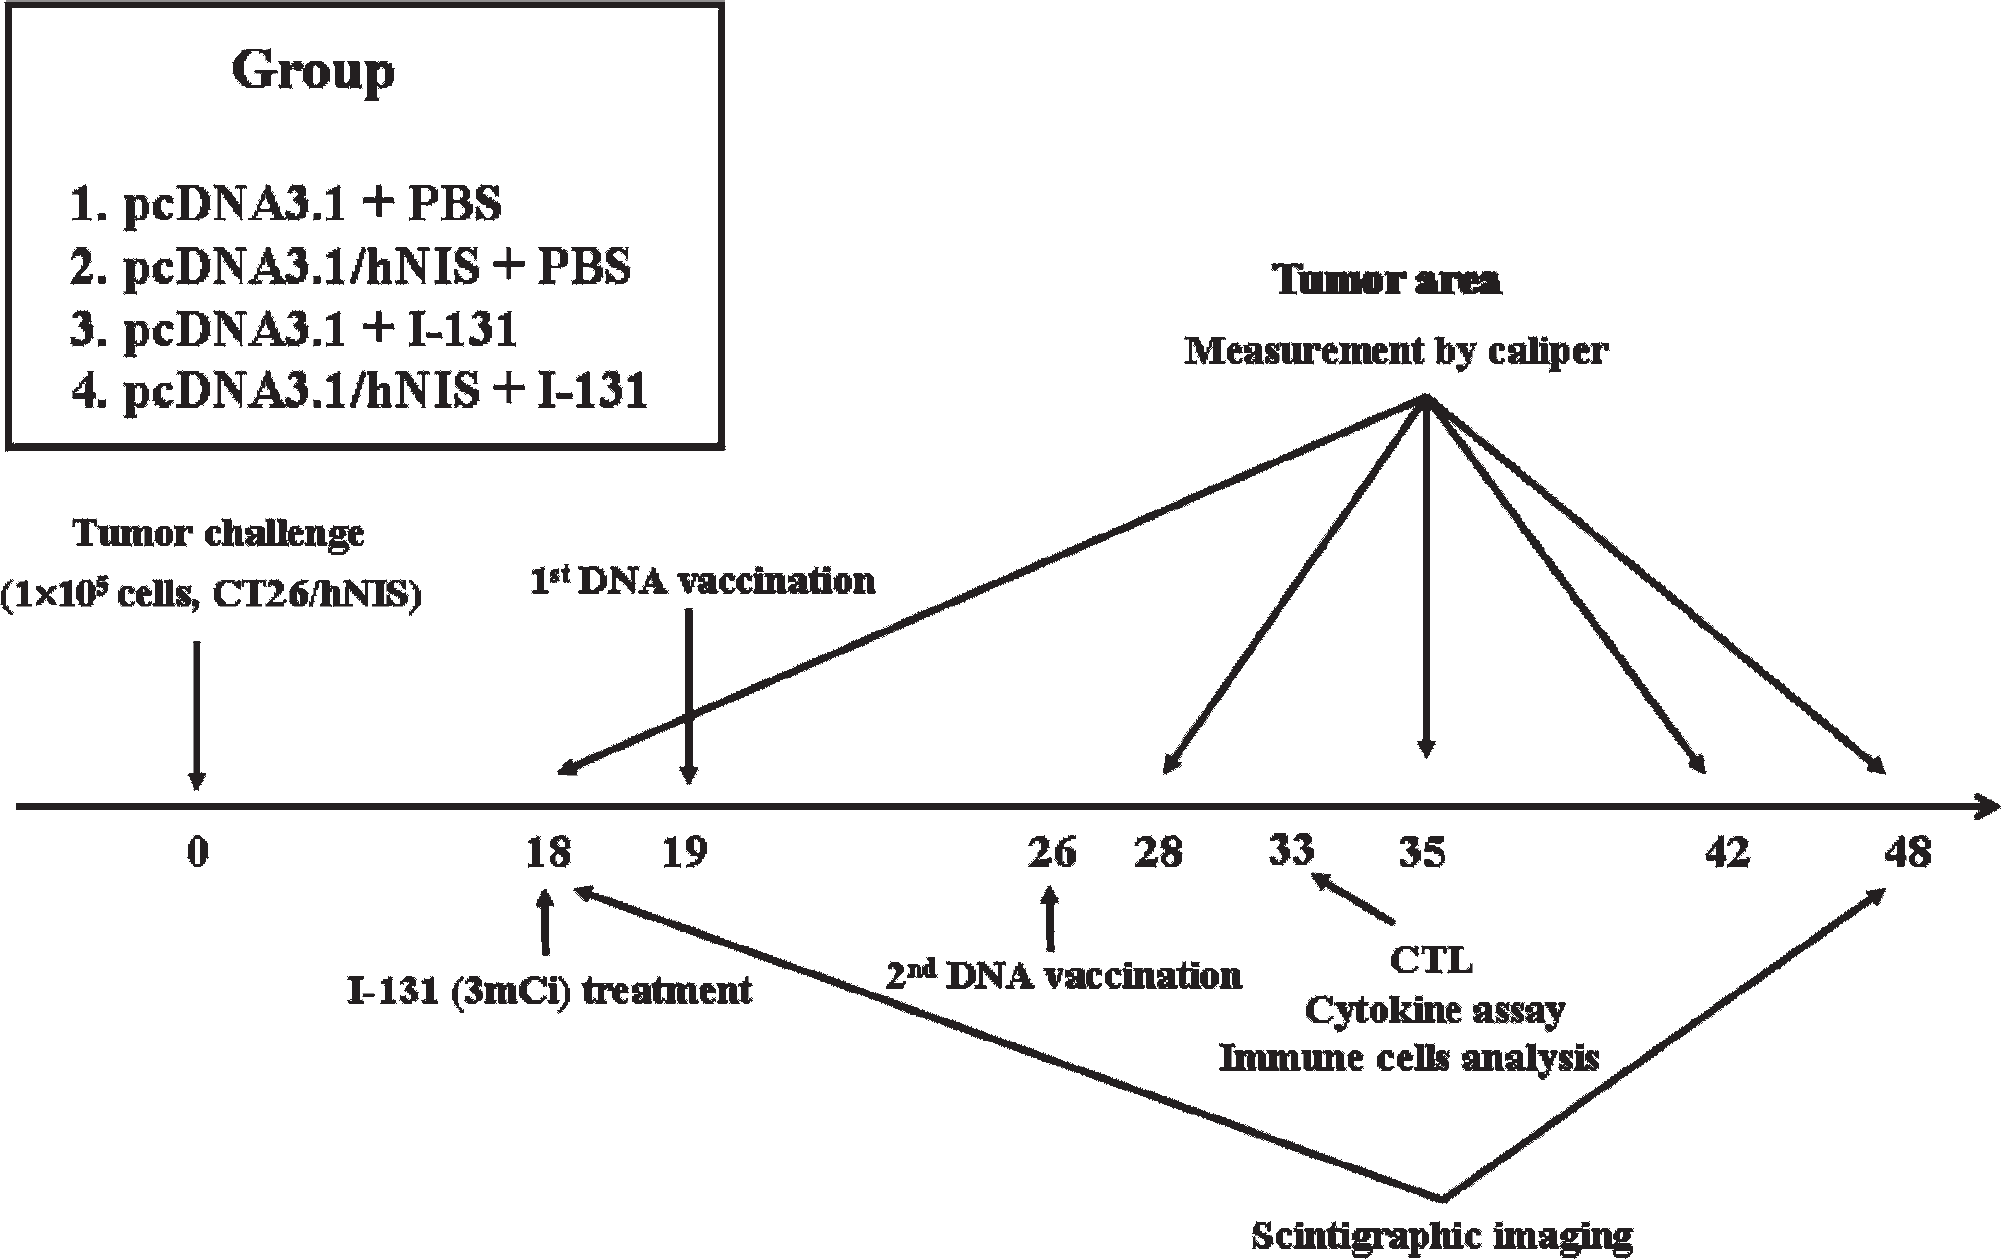
Experimental procedure used for the combined radioiodine therapy with hNIS vaccination (131II + hNIS) treatment. Mice (8/group) were challenged subcutaneously with 1 × 10⁵ CT26/hNIS cells. Mice then received a low-iodine diet and T4 supplementation in drinking water for 18 days post-CT26/hNIS challenge to maximize radioiodine uptake by tumors and to reduce iodide uptake by thyroid glands. At day 18 postchallenge, mice were administered with 131II or PBS intraperitoneally, and at days 19 and 26 postchallenge, mice were immunized intramuscularly with pcDNA3.1 or pcDNA3.1/hNIS. Scintigraphic images were acquired at days 18 and 48 postchallenge, and tumor sizes were measured using a caliper at days 18, 28, 35, 42, and 48 postchallenge. CTL = cytotoxic T lymphocyte.
Initially, we examined antitumor effects by measuring tumor size in Balb/C mice inoculated with CT26/hNIS cells (Figure 4A). Tumor growth in 131II + hNIS-treated mice was more effectively suppressed than in mice treated with 131II or hNIS alone. The tumor size of 131II + hNIS therapy up to day 48 postchallenge was consistently below or near the original tumor size level of initial treatment and significantly smaller than the sham control (pcDNA3.1 + PBS) (p < .01 at days 28 to 48 postchallenge), hNIS alone (p < .01 at days 28 to 48), or 131II alone (p < .01 at day 28, p < .05 at day 35, p < .01 at days 42 to 48). hNIS alone (p < .01 at days 35 to 48) and 131II alone (p < .05 at day 28, p < .01 at days 35 to 48) also showed inhibitory effects on tumor growth compared to the sham control. In addition, 131II alone (p < .05 at day 28 and p < .01 at days 35 to 48) had a greater inhibitory effect on tumor growth than hNIS alone.
The antitumor effects of the respective treatments were also examined by scintigraphic imaging at days 18 and 48 postchallenge (Figure 4B) to visualize 131II uptake by hNIS-expressing cells, which represents viable tumor mass. At day 18 postchallenge, all tumors in mice injected with CT26/hNIS cells had the similar scintigraphic intensities. However, at day 48 postchallenge, tumors in mice treated with 131II + hNIS demonstrated much lower scintigraphic intensities than mice treated with 131II alone, hNIS alone, or the sham control.

The determination of tumor growth inhibition induced by 131II + hNIS therapy. Mice were challenged with 1 × 10⁵ CT26/hNIS cells subcutaneously. They were then administered 131II or PBS intraperitoneally at day 18 and pcDNA3.1 or pcDNA3.1/hNIS intramuscularly at days 19 and 26. A, Tumor sizes were measured using a caliper at days 18, 28, 35, 42, and 48. Tumor areas were defined as length (mm) × width (mm). B, Mice were imaged using a γ-camera equipped with a collimator at days 18 and 48. B = urinary bladder; S = stomach; T = thyroid. C, Survival rates are percentages of animals surviving on the days indicated. The results shown are representative of three individual experiments, and bars indicate means ± SDs (n = 8 mice/group).
The antitumor effect of 131II + hNIS therapy was also represented by Kaplan-Meier survival curves (Figure 4C). Mice treated with 131II + hNIS or 131II alone therapy were found to have significantly longer survival times than the mice treated with hNIS alone or sham controls. Furthermore, all tumor-bearing mice in the 131II + hNIS group survived until day 60 postchallenge, whereas only about 50% of animals in the 131II group survived at this time.
Summarily, our in vivo results indicate that combined 131II + hNIS therapy stably suppresses CT26/hNIS tumor growth compared to 131II or hNIS alone, which extends survival.
131I + hNIS Therapy Enhanced T-Helper 1 Cytokine Profiles and the Killing Activities of CTLs
Typical antitumor immune responses are mediated by T-helper (Th)1 cytokines. Therefore, to identify the type of hNIS-mediated immune response elicited by 131II, IFN-γ (a Th1 cytokine) and IL-4 (a Th2 cytokine) enzyme-linked immunosorbent assays were performed on draining lymphoid cells.
The amount of IFN-γ protein in draining lymphoid cells after 131II + hNIS treatment was significantly higher than after hNIS treatment (p < .005), 131II treatment (p < .005), and the sham control (p < .005) (Figure 5A). Furthermore, IFN-γ concentrations in the supernatants of draining lymphoid cells after hNIS (p < .005) and 131II treatments (p < .005) were higher than in those of sham controls. On the other hand, IL-4 protein levels in these supernatants were similar for all four treatments (see Figure 5A). These results suggest that the Th1 immune response is the dominant response mediated by hNIS and that the level of this response is significantly increased by 131II.
Analyses of immune responses induced by 131II + hNIS therapy. A, Cytokine profiles after 131II + hNIS therapy. At day 33 postchallenge, draining lymphoid cells (4 × 10⁶) were extracted from the lymph nodes of immunized mice. Cells obtained from mice treated with 131II + hNIS, 131II, or hNIS were stimulated with irradiated CT26/hNIS cells for the next 2 days, and then supernatants were assayed for the presence of IFN-γ and IL-4. The results are representative of three respective experiments, and bars indicate means ± SDs (n = 8 mice/group). B, hNIS-associated lysis of CT26/hNIS cells by cytotoxic T lymphocytes induced by 131II + hNIS. At day 33 postchallenge, splenocytes (2 × 10⁷) were extracted from mouse spleens. Splenocytes from mice treated with 131II + hNIS, 131II, or hNIS were cultured with IL-2 and irradiated with CT26/hNIS cells (5 × 10⁶) for 3 days. Cytotoxic activities against CT26/hNIS target cells were determined using a nonradioactive cytotoxicity assay. The results shown are representative of experiments performed in triplicate (n = 8 mice/group).
To examine hNIS-associated lysis of CT26/hNIS cells by cytotoxic T cells, we performed lactate dehydrogenase assays with the splenocytes of treated mice. As shown in Figure 5B, 131II + hNIS increased the killing activities of CTLs more effectively than 131II or hNIS alone, which indicates that CTL immune responses are induced by hNIS and amplified by 131II.
Collectively, these results suggest that hNIS mediates Th1 immune responses, which induce CTL activity and suppress tumor growth, and that this immune response is enhanced by 131II.
131I + hNIS Therapy Increased Tumoral Mature Dendritic Cells but Decreased Treg Cells Compared to 131I or hNIS Alone
One of the critical questions regarding the antitumor effects induced by 131II + hNIS therapy is about the types of immune cells responsible for antitumor effects. To identify immune cell types in tumor masses, we initially counted tumoral dendritic cells (DCs) relative to hNIS-expressing tumor cells in tumor tissues. As shown in Figure 6, A and B, hNIS (p < .05 vs the sham control) and 131II treatment (p < .05 vs the sham control) increased the number of CD11c+CD86+ cells. However, 131II + hNIS therapy more strongly increased CD11c+CD86+ cell numbers (758 ± 87 per 3 × 10⁴ tumor cells) than each therapy alone (hNIS, 328 ± 61 per 3 × 10⁴ tumor cells, p < .05; 131II, 390 ± 72 per 3 × 10⁴ tumor cells, p < .05).

Analysis of immune cells in tumor tissues after 131II + hNIS treatment. Tumors were surgically removed on day 33 postchallenge, minced into small fragments, and incubated with collagenase D (1 mg/mL; Roche Molecular Biochemicals, Mannheim, Germany) for 30 minutes at 37°C with vortexing every 5 minutes to facilitate tissue dissociation. Tumor cell suspensions were blocked with anti-CD16/32 Ab on ice for 10 minutes and then stained with antimouse mAb to CD11c (HL 3), CD86 (GL 1), CD4 (H129.19), or CD25 (PC 61). The number of CD11c+CD86+ or CD4+CD25+ cells among 3 × 10⁴ cells is shown in the upper right corner. A and C contain representative flow cytometric results of CD11c+CD86+ and CD4+CD25+ populations, respectively. B and D represent the mean numbers of CD11c+CD86+ and CD4+CD25+ cells per 3 × 10⁴ cells in tumors, respectively. The results shown are representative of three experiments, and the bars indicate means ± SDs (n = 8 mice/group).
The number of Treg cells was also analyzed by fluorescence-activated cell sorter. As shown in Figure 6, C and D, 131II + hNIS therapy (142 ± 20 per 3 × 10⁴ tumor cells) significantly reduced the number of CD4+CD25+ T cells compared to hNIS or 131II therapy alone (268 ± 22 per 3 × 10⁴ or 244 ± 10 per 3 × 10⁴ tumor cells, respectively, both p < .05), although all three treatments significantly reduced CD4+CD25+ T-cell numbers compared to the sham control. These results indicate that 131II + hNIS effectively reduced the number of Treg cells compared to each therapy alone.
Summarily, increases in mature DC number and reductions in Treg cell number in tumor masses by 131II + hNIS treatment were found to be responsible for the observed increase in antitumor immune response.
Discussion
Several types of cancer immunotherapies, based on modified tumor cells, peptides, recombinant viral vectors, DNA vaccines, DCs, and adoptive T-cell transfer, have been examined using preclinical or clinical disease models.25–27 Of these, DNA vaccines offer the most attractive and potentially effective antigen-specific strategies. However, several in vivo studies have reported that DNA vaccines induced relatively poor immunogenic responses, mainly owing to the inability of DNA to amplify and spread.28 Therefore, several new strategies have been introduced to enhance the immunogenicity of DNA vaccines.29–31 However, thus far, no satisfactory results have been obtained to assist with long-term protection against tumor and the prevention of tumor recurrence.
Several vector systems, especially retroviral and adenoviral systems, have been used in clinical trials to increase the efficiency of DNA delivery.32,33 Although viral vectors can effectively and stably infect the host cells, they are associated with several risks, such as the chromosomal recombination of wild-type virus and the activation of proto-oncogenes.34 These risks can be avoided by using nonviral vectors for gene delivery. However, because nonviral vectors used for DNA vaccination usually contain a transcription unit as well as bacterial sequences, they can influence the host's immune response.35
We presume that pcDNA vaccination would induce a nonspecific immune response in the parental CT26 tumor and CT26/hNIS tumor model. However, we could not study the nonspecific immune response induced by pcDNA vaccination for the following reasons: (1) pcDNA3.1 (mock group, nonviral vector) vaccination did not have an antitumor effect on CT26 and CT26/hNIS tumors, and (2) pcDNA3.1/hNIS vaccination (therapy group, nonviral vector) retarded the growth of CT26/hNIS tumors, except for CT26 tumors (see Figure 2). These findings suggest that the mock nonviral vector would not affect the hNIS-associated antitumor immune response generated by hNIS vaccination. In this study, we successfully established a novel approach to enhance the efficiency of DNA vaccines by pretreatment with 131II. We found that the antitumor immune response against CT26/hNIS tumors was significantly increased, and tumor size was stably suppressed in vivo to levels below or near the original tumor size, with 100% survival rates up to 60 days after tumor inoculation.
Previous studies have used preventive vaccination models in which the vaccinations were performed before tumor challenges.8,10 These models did not adequately simulate clinical settings involving patients with detectable tumors. Thus, our model is more advanced for two reasons. First, it is a simple and potent vaccine-based immunotherapy model in which the immunogenic hNIS molecule also functioned by taking up 131II, and the combination of 131II and hNIS therapy showed potent in vivo antitumor effects. Second, this model is a clinically relevant therapeutic vaccination model in which vaccination was performed using animals with measurable tumor masses.
Although the exact biologic mechanisms of the hNIS vaccine-enhancing effects of 131II pretreatment are not yet fully understood, we suggest the following mechanisms based on our findings. First, we found that 131II pretreatment was sufficient to damage or kill a small proportion of tumor cells via hNIS-mediated 131II uptake. This could release more tumor antigens than those released spontaneously or exposed on the viable cell surfaces. The initial tumor cell injury induced by 131II could have been sufficient to provide a potent adjuvant effect for the CTL response.36 Second, 131II may upregulate the expression of MHC class I, Fas, and ICAM-1 on the surface of CT26/hNIS tumor cells (Y.H. Jeon et al, unpublished results, 2009). This could enhance the killing of tumor cells by CTLs (see Figure 5B). Third, tumor growth inhibition could be explained by increased tumoral DCs attracted by CCL20 and activated by GGCGCCGCG(CG)-rich motifs (CpGs); this has been reported as being critical for an effective antitumor immune response in tumor-bearing hosts.37 In this study, 131II + hNIS therapy synergistically increased mature tumoral DCs compared to each therapy alone (see Figure 5, A and B). The initial microenvironment changes induced by tumor cell death in a cytokine and chemokine milieu, as well as the cellular debris, including fragmented peptides and nucleic acids containing CpG-like motifs, might initiate and amplify DC recruitment, maturation, or both. Finally, the initial suppression of Treg cells by 131II (see Figure 5, C and D) might be an essential step in 131II + hNIS therapy-induced antitumor CTL activity (see Figure 5B) and the in vivo tumor growth inhibition in mice with immune tolerogenic tumors (see Figure 4). Treg cells are known to play a key role in the host immune reaction, influencing the prognosis of patients with tumors.38–41 However, it is not yet clear whether the Treg cell event is the initiating step or a subsequent step in the complex network of host-tumor immune reactions. Nonetheless, it is conceivable that CTL activity may be enhanced (see Figure 5B) directly by increased mature DCs (see Figure 5, A and B) cross-presenting tumor antigens in an MHC class I-restricted manner42 or secondarily by decreased Treg cells (see Figure 5, C and D) via transforming growth factor β signals.43 Recently, a similar combination therapy based on a DNA vaccine model involving epigallocatechin-3-gallate was reported to enhance CTL-mediated antitumor immunity. In that study, vaccine therapy was started as early as 3 days after tumor inoculation.44 In contrast, our present model was designed to treat the tumors of clinically detectable size. Therefore, our model is clinically more valuable as a therapeutic vaccine model.
The presence of hNIS on the basolateral membrane of thyroid follicular cells has been used for many years to diagnose thyroid diseases and to treat and monitor thyroid cancers safely and effectively with radioiodine.45 Although there have been a few reports of diminished NIS expression in thyroid cancer tissues,1,46 NIS is known to be uniquely expressed in cancerous thyroid tissues.47 The clinical application of NIS is not restricted to thyroid cancer because (1) some other cancers, such as breast cancer, have been reported to aberrantly express NIS48 and (2) NIS gene transfer with a tissue-specific promoter could allow the selective targeting of cancer cells, thus maximizing tissue-specific cytotoxicity and minimizing the toxic side effects in normal cells.9,49 Thus, hNIS is a promising dual target of 131II therapy and hNIS immunotherapy in cancers overexpressing hNIS, either by natural or artificial means, and hNIS is an important tool for evaluating the in vivo efficacy of vaccines through scintigraphic imaging. hNIS is also an attractive tool as a reporter gene to visualize endogenous gene expression, intracellular events, and stem cell differentiation. For example, Kim and colleagues visualized endogenous p53-mediated transcription in a mouse tumor model using hNIS,50 and Hwang and colleagues successfully monitored the neuronal differentiation of stem cells in living mice by use of an hNIS gene under the control of a neuronal promoter.51
In the present study, an hNIS DNA vaccine and hNIS-overexpressing CT26 tumors were used in Balb/C mice instead of a mouse sodium iodide symporter (mNIS) DNA vaccine and mNIS-expressing CT26 tumors. It appears that the mNIS-based system should function in the mouse background as it is expected that the hNIS DNA vaccine will function in humans. However, the present model is superior to the mNIS-based system because the hNIS-induced antitumor immune response can be observed without interference of the possible autoimmune effects, which would be expected to occur in the homologous model. As a result, we could delineate the tumor vaccine effects in vivo and minimize the possible effects of NIS DNA vaccination on thyroid function in mice. Considering that the scintigraphic intensities are almost the same in the thyroid between day 18 and day 48 in 131II + hNIS-treated mice (see Figure 4B), functional thyroid follicular cells are thought to be well preserved without autoimmune damage. These findings are encouraging in that hNIS-expressing nonthyroid cancers might be safely targeted using this model in humans. Although it remains to be investigated whether uncontrollable autoimmune thyroiditis induced by hNIS occurs in the homologous setting, this is likely not clinically important provided that the tumor-suppressive effect is sufficient to cure advanced hNIS-expressing nonthyroid cancers in addition to thyroid cancers. Indeed, therapeutic removal of the thyroid might be justified considering the thyroid-limited hNIS expression pattern in normal tissues.
In conclusion, in the present study, we have shown that a novel combination therapy involving hNIS vaccination and pretreatment with radioiodine therapy enhanced the hNIS-associated antitumor immune response, leading to stable inhibition of tumor growth in mice with preexisting CT26/hNIS tumors. These findings provide a new rationale for the development of a therapeutic vaccine-based model for treatment of tumors expressing hNIS.
Footnotes
Acknowledgment
Financial disclosure of authors: This work was supported in part by grants from the Korean Cancer Research Center and the Korean Science & Engineering Foundation (KOSEF) via the Tumor Immunity Medical Research Center at Seoul National University College of Medicine, Korea. Y. Choi and Y. H. Jeon were supported by the BK21 Project for Medicine, Dentistry, and Pharmacy (2009).
Financial disclosure of reviewers: None reported.