
Abstract
We investigated a molecular imaging approach for the detection of collagen-induced arthritis in rats by targeting the extra domain B (ED-B) of the extracellular matrix protein fibronectin. ED-B is a highly conserved domain (identical in human and rats) that is produced by alternative splicing during embryonic development and during vascular remodeling such as angiogenesis. The hallmark of rheumatoid arthritis is synovitis leading to both angiogenesis in the synovium and the promotion of cartilage and bone disruption. For in vivo diagnostics, the ED-B-binding single-chain antibody fragment AP39 was used as a targeting probe. It was covalently linked to the near-infrared dye tetrasulfocyanine (TSC) to be visualized by near-infrared fluorescence imaging. The resulting AP39-TSC conjugate was intravenously administered to rats with collagen-induced arthritis and the respective controls. Ovalbumin-TSC was used as control conjugate. Optical imaging over a time period of 24 hours using a planar imaging setup resulted in a clear enhancement of fluorescence intensity in joints with moderate to severe arthritis compared with control joints between 3 and 8 hours postinjection. Given that AP39 is a fully human antibody fragment, this molecular imaging approach for arthritis detection might be translated to humans.
RHEUMATOID ARTHRITIS (RA) is a systemic inflammatory disorder that affects roughly 0.5 to 1% of the population; three times as many women as men are affected. 1 3 RA causes pain, swelling, and stiffness in affected joints. RA is associated with pain and disability and has a significant negative impact on quality of life and life expectancy, as well as job loss and poor social functioning. Last but not least, RA leads to enormous health care costs to the community.1,4
A specific cause of RA has not been identified; it appears to have many contributory factors, including genetic and environmental influences.1,5,6 The severity of the disease, its clinical course, and individual responses to treatments vary greatly. Symptoms of RA may develop within days or evolve over many weeks and months. Disease progression can be relentless or punctuated by partial or complete remission of variable and unpredictable intervals. 1
Within the past decade, the availability of novel, and more expensive, therapies for patients with RA has changed treatment beyond recognition. Awareness that earlier treatment provides superior outcomes, combined with the availability of potent biologic agents, has focused treatment aims on the induction of remission rather than controlling symptoms. 4 Even though the majority of patients benefit from biologic therapy, up to one-third have only minor, transient clinical improvement or experience no benefit at all.4,7,8 Considering the costs and the possible adverse effects, there is a need for imaging modalities with improved sensitivity that enable clinicians to carefully track the development of joint inflammation and damage as it occurs within bone and articular soft tissues and even to follow the response to therapeutic intervention. 9 This information can then be used to tailor treatment management for the individual patient. 10
Conventional methods such as clinical examination, laboratory tests, and conventional radiography are neither sensitive nor specific enough to allow detailed evaluation of synovial inflammation. 11 Indeed, many patients do not meet formal disease classification criteria early in their disease process. 1
It is evident that technological advances in conventional imaging permit an increasingly refined analysis of fine anatomic details. However, there is much work to be done in standardizing new imaging technologies (ultrasonography [US], power Doppler US, computed tomography [CT], magnetic resonance imaging [MRI]) for assessing RA and determining the pathophysiologic correlates of certain image abnormalities. 12 Beyond the optimization of spatial resolution, molecular imaging of RA is emerging. Techniques such as positron emission tomography (PET) and single-photon emission CT can reveal actively metabolizing bone and the proliferation of synovial cells via radioactive labeling. 10 Optical imaging, which uses neither ionizing radiation nor radioactive tracers, is developing as a complement to nuclear imaging methods. 13 Over the past few years, near-infrared (NIR) fluorescence imaging techniques have come to enable the in vivo imaging of physiologic, metabolic, and molecular function. 14 Given that living tissue is relatively transparent to NIR light, visualization of photon distribution and fluorescence emission from within several centimeters of tissue depth is possible.15,16 Instrumentation for optical imaging is rather inexpensive and much less complex compared with, for example, MRI or PET. Fluorescence may be excited repeatedly at any desired time and is not limited by a fast decay process, which reduces the usable time frame of some diagnostically relevant radioactive isotopes. 17
First attempts to use NIR imaging for RA detection were based on intrinsic tissue optical properties as absorption and scattering. 18 20 Later, NIR dyes were applied as contrast-enhancing media. 21 This quick and cost-effective approach is still being pursued for development for RA diagnosis. 22 In the last 5 years, the first specific fluorescent agents aiming at molecular imaging of RA have been studied in animal models, for example, visualizing protease activity 23 and apoptosis 24 or tracking macrophages.25,26
However, other key processes in RA have not been targeted so far. Synovitis is the hallmark of RA. The synovium, normally consisting of one to three cell layers, thickens dramatically, generating a heavily infiltrated fibrovascular granulation tissue called the pannus. The pannus overgrows cartilage and subchondral bone, eventually degrading them and leading to joint destruction. To sustain this rapid growth, new vasculature must develop that will support the new synoviocytes. 27 One established marker of angiogenesis is represented by an oncofetal isoform of fibronectin (FN), containing an additional domain called extra domain B (ED-B), which is inserted by alternative splicing of the FN pre-messenger ribonucleic acid. In adults, this isoform has been found to be present almost exclusively in the modified extracellular matrix surrounding newly formed blood vessels. 28 30 ED-B expression has already been detected in human pannus tissues.31,32 A novel modified single-chain anti-ED-B antibody (AP39) conjugated for NIR fluorescence imaging with tetrasulfonated carbocyanine (TSC) has already been proven successful for optical imaging of inflammatory processes in experimental arteriosclerosis. 33
The present study is aimed at the in vivo NIR fluorescence imaging of arthritic joints in the experimental rat collagen-induced arthritis (CIA) model applying the ED-B-binding fluorescent conjugate AP-39-TSC as contrast agent. We analyzed for the first time ED-B expression in inflamed joints in this model. We observed a statistically significant enhancement of fluorescence contrast in joints with moderate to severe arthritis compared with control joints.
Material and Methods
NIR-Dye-Antibody-Conjugate (AP39-TSC)
Cloning and purification of the anti-ED-B antibody have been described. 34 AP39, a derivative of the scFv antibody containing a C-terminal cysteine tag, was generated for immunohistochemistry and imaging studies. 35 This antibody was covalently linked to a TSC dye with maleimide functionality (absorption maximum 765 nm, emission maximum 790 nm), yielding defined 1:1 conjugates 33 after covalent attachment to the cysteine tag. Typically, measured dye to antibody molar ratios in the present study ranged from 0.7 to 0.9.
AP39 is a dimer owing to an intermolecular disulfide bridge. AP39 is reduced to its monomers prior to dye conjugation. The AP39-TSC conjugates spontaneously form dimers owing to associative interactions. 36
NIR-Dye-Ovalbumin-Conjugate (Ovalbumin-TSC)
A conjugate consisting of the TSC dye with carboxyl functionality and ovalbumin was synthesized through the activation of the carboxylic acid group of the dye and subsequent conjugation to the lysine residues of ovalbumin. The average of the dye to protein ratio was 0.8. This control conjugate revealed a similar molecular weight compared with the spontaneously forming AP39-TSC dimer.
Animals
Animals in this study were maintained in accordance with the Guide for the Care and Use of Laboratory Animals published by the National Institutes of Health (NIH publication NO. 85-23, revised 1996). All experiments were approved by the local animal welfare committee.
For arthritis studies we used female Lewis rats with a body weight of 150 ± 10 g on arrival (Charles River Laboratories, Sulzfeld, Germany) fed a normal diet.
For intravital microscopy, we used female (NMRI/nu/nu) mice (Tierzucht und -haltung, Schoenwalde, Germany) fed with a manganese-free diet (ssniff R/M-H, sniff Spezialdiaeten GmbH, Soest, Germany) 7 to 10 days prior to imaging experiments to reduce autofluorescence caused by a standard diet.
Animal Model
CIA was induced as described elsewhere 37 with some modifications. In brief, bovine collagen type II (collagen acid soluble from bovine nasal septum, Sigma Aldrich Chemie GmbH, Steinheim, Germany) was dissolved in 0.01 M acetic acid. Equal volumes of collagen solution and incomplete Freund adjuvant (Sigma Aldrich Chemie GmbH, Steinheim, Germany) were mixed, and a stable emulsion was made by sonication in an ice-cooled ultrasound bath at 35 kHz (Sonorex RK31, Bandelin, Berlin, Germany) for 30 minutes.
For collagen injection, the rats were immobilized with an inhalation anesthesia with 2 to 3% isoflurane (Florene, Abbott GmbH, Wiesbaden, Germany) and medical oxygen. The tail base was shaved and disinfected, and 0.5 mL of the cold emulsion was then injected intradermally in four to six sites. Small ulcers frequently formed at the injection sites. Control injections were performed in an identical manner to the collagen injections. They consisted of 0.5 mL of 0.9% NaCl, pH 7.4 (Berlin-Chemie AG, Berlin, Germany). The whole procedure was repeated for each animal 1 week later to boost the immune response.
Arthritis Evaluation
Animals were investigated daily for the onset of arthritis with respect to swelling, erythema, and functional impairment of the distal joints, in particular the tibiotarsal joints. An arthritic score was set up grading the clinical symptoms of each hind paw from 0 to 3 (0 = absence of clinical symptoms; 1 = mild arthritis with little swelling; 2 = moderate arthritis with some swelling and erythema; 3 = severe arthritis with heavy swelling, erythema, and significant functional impairment). An inflammatory arthritis usually develops explosively in 70 to 90% of rats 37 between 13 and 15 days after the first collagen injection. Animals are subjected to NIR imaging after clinical onset. No additional limbs became affected after the initial 48 hours of the disease.
Immunohistochemistry
Immunohistochemical staining was performed on frozen sections (10 μm, fixed with Tissue-Tek, Sakura Finetec, Torrance, CA) of the synovial membrane and adjacent tissues dissected from inflamed tibiotarsal joints of the CIA rats (n = 3).
Immunohistochemistry was performed as an indirect immunoperoxidase assay. ED-B was detected using biotinylated AP39 (1:50 diluted in Antibody Diluent, DAKO, Hamburg, Germany) as primary antibody. Peroxidaselabeled streptavidin (ready to use, BioGenex) was applied as a secondary system. The specificity control was performed by omission of the primary antibody.
Endothelial cells were identified using antirat endothelial cell antigen 1 (anti-RECA-1 corresponding to CD31, IQ Products, Groningen, the Netherlands; 1:30 diluted in phosphate-buffered saline [PBS]) as primary antibody. Mouse IgG1 (Zymed, Invitrogen, Karlsruhe, Germany) served as isotype control and peroxidase-labeled goat antimouse IgG (Amersham, Piscataway, NJ; 1:50 diluted in PBS) as secondary antibody.
Tissue sections were defrosted and fixed with acetone. Unspecific binding was blocked with peroxidase-blocking reagent (DAKO, Glostrup, Denmark), a biotin blocking system (DAKO), and protein-blocking reagent (DAKO). The specimens were incubated with the primary antibody for 60 minutes at room temperature, washed, incubated with the secondary system for 30 minutes, and washed, and the immunoreactivity was visualized using the DAB-Peroxidase-Substrate-Kit (DAKO). Sections were counterstained with hematoxylin (Merck KgaA, Darmstadt, Germany), dehydrated, and mounted with FluorSave aqueous mounting medium (Calbiochem, Bad Soden, Germany).
Microscopy was performed using a Zeiss Axiovert S100 with AxioCam HR and AxioVision software version 4.2 (Carl-Zeiss, Goettingen, Germany).
Intravital Microscopy
Intravital microscopy of the hairless mouse ear does not require any surgical preparations. Mice were anesthetized with ketamine (Ketavet, 60 mg/kg body weight, Pharmacia & Upjohn, Erlangen, Germany)/Rompun (12 mg/kg body weight, 2% xylazine, BayerVital GmbH, Leverkusen, Germany). Mice were positioned horizontally, and one ear was flattened on a plastic stage covered with a black neoprene mat to reduce light reflections. AP39-TSC was applied intravenously to a final dose of 200 nmol/kg body weight. NIR imaging with appropriate filter sets was performed using a fluorescence microscope (2.5× objective, AxioImager Z1, AxioVision 4.5, NIR filter set: excitation LC710ABP80-25 670–750 nm LC805ABBP70-25 780–850 nm, LaserComponents GmbH, Olching, Germany) at several time points using a halogen lamp. Imaging was performed between 0 and 30 minutes postinjection, with an image acquisition rate of 30/min (time interval 0–5 minutes) and 1/min (time interval 5–30 minutes).
NIR Fluorescence Imaging Device
An NIR laser imaging system was set up as described previously 22 with some technical improvements. The NIR dye fluorescence was excited with the help of an optical parametric oscillator (OPO; GWU-Lasertechnik, Erftstadt, Germany) based on an optically nonlinear BaB2O4 crystal, pumped by the third harmonic (λ = 355 nm, pulse energy, Epulse = 80 mJ) of a Q-switched Nd:YAG laser (GCR-230; Spectra Physics GmbH, Darmstadt, Germany, pulse 5 ns, 50 Hz). The OPO provides laser radiation tunable between 415 nm and 2.2 μm and was set to λex = 740 nm in our experiments to excite NIR fluorescence of the dyes used. Energy and duration of output pulses typically amounted to 5 mJ and 3 nanoseconds, respectively. The laser beam was coupled into a 600 μm hard cladding silica fiber. To ensure a homogeneously illuminated area of approximately 200 mm in diameter resulting in a pulse energy of 20 μJ/cm2 in the field of view of the imaging system, the fiber was bent for mode scrambling. The fiber end was placed close to the imaging optics. Two long-pass filters (λ50% = 800 nm and a 2 mm color glass filter λ50% = 780 nm) were used to cut off scattered excitation light from emitted fluorescence light. Fluorescence was imaged onto the photocathode of a water/Peltier-cooled intensified charge-coupled device (CCD) camera (PIMAX, Princeton Instruments Inc., Trenton, NJ) with the help of an objective (Objective Nikkor Al 35/1.4). To suppress background signals caused by ambient light, the intensifier of the CCD camera was gated by applying an electrical pulse (–180 V) of approximately 10-nanosecond duration derived from a high-voltage pulse generator. The high-voltage pulse generator was synchronized with an advanced trigger pulse provided by the power supply of the laser system and appropriately delayed by means of a digital delay generator. The delay of the gating pulse was adjusted to image the fluorescence of the cyanine dye (decay time, 300 ps) and suppress longer-living autofluorescence components with typical decay times of ≥ 3 nanoseconds. The camera settings to take single fluorescence images were exposure time 0.1 seconds, 16 accumulations per image, aperture 1.4 to 2.8.
Imaging Protocol
The rats were immobilized with an inhalation anesthesia with 2 to 3% isoflurane (Florene, Abbott GmbH, Wiesbaden, Germany) and medical oxygen to place a permanent venous catheter (24 GA, 0.7 × 19 nm, BD Neoflon, Becton Dickinson GmbH, Heidelberg, Germany) for dye conjugate application into a lateral tail vein (vena coccygea lateralis). During the imaging procedure, rats were anesthetized using a subcutaneously applied combination of ketamine hydrochloride (80 mg/kg body weight, Ketavet, Pharmacia & Upjohn), xylazine (5 mg/kg body weight, Rompun 2%, Bayer Vital GmbH), and diazepam (2 mg/kg body weight, Ratiopharm GmbH, Ulm, Germany). A subcutaneous application of the described combination was repeated with 50% dose to maintain the anesthesia when needed. Imaging was performed over a 24-hour period: shortly before intravenous application of the dye conjugate and 0.5, 1, 2, 3, 4, 5, 6, 7, 8, and 24 hours after dye conjugate application. Anesthetized rats were placed in the prone position and the hindlegs were extended caudally. A solid, polymeric reference containing the TSC-related NIR dye indotricarbocyanine was placed next to each animal in the top right corner.
Both ovalbumin-TSC (46,000 g/mol) and AP39-TSC (monomer 25,500 g/mol) were separately diluted in PBS (with Ca2+, Mg2+ endotoxin controlled, Biochrom, Berlin, Germany) to a final concentration of 15 μM. Ovalbumin-TSC or AP39-TSC was manually injected at a dose of 0.05 μmol/kg body weight (333 μL per 100 g body weight) with a syringe via the permanent venous catheter. On completion of the imaging, the anesthetized rats were euthanized by an intracardiac injection of 0.5 mL of T61 (Intervet Deutschland GmbH, Unterschleissheim, Germany).
Data Evaluation and Analysis
Data acquired with the imaging device were digitally stored. Four regions of interest (ROI) were encircled: the left and the right ankle joint, the nose, and the reference cube on the left side. The 95th percentile was determined as a measure of brightness for each ROI. Identically located ROI were measured on the animal tray of the imaging device to determine the background. The ratio between the signal intensity of the animal and the background was defined as fluorescence intensity (IF). All IF were normalized to the fluorescence of the reference cube (INF). Contrast was defined as the ratio between the INF of the joint and the INF of the nose.
For statistical analysis, all INF of ankle joints or contrasts for the respective animal group were averaged at each time point. In this way, the time course of mean INF or mean contrast was obtained for each group.
Statistics
Descriptive statistical tests were used to compare different groups. The significance of NIR results of different animal groups (control, score 0, score 1, score 2, and score 3) was tested using the Mann-Whitney U test. Significance was assumed at p > .05. Statistical tests were performed using SPSS version 13.0 (SPSS Inc, Chicago, IL). Boxplots were drawn using SPSS; outliers are denoted by open circles.
Tracing of the Dye Conjugates Ex Vivo
For the tracing of the dye conjugates ex vivo, rats were sacrificed 6 hours postinjection, and ankle joints were removed in toto and snap frozen in an isopentane-dry ice bath at −75°C. Nine-micrometer tissue sections were made using a cryostat (Microm HM560, Thermo Electron GmbH, Dreieich, Germany). Each section was stabilized before cutting by applying a thin film of water to the block′s surface. The sections were air-dried overnight.
Endothelial cells were identified using anti-RECA-1 as described above. Mouse IgG1 served as isotype control and Cy2-labeled donkey antimouse IgG (Jackson Immuno Research, Suffolk, ***UK; 1:50 diluted in PBS) as secondary antibody.
Cell nuclei were stained with 4′, 6-diamidino-2-phenylindole (DAPI, 1.5 μg/mL) (Invitrogen) for 5 minutes, briefly rinsed with PBS and water, and covered with FluorSave aqueous mounting medium and glass coverslips. Fluorescence of the dye conjugates, DAPI, and the Cy2-labeled antibody was visualized by fluorescence microscopy (AxioImager Z1) with appropriate filter sets.
Results
CIA in Rats as RA Model
RA was induced by intradermal injection of bovine collagen at the tail base of female Lewis rats. After 14 days, in 86% of the animals, swelling and stiffness of the tibiotarsal joints became obvious. The severity of the arthritis in the ankle joints was assessed by clinical observation and scored as mild (1), moderate (2), or severe (3) on day 15 prior to in vivo imaging. Sham-immunized animals served as controls.

Expression of ED-B in inflamed tibiotarsal joints of collagen-induced arthritis rats. Immunohistochemical staining of frozen sections (10 μm) of the dissected synovium. A, Immunohistochemical detection of ED-B using biotinylated AP39 as primary antibody. B, Comparative labeling of the blood vessels in serial sections using the endothelium-specific antibody anti-RECA-1. Immunoreactivity was visualized with diaminobenzidine turnover by horseradish peroxidase. Specimens were counterstained with hematoxylin. Sections incubated without AP39 or an isotype antibody served as the negative controls (insets). Bars indicate 100 μm.
ED-B Is Expressed in Inflamed Joints of CIA Rats
ED-B expression has already been detected in human pannus tissues31,32 but had to be evaluated in the CIA rat model. In this study, ED-B could be visualized in synovial tissue dissected from inflamed ankle joints 16 days after the first collagen injection for the first time by applying immunohistochemistry. Tube-like structures stained by biotinylated AP39 were subsequently confirmed as blood vessels by positive counterstaining with the RECA-1 in consecutive sections. RECA-1 induced a luminal signal, whereas the binding of biotinylated AP39 confirmed the abluminal localization of ED-B. Control stainings by either omitting the primary antibody or replacing it with an isotype antibody were negative (Figure 1).
AP39-TSC as the Molecular Probe for Arthritis Imaging Via ED-B Targeting
For in vivo NIR imaging of ED-B in inflamed joints, an NIR fluorescent probe was needed. The fully human ED-B binding single-chain fragment AP39 was covalently and directly linked to the TSC dye, forming the AP39-TSC conjugate. AP39-TSC has proven its sensitivity and specificity for ED-B in optical imaging of inflammatory processes in vivo in artherosclerosis only recently. 33 Ovalbumin-TSC was applied as the negative control.
AP39-TSC Shows Extravasation In Vivo
As ED-B was shown to be localized abluminally in the extracellular matrix, AP39-TSC has to penetrate the endothelial lining to reach its target. Intravital microscopy was applied to investigate if AP39-TSC, despite its molecular weight, was able to permeate the vessel wall. We used the hairless mouse ear model for this purpose. AP39-TSC was applied intravenously to a final dose of 200 nmol/kg body weight while animals were anesthetized and fixed under the microscope. The ear vessels became visible within seconds. Vessels stayed sharply contoured over the first minute. Later, the vessel linings became diffuse and the periphery showed increasing fluorescence (Figure 2), indicating the extravasation of AP39-TSC. Only minor fluorescence could be detected in the tissue a few hours later.
AP39-TSC Accumulates in Inflamed Rat Joints In Vivo
Twenty-two female rats were injected with collagen and randomly assigned to one of two imaging groups, AP39-TSC or ovalbumin-TSC. Eighty-six percent of them responded positively to the collagen injections. Only tibiotarsal joints were considered for imaging. Some of the animals developed clinical symptoms in only one joint and some in both joints, often with unequal severity. AP39-TSC and ovalbumin-TSC were intravenously applied to a final dose of 50 nmol/kg body weight. The conjugates were excited by laser light, and the emitted fluorescence was detected using an intensified CCD camera. While the anesthetized rats were lying in the ventral position, whole-body images were taken at several time points. A sequence of representative fluorescence images is shown (Figure 3). Bright fluorescence at the tail base is due to intradermal collagen injection provoking local inflammation. Slight fluorescence of the eyes originates from the fluorescent eye drops, instilled prior to imaging to avoid dehydration of the cornea during anesthesia (Regepithel, Alcon Pharma GmbH, Germany). The intense signal in the upper right panel of Figure 3 and the smaller sharp fluorescence spots in the image are due to rarely occurring contamination by urine-containing dye.

Intravital microscopy of blood vessels in a mouse ear after intravenous injection of AP39-TSC (200 nmol/kg body weight). Nearinfrared fluorescence was observed over a period of 7 hours. For comparability, all images were taken with the same exposure time.
In Figure 3, both animals exhibited one moderate arthritic and one asymptomatic ankle joint each (by clinical scoring). By visual inspection of these images, a clear discrimination between the asymptomatic and the inflamed joint is possible between 3 and 8 hours after injection of AP39-TSC, which does not apply for ovalbumin-TSC.
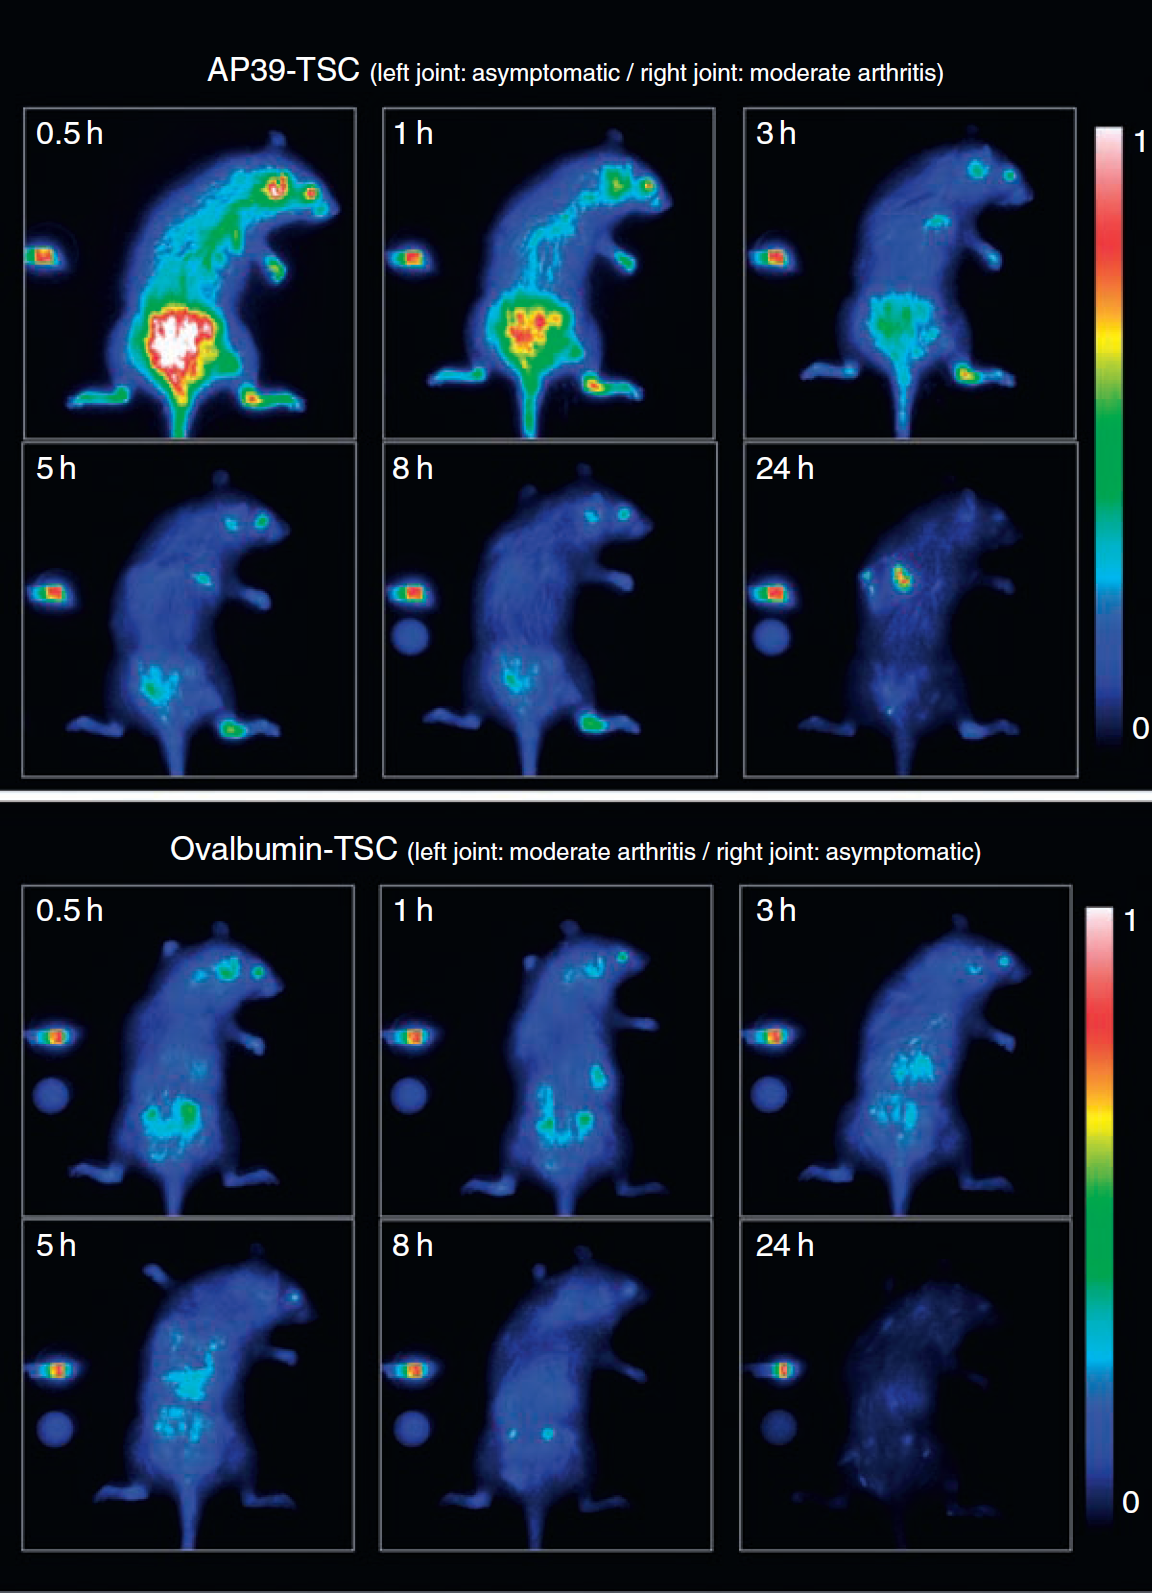
In vivo whole-body near-infrared images of collagen-induced arthritis rats. AP39-TSC or ovalbumin-TSC was intravenously applied to a final dose of 50 nmol/kg body weight. Images were taken at several time points after dye conjugate application. For comparison, animals with one moderate arthritic and one asymptomatic ankle joint each (by clinical scoring) were chosen as representatives for the respective dye conjugate. On the left side, the reference cube is visible. Bright fluorescence at the tail base is due to the intradermal collagen injection causing local inflammation.
Fluorescence contrasts, defined as the ratios between the normalized fluorescence intensity of each joint and the reference tissue (nose), served as the basis for statistical analysis. Asymptomatic joints of CIA rats were excluded from the analysis owing to their unknown disease status. Six animals that only received NaCl injections (one died) served as controls. None of these developed any arthritic symptom. The imaging data of the joints with severe and moderate arthritis (scores 2 and 3) were pooled to reach an appropriate group size for statistical tests.
Eventually, the AP39-TSC group included 17 joints (6 controls, 2 mild arthritis, 9 moderate to severe arthritis) and the ovalbumin-TSC group included 15 joints (4 controls, 5 mild arthritis, 6 moderate to severe arthritis).
In Vivo NIR Imaging Using AP39-TSC Allows for the Differentiation of Moderate to Severe Arthritic Joints from Healthy Joints
AP39-TSC-induced fluorescence contrast in moderate to severe arthritic joints differed significantly (p > .001) from healthy control joints in the CIA rat model up to 8 hours after intravenous injection. Joints with mild clinical signs could not be discriminated from healthy control joints but could be discriminated from the moderate to severe group up to 8 hours after injection (p > .05). With ovalbumin-TSC, only a minor fluorescence contrast could be induced in affected joints. It is thus likely that the enhanced fluorescence contrast in inflamed joints is mainly due to the specific binding of AP39-TSC to its target ED-B (Figure 4).
AP39-TSC Is Eliminated Faster from Control Tissues than Ovalbumin-TSC
The decline of the fluorescence intensity in the highly vascularized nose tissue was recorded over a time period of 8 hours. This decay reflects the elimination kinetics of the respective conjugate from blood. AP39-TSC revealed a faster drop in fluorescence intensity compared with ovalbumin-TSC. Hence, an AP39-TSC accumulation in inflamed joints owing to blood pool effects seems implausible (Figure 5).
AP39-TSC Could Be Localized in the Inflamed Synovium of Arthritic Joints Ex Vivo
Cryosections of inflamed rat joints were evaluated under the fluorescence microscope 6 hours after the injection of AP39-TSC and ovalbumin-TSC. Vascularization of the pannus tissue could be clearly visualized by counterstaining with the Cy2-labeled anti-RECA-1. DAPI was used to label cell nuclei. AP39-TSC was easily traced within the joint, whereas ovalbumin-TSC could not be detected (Figure 6). Neither AP39-TSC nor ovalbumin-TSC fluorescence could be detected in control joints (data not shown). AP39-TSC fluorescence was restricted to inflamed tissue and showed a more stromal pattern in the highly vascularized pannus than RECA-1. The same expression pattern of ED-B in human joint tissue was described by Berndt and colleagues. 31
Discussion
The experimental data presented here indicate that molecular imaging is suitable for visualizing angiogenesis in arthritic ankle joints of CIA rats under in vivo conditions using AP39-TSC as an ED-B binding probe. AP39-TSC-induced fluorescence contrasts in moderate to severe arthritic joints differed significantly (p > .001) from those in healthy control joints in the CIA rat model up to 8 hours after intravenous injection. Joints with mild clinical signs could not be discriminated from healthy control joints but could be discriminated from the moderate to severe group (p > .05).

Time course of the fluorescence contrast of the different animal groups related to the applied dye conjugate and the arthritis score depicted as boxplots. Contrast was defined as the ratio between the normalized fluorescence intensity (INF) of the joint and the control tissue. Outliers are denoted by open circles or crosses.
The CIA rat model is well accepted in the literature to correspond in many aspects to the human RA pathology. 37 39 The autoimmune response has been characterized in detail, and the model has become very useful in a number of areas, giving it the flexibility to be used both as a tool for unraveling the pathogenic mechanisms that drive the autoimmune response und tissue destruction in the joint and as a vehicle for testing novel therapeutics to treat autoimmunity and inflammation. 40 CIA animals show proliferation of synoviocytes and fibroblasts, resulting in synovial hypertrophy and fibrosis secondarily destroying articular cartilage and bone. 37

Time course of the normalized fluorescence intensities (INF) of the respective dye conjugates in the nose tissue, reflecting elimination kinetics. Data were normalized to the maxima of the fitted curves.
To assess the condition of our CIA rats, we set up a clinical arthritis scoring system. In a previous study, this clinical scoring system has been applied to the joints of CIA rats and the respective healthy controls, and the results were confirmed to highly correlate with the histologic scores derived from the murine histopathologic scoring system published by Fischer, 22 which is based on Krenn and colleagues (data not shown). 41 All of the animals of one group were imaged on the same day with the same imaging conjugate batch to ensure reproducibility. The severity of the induced acute joint inflammation cannot be predicted as it develops individually and often progresses quickly. Hence, for statistical reasons, the imaging data of joints with severe or moderate arthritis (score 2 or 3) had to be pooled.
Ovalbumin-TSC was suited as the control as it did not accumulate nonspecifically in the inflamed joints, as opposed to human serum albumin, for which increased permeability in arthritic joints 42 and metabolization in synovial fibroblasts have already been described. 43
ED-B imaging was not effective for the diagnosis of mild arthritis in this model. Even if CIA in many aspects refers to the human pathology, one difference is the rapid progression in rats.37,44 There is a medical need for early RA diagnosis in humans. Hence, “early” does not necessarily mean “mild.” Angiogenesis might not be the first symptom in the pathogenesis of RA but evidently precedes cartilage and bone erosion21,45,46 (detectable by conventional radiography) and contributes to contrast media accumulation used in MRI. Thus, optical ED-B imaging has the potential to be effective as early as MRI in RA diagnostics.

Ex vivo tracing of AP39-TSC and ovalbumin-TSC in arthritic joint sections 6 hours after injection. AP39-TSC and ovalbumin-TSC fluorescence is displayed in red. Nuclei were counterstained with DAPI (blue), and endothelial cells were identified using an anti-RECA-1 antibody detected with a Cy2-labeled secondary antibody (green). Representative section (9 μm) of a severely arthritic tibiotarsal joint. Bones and pannus tissue are clearly visible (A). Anti-RECA staining detects the vasculature in the pannus (B). In a consecutive slice, ovalbumin-TSC could not be detected ex vivo (D), whereas AP39-TSC was easily traced in the pannus (F). Nuclei were counterstained with DAPI (C and E). Bars indicate 100 μm.
The pattern of RA disease activity varies considerably between patients. Disease activity can be persistent, but exacerbations and periods of low disease activity or even remission can also occur. The traditional view of RA is that RA causes inflammation, which in turn causes joint damage. A body of evidence from a variety of sources, including controlled trials of different treatment regimens, points to at least two pathologies working simultaneously in the joint, one leading to inflammation and the other leading to direct joint destruction in an uncoupled way. In 15% of patients with persistent remission, an erosion developed in a previously unaffected joint.47,48 Moreover, the different disease processes and the genetic risk factors might differentially influence the development and persistence of RA and the therapeutic response of each individual patient. 6 Consistently, a variety of therapeutic targets are under evaluation: fibroblast growth factor 1, interleukin-17, αvβ3-integrin, vascular endothelial growth factor receptor 1, cadherin-11 and macrophage inflammatory protein 1.49,50 Only 2% of patients with RA are currently on tumor necrosis factor (TNF) inhibitors, opening a potential for substantial future increases. Costs for TNF therapy are estimated at approximately $ 15,000 per annum each. 1 Up to one-third of RA patients do not benefit satisfyingly from TNF blockers,4,7,8 but potential benefit for patients switching from any one of the TNF-inhibitors to another has been demonstrated. 51
The ability to image a specific biologic target in vivo will inevitably become a part of clinical diagnostics, patient selection prior to therapy, and subsequent response evaluation. 46 Angiogenesis imaging using NIR fluorescent AP39-TSC, a fully human, nonradioactive, ED-B-specific, injectable in vivo probe, might make a contribution to this field. Potential anatomic target structures are the joints of the hand and foot, which can be easily imaged with the herein described NIR imaging technique, providing a penetration depth of at least 3 cm. Repeated use for therapy response monitoring or patient stratification seems promising.
Footnotes
Acknowledgments
We thank the excellent technical contribution of Christine Morgenroth, Astrid Knop, Robert Ivkic, and Alfred Walter.
Financial disclosure of authors: This project was supported by the Investitionsbank Berlin IBB, cofinanced by the European Regional Development Fund.
Financial disclosure of reviewers: None reported.