
Abstract
For clinical application of stem cell–based therapies, noninvasive detection of applied stem cells is of high importance. We report on the feasibility of detecting implanted neural progenitor cells (NPCs) noninvasively and follow their fate and functional status by sequential multimodal molecular imaging and reporter gene technology. We investigated C17.2 cells stably expressing herpes simplex virus type 1–thymidine kinase (HSV-1-tk) and green fluorescent protein (gfp) (C17.2-tkIRESgfp = C17.2-TIG) or HSV-1-tk, gfp, and firefly luciferase (luc) (C17.2-lucIREStkgfp = C17.2-LITG) and determined the detection sensitivity of positron emission tomography (PET) and bioluminescence imaging (BLI) for these cells in culture and in vivo in subcutaneous and intracranial glioma models. In addition, PET and BLI were used to further investigate and follow the fate of implanted C17.2-LITG cells in an intracranial glioma model. We show that both imaging modalities are sensitive in detecting reporter gene expressing NPCs; however, PET, by the use of 9-[4-[18F]fluoro-3-hydroxymethyl)butyl]guanine ([18F]FHBG), detects NPCs only at sites of disrupted blood-brain barrier. Furthermore, both imaging modalities can be used to detect stem cell fate and migration and indicate excessive proliferation and aberrant migration. In conclusion, multimodal imaging can be used for longitudinal noninvasive monitoring of grafted NPCs in rodents.
OVER THE PAST DECADE, extensive progress in stem cell research has led to the development of a large number of promising therapeutic approaches for various diseases. Transplantation of neural stem cells into damaged or degenerated brain, for instance, offers the possibility to treat Parkinson disease, 1 Alzheimer disease, 2 and Huntington disease, 3 traumatic brain injury,4,5 spinal cord injury,6,7 stroke,8–10 and multiple sclerosis. 11 To treat neurodegenerative diseases, pluripotent stem cells serve, theoretically, as a renewable source for the replacement of cells and tissues and as vehicles to deliver bioactive molecules into tissue. The latter approach may also be of interest for the treatment of brain tumors.
Useful molecules for stem cell–mediated delivery are growth factors (eg, glial cell line–derived neurotrophic factor 12 ), cytokines (eg, interleukins [IL]-413 and IL-1214), and oncolytic or antineoplastic proteins (such as viral thymidine kinase, 15 bacterial cytosine deaminase,16,17 or tumor necrosis factor–related apoptosis-inducing ligand 18 ). Both cell replacement approaches and supply of therapeutically active substances are based on the exceptional migratory capability of neural stem or progenitor cells.19–22 The capability of stem cells to migrate to sites of cerebral pathology was first demonstrated for intracranial gliomas 16 and was later also found in the setting of stroke21,23 and other central nervous system (CNS) pathologies.4,24,25
The success of stem cell–based therapeutic constructs also depends on targeted migration and on their functionality within the target tissue over a prolonged period of time. Continuous noninvasive monitoring of the efficacy of cell-based therapies, which is of great clinical importance, should therefore cover both aspects: visualization and quantification of cell migration and functional cell status. Recent studies have used either bioluminescence imaging (BLI)18,20 or magnetic resonance imaging (MRI)21,26,27 for tracking of implanted stem cells. The transfer of results into the clinical routine based on bioluminescence is restricted by the fact that this imaging modality cannot be applied in patients owing to low tissue penetration of the optical signal, whereas data gained with MRI lack information on the functional status of implanted cells.
The first aim of the current study was to directly compare the sensitivity of positron emission tomography (PET) and BLI for the detection of transplanted cells in vivo and to follow the migration and fate of implanted neural progenitor cells (NPCs) noninvasively in vivo by means of sequential multimodal imaging. The second aim was to use a setting for repeated noninvasive imaging that can be, at least in part, transferred into clinical application. For the in vivo experiments, we used a model murine NPC line (C17.2 cell line), a human glioblastoma cell line (human Gli36dEGFR glioma cells) known to form microsatellite lesions, and a triple reporter gene construct allowing for simultaneous optical fluorescence (green fluorescent protein [gfp]), bioluminescence (firefly luciferase [luc]), and radionuclide imaging (herpes simplex virus type 1–thymidine kinase [HSV-1-tk]).
Materials and Methods
Vector Production and Viral Transduction
Generation of pBABE-LITG
The generation of pBABE-TIG has been described. 28 The generation of pBABE-LITG is based on the construct pBABE-CITG (cytosine deaminase-IRES-tk39gly5gfp), which was generated by transferring the expression cassette CITG from herpes simplex virus amplicon (pHSV)-CITG 28 into pBABE-puromycin. Thereafter, the luciferase gene, including a 5′ 29 bp extension for advanced promoter recognition (Kozak sequence), was amplified by polymerase chain reaction (PCR) out of pTA-luc (Takara Bio Europe/Clontech, Saint-Germain-en-Laye, France), generating 5′ XhoI and 3′ BglII restriction sites, respectively. This PCR product was ligated to a pBABE-ITG (IRES-tkgfp) backbone, generated by XhoI/BglII digestion of pBABE-CITG.
Generation of C17.2-TIG and -LITG Cells
Retroviral packaging was performed as described. 28 In brief, Phoenix cells (Nolan Lab, Stanford, CA) were seeded (2 × 10⁶ cells/well) in 3 mL of medium (10% fetal bovine serum [FBS, Gibco/Invitrogen, Karlsruhe, Germany] and 100 U/mL of penicillin and 100 mg/mL of streptomycin [1% P/S; PAA, Cölbe, Germany]). After 24 hours, chloroquine (Sigma, Taufkirchen, Germany) was added to each well (25 μM). This mixture was incubated for 5 minutes, followed by addition of 1 mL deoxyribonucleic acid (DNA) mix containing 10 μg pBABE-TIG or pBABE-LITG plasmid DNA and 120 mM CaCl2 in HEPES-buffered saline (HBS) buffer (pH 7). The cells were incubated for 7 hours at 37°C before the medium was replaced with Dulbecco's Modified Eagle's Medium (DMEM) (10% FBS, 1% P/S), with subsequent incubation for 48 hours at 34°C. Thereafter, retroviral particles were formed, and, after centrifugation and removal of cellular debris, the medium served as an infection medium. C17.2 cells were seeded (4 × 10⁵/well in a six-well plate) in 4 mL of DMEM containing 10% FBS and 1% P/S. After 24 hours, 2 mL of medium was removed and 3 μL of polybrene (5 mg/mL; Sigma) was added to each well, followed by addition of 1 mL of infection medium. Cultures were grown for 24 hours, the medium was exchanged, and cell culture was continued with fresh medium containing selection antibiotics (neomycin, puromycin).
Cell Culture
Human Gli36dEGFR glioma cells were kindly provided by Dr. David Louis (Molecular Neurooncology Laboratory, Massachusetts General Hospital, Boston, MA). This cell line was established by retroviral transfer of a mutant epidermal growth factor receptor (D2-7EGFR) into the Gli36 human glioma cell line, enhancing its tumorigenic capacity. 29 Mouse neonatal C17.2 NPCs, stably transfected with the lacZ gene and the neomycin resistance gene, were kindly provided by Dr. Evan Snyder (Harvard Medical School, Boston, MA). Gli36dEGFR, Gli36dEGFR-TG17 (Gli36dEGFR cells stably expressing a fusion protein of HSV-1-tk and GFP), 28 and C17.2-TIG and C17.2-LITG cells were grown as monolayers in DMEM supplemented with 10% FBS and 1% P/S at 37°C in a 5% CO2/95% air atmosphere. The cell culture for human Gli36dEGFR glioma cells contained puromycin (2 μg/mL) (Sigma); the cell cultures for Gli36dEGFR-TG17, C17.2-TIG, and C17.2-LITG cells contained puromycin and neomycin (G418; PAA) (2 μg/mL, 500 μg/mL, respectively).
For MRI cell-tracking experiments, C17.2 cells were labeled with the iron oxide particles Sinerem (a generous gift from Guerbet, France) or Endorem (Guerbet). For this purpose, cells were either labeled after 15 μg/mL of SINEREM were mixed with 8 μL of Metafectene (a generous gift from Biontex Laboratories GmbH, Martinsried, Germany) according to Hoehn and colleagues 21 or by coincubation with 100 μL of Endorem per milliliter of medium. Coincubation in the culture medium was performed for 12 to 16 hours. Finally, cells were washed three times with phosphate buffered saline (PBS) before implantation.
Bioluminescence Assay in Culture
The IVIS Imaging System 200 series (Xenogen, Alameda, CA) was used for BLI acquisition. Serial dilutions of C17.2-LITG NPCs (10–10,000 cells/100 μL/well) were seeded into 96-well tissue culture plates.
PET Measurement of Cell Pellets
PET measurements were performed on a microPET R4 scanner (Concorde Microsystems, Knoxville, TN; 63 image planes, 2.0 mm full width at half maximum [FWHM]). For determination of the cell detection limit of the microPET, serial dilutions of C17.2-TIG NPCs (1 × 10³, 5 × 10³, 1 × 10⁴, 5 × 10⁴, 1 × 10⁵, 5 × 10⁵, 1 × 10⁶, 2 × 10⁶) were incubated with 170 μCi [18F]FHBG for 30 minutes. Afterward, cells were washed twice with PBS and resuspended in 100 μL of PBS. Seventy minutes later, a 10-minute PET measurement of vials containing the [18F]FHBG-labeled C17-TIG cells was performed. To allow image coregistration and data evaluation, VINCI, a new graphic image analysis tool developed in-house, was used, allowing for fast automated coregistration of multimodal imaging data. 30 To obtain the activity in the vial from the PET measurement, a volume of interest was drawn containing the entire vial and the total activity in the volume was calculated.
Cell Transplantations
Animal procedures were in accordance with the German Laws for Animal Protection and were approved by the local animal care committee and the local governmental body (Bezirksregierung Köln).
All surgical procedures were performed on spontaneously breathing male nude mice (HsdCpb:NMRI-Foxn1nu, Harlan-Winkelmann, Borchen, Germany) or male nude rats (Hsd:RH-Foxn1rnu, Harlan-Winkelmann, Borchen, Germany) and anesthetized by intraperitoneal injection with ketamine (85 mg/kg body weight; Ketavet, Pharmacia & Upjohn, Kalamazoo, MI) and xylazine (15 mg/kg body weight; Rompun, Bayer AG, Leverkusen, Germany). Furthermore, for intracranial injections, animals were fixed in a stereotactic frame (Model 900 small animal stereotaxic, David Kopf Instruments, Tujunga, CA). To determine the in vivo detection sensitivity of microPET for NPCs, C17.2-TIG cells (1 × 10⁴, 1 × 10⁵, 1 × 10⁶, or 1 × 10⁷ cells) or Gli36dEGFR-TG17 cells (1 × 10⁵, 1 × 10⁶, or 1 × 10⁷ cells) were injected into preestablished subcutaneous or intracranial Gli36dEGFR gliomas. Glioma growth was initiated by injection of 5 × 10⁶ Gli36dEGFR cells subcutaneously at the level of the shoulders (three to four tumors per animal) or 1 × 10⁵ cells intracranially at the level of the striatum.
For cell migration experiments, 1 × 10⁵ Gli36dEGFR glioma cells were delivered into the right striatum and 2 × 10⁵ C17.2-LITG cells into the left hemisphere. For coinjection experiments, 5 × 10⁵ C17.2-LITG cells were mixed with 1 × 10⁵ Gli36dEGFR cells and injected into the right striatum or 1 × 10⁵ Gli36dEGFR cells were injected into the right striatum and 5 × 10⁵ C17.2-LITG cells were injected at the same coordinates 7 days later. Cells were suspended in DMEM, and for subcutaneous injections, 50 μL of the cell suspension was injected through a 30-gauge needle (Becton Dickinson SA, Fraga, Spain) mounted on a 1 mL syringe (Terumo Europe, Leuven, Belgium); for intracranial injections, 2 μL of the cell suspension was injected through a 26-gauge 10 μL microsyringe (Hamilton, Reno, NV). Striatal coordinates were the following: anterioposterior 0 mm, mediolateral ± 2.5 mm, ventral 3 mm. All coordinates were selected relative to bregma and ventral coordinates relative to dura.
Radiosynthesis of [124 I]FIAU and [18F]FHBG
The specific marker substrates for HSV-1-tk 2′-fluoro-2′-deoxy-1β-
Multimodal Imaging
Bioluminescence Imaging
Bioluminescence acquisition and analysis were performed with the IVIS Imaging System 200 series and Living Image V2.50.1 software. Animals were injected intraperitoneally with
Positron Emission Tomography
PET was performed using a microPET R4 scanner (Concorde Microsystems, Knoxville, TN; 63 image planes, 2.0 mm FWHM) as described.28,32 Tracer injection and image acquisition were performed on spontaneously breathing animals anesthetized with halothane (1.5%) in O2:N2O (35:65%). No tracer injection was performed when [124I]FIAU-prelabeled cells were used. Radiotracer (no-carrier-added [18F]FHBG, 300 μCi/rat, 200 μCi/mice, respectively) was administered intravenously into the tail vein. Temperature was maintained at 37°C and monitored throughout the PET measurements. Mice emission scans were obtained 5 minutes (10-minute duration) and 150 minutes (30-minute duration) after tracer injection. Early scans (after 5-minute tracer incubation) were used for coregistration and late scans (after 150-minute tracer incubation) for detection of specific tracer accumulation. Rat emission scans were obtained 150 minutes (30-minute duration) after tracer injection. Images were reconstructed using Fourier rebinning and two-dimensional filtered backprojection (microPET). For quantification of images, a reference standard sample of radiotracer was placed within the field of view of the PET scanner. To allow image coregistration and data evaluation, VINCI was used. Data evaluation was based on a ROI analysis of PET images to determine maximal radioactivity concentrations within tumors. After background subtraction (contralateral hemisphere for intracranial experiments or mediastinum for subcutaneous experiments), data were decay corrected and divided by the total injected dose (ID) to represent the percentage of ID per gram (%ID/g).
Magnetic Resonance Imaging
Localization of tumor growth was performed by MRI after intraperitoneal administration of approximately 70 μL gadolinium–diethylenetriamine pentaacetic acid (Gd-DTPA) (500 mM; Magnevist, Schering, Berlin, Germany). Animals were anesthetized using 1.5% halothane in O2:N2O (35:65%). Temperature was maintained at 37°C and monitored throughout the MRI measurements. All MRIs were acquired using a Biospec 7.0 T small animal scanner (Bruker BioSpin, Ettlingen, Germany; horizontal bore, 30 cm) equipped with actively shielded gradients (200 mT m-1). Purpose-built radiofrequency coils were used (12 cm Helmholtz coils for excitation and a 2.5 cm surface coil for detection). Following two-dimensional localization scans, three-dimensional gradient-echo scans (FLASH) with T1 weighting were acquired. The acquisition parameters were as follows: spatial resolution 70 × 167 × 156 μm3, field of view 18 × 16 × 10 mm3, repetition time (TR) = 70 ms, echo time (TE) = 5 ms, flip angle 60°. Images were processed using Paravision 3.2 (Bruker Biospin). The total experimental time was 30 to 40 minutes per MRI study. Coregistration of MRIs with respective PET images was performed using VINCI.
For MRI cell-tracking experiments, three-dimensional T2*-weighted MRIs were acquired as above using the following parameters: FLASH sequence, spatial resolution 80 × 80 × 80 μm3, TR = 200 ms, TE = 20 ms, flip angle 30°.
Immunostaining
For immunostaining, 2 × 10⁵ cells were seeded on coverslips placed in 24 wells and incubated for 24 hours in DMEM (10% FBS, 1% P/S). The following day, cells were washed with PBS (3 × 5 minutes), fixed with paraformaldehyde (4%, 20 minutes), and washed again with PBS (3 × 5 minutes). Cells were permeabilized with Triton X-100 (0.2%) in PBS (3 minutes) and washed again with PBS (3 × 5 minutes). Unspecific binding of antibodies was prevented by blocking cells with bovine serum albumin (BSA) (3%, 60 minutes). Thereafter, cells were washed with PBS/0.3% BSA (3 × 5 minutes), followed by a 90-minute incubation with the first antibody in PBS/0.3% BSA. After washing the cells again for 5 × 5 minutes with PBS/0.3% BSA, the second antibody was added in PBS/0.3% BSA. Cells were washed with PBS (5×) and bidest (1×), and then coverslips were removed from 24 wells, put on glass slides, and sealed using Citifluor (Citifluor Mountant Medium, Citifluor, Leicester, UK). The antibodies used were rabbit anti–chemokine receptor 4 (anti-CXCR4) (Abcam plc, Cambridge, UK) and rabbit antinestin (Chemicon, Temecula, CA). The secondary antibody was Cy3/fluorescein isothicyanate–coupled goat-antirabbit (Amersham, GE Healthcare Europe GmbH, Munich, Germany).
Histology and Image Validation
Animals were sacrificed by transcardial perfusion with 4% paraformaldehyde at the time point of neurologic impairment for the migration studies or after completion of the imaging protocol for the detection sensitivity studies. Brains were removed, suspended in 30% sucrose for 3 days, and snap-frozen in 2-methylbutane chilled on dry ice. Cryostat sections (12 μm) were stained with hematoxylin and eosin (Merck, Darmstadt, Germany) and X-Gal (Sigma-Aldrich, Munich, Germany) to identify lac-Z-expressing NPCs as described. 33
Experimental Protocol
In Vivo Detection Sensitivity of Micro PET for NPCs
In the first set of experiments (nude rats; n = 4), [124I]FIAU-prelabeled C17.2-TIG cells (1 × 10⁴, 1 × 10⁵, 1 × 10⁶ cells) were injected into 11-day-old subcutaneous gliomas (Figure 1A). These concentrations corresponded to 1.33, 11.82, and 108.82 μCi of radioactivity, respectively. Injection of DMEM served as negative control. During the following 7 days, serial PET measurements were performed to detect the level of FIAU-derived signal.
In a second set of experiments (nude mice; n = 6), C17.2-TIG cells (subcutaneous: 1 × 10⁵, 1 × 10⁶, 1 × 10⁷; intracranial: 1 × 10⁵ cells) or cells of the positive control cell line Gli36dEGFR-TG17-R4 (subcutaneous: 1 × 10⁵, 1 × 10⁶, 1 × 10⁷; intracranial: 1 × 10⁵ cells) were injected into preestablished 10-day-old subcutaneous or 5-day-old intracranial gliomas. Injection of DMEM served as negative control (Figure 1B). 18F-FHBG-PET measurements (300 μCi [18F]FHBG/animal) 24 and 48 hours after stem cell injection were performed to detect the localization and intensity of the TK signal.
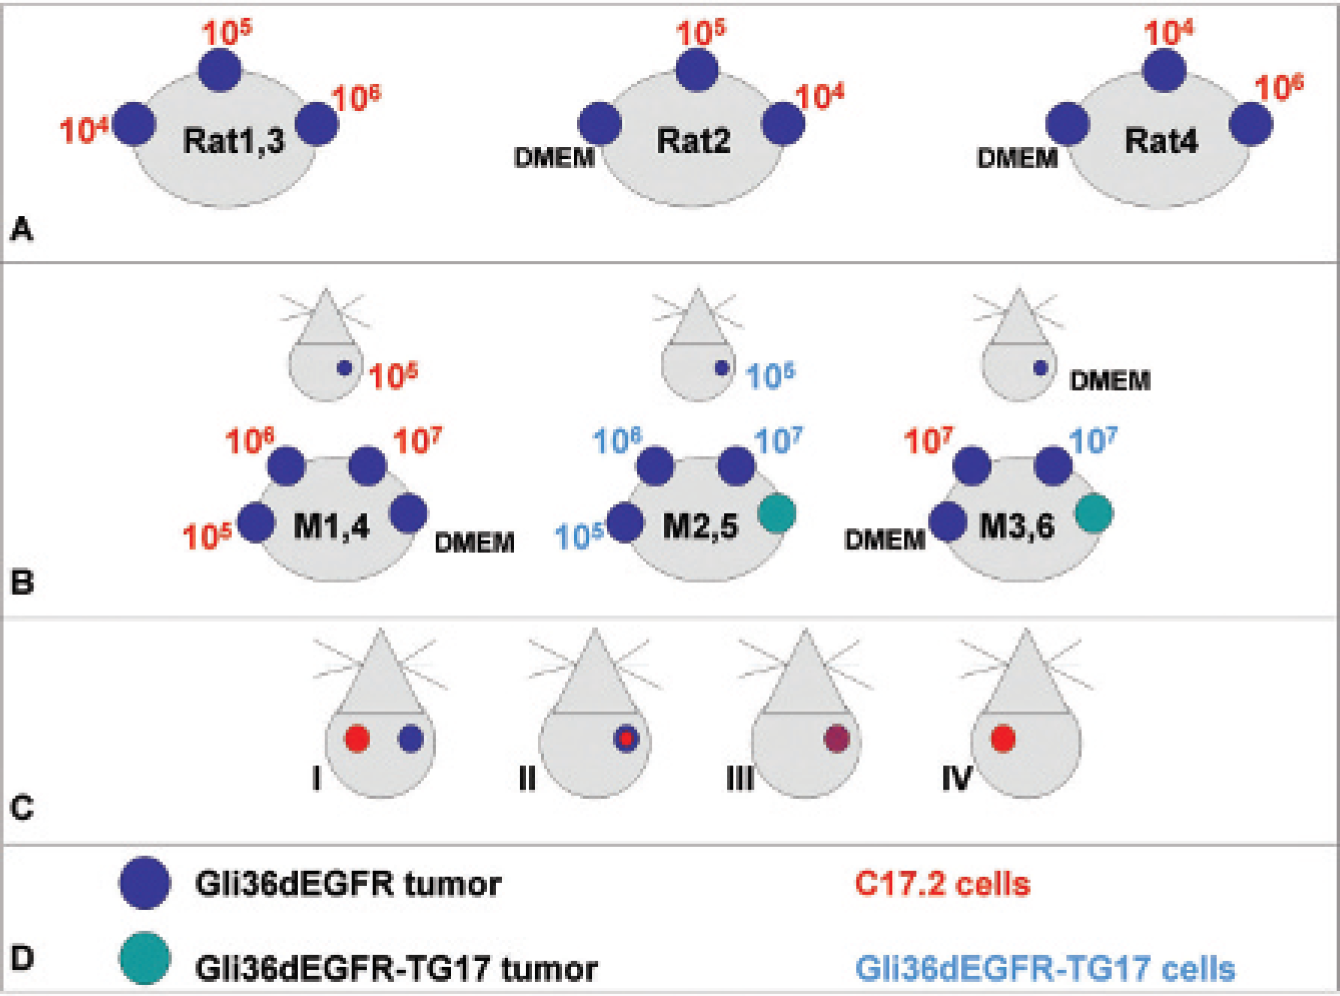
Implantation scheme of in vivo experiments. A, Implantation scheme of [124I]FIAU-prelabeled C17.2-TIG cells or Dulbecco's Modified Eagle's Medium (DMEM) injected intro pre-established subcutaneous Gli36dGEFR gliomas in four rats. B, Implantation scheme of C17.2-TIG cells, Gli36dEGFR-TG17 cells, or DMEM into pre-established subcutaneous or intracranial Gli36dEGFR gliomas in six mice. C, Implantation scheme of C17.2-LITG cells into mouse striatum: I, bihemispheric injection; II, intratumoral injection; III, mixed injection; IV, control injection. D, Figure legend.
Multimodal Imaging of NPCs in an Intracranial Glioma Model
In the third set of experiments, C17.2-LITG cells were inoculated into the left striatum of nude mice (n = 5; Figure 1C, I), and their migrational capacity toward the contralateral tumor-bearing hemisphere was monitored by serial BLI and [18F]FHBG-PET measurements. In three of these animals, the glioma cell injections (Gli36dEGFR cells) into the right striatum were performed on the same day as the stem cell injections, and in two of these animals, glioma cells were first allowed to proliferate for 1 week, and then the stem cells were inoculated (see Figure 1C, I). In two animals, C17.2-LITG cells were implanted into preestablished gliomas (Figure 1C, II), and in four animals, C17.2-LITG cells were mixed and coimplanted together with Gli36dEGFR cells (Figure 1C, III) (see below). In control animals (n = 2), only injection of C17.2-LITG cells in the left striatum was performed (Figure 1C, IV). Bioluminescence measurements were performed within 48 hours after stem cell inoculation and thereafter at 2- to 3-day intervals. PET measurements were performed at days 0, 16, and 22 after stem cell inoculation. To verify tumor growth, MRIs were acquired between day 6 and day 20 after tumor cell inoculation.
To our knowledge, detection of neural stem cells (NSCs) in the CNS with [18F]FHBG-PET has not been addressed in previous studies. For the current study, we hypothesized that only at the site of glioma proliferation, where intrinsic tumor-induced opening of the BBB takes place, would it be possible to detect HSV-tk-tk+ NPC cells by means of [18F]FHBG-PET. Therefore, in the fourth set of experiments, we injected C17.2-LITG cells into preestablished gliomas (n = 2; see Figure 1C, II) or as a mixture together with glioma cells (n = 4; see Figure 1C, III) and monitored their behavior over time with BLI and [18F]FHBG-PET. MRI experiments after Gd-DTPA administration were performed for evaluating the integrity of the BBB.
In an independent set of animals (n = 6), iron oxide–labeled C17.2 cells were injected into the left striatum and glioma cells into the right striatum and NPC migration was monitored with MRI.
Results
Characterization of Transduced NPCs in Culture
Stably transduced NPCs (C17.2-TIG and C17.2-LITG) were compared with the parental cell line (C17.2) regarding growth behavior, cell morphology, and the expression pattern of nestin as a specific progenitor cell marker and CXCR4, an alpha-chemokine receptor specific for stromal cell–derived factor 1 (SDF-1), as a marker for migration. No significant differences were found in cultured cells with regard to growth characteristics and morphology up to passage numbers used for implantation (< 40). When analyzing higher passage numbers (> 60), CXCR4 staining significantly decreased in C17.2-LITG cells (data not shown).
Detection Sensitivity of MicroPET for NPCs Expressing Viral Thymidine Kinase in Cell Culture
The microPET detection sensitivity for C17.2-TIG cells prelabeled with [18F]FHBG was analyzed by measuring cell numbers ranging from 1 × 10³ to 2 × 10⁶. Figure 2A shows the correlation between cell numbers and PET signal intensity displayed as counts/min (cpm) and the corresponding PET image, indicating that approximately 5 × 10³ cells can be visualized when located in a certain volume of interest (100 μL).
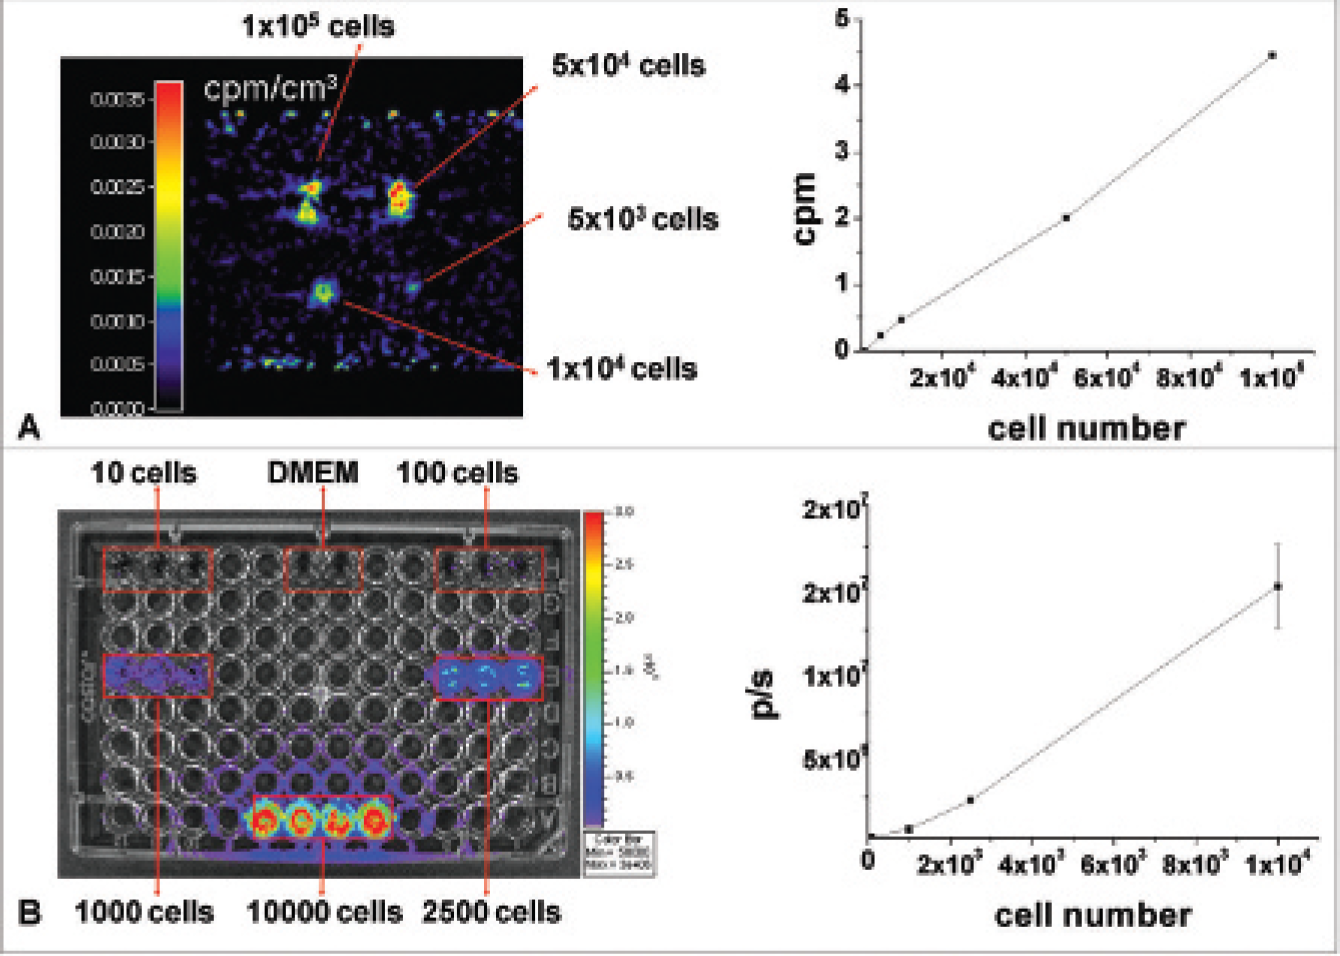
Characterization of transduced neural progenitor cells in vitro. A, MicroPET image of vials containing different concentrations of [18F]FHBG-labeled C17.2-TIG cells (left panel) and the corresponding graph demonstrating the linear correlation between [18F]FHBG-labeled C17.2-TIG cell number and PET signal (right panel). B, Bioluminescence image of different concentrations of C17.2-LITG cells in a 96-well tissue culture plate after the addition of
Detection Sensitivity of BLI for NPCs Expressing Firefly Luciferase in Cell Culture
To determine the detection limit of the IVIS Imaging System 200 series for our model, the NPC cell line expressing firefly luciferase (C17.2-LITG), with cell numbers ranging from 10 to 1 × 10⁴, was investigated in triplicate. Figure 2B demonstrates the relationship between cell number and bioluminescence signal, indicating that as few as 100 cells can be detected by the IVIS 200 system.
Detection Sensitivity of MicroPET for NPCs Expressing Viral Thymidine Kinase In Vivo
In the first set of experiments, [124I]FIAU-prelabeled C17.2-TIG cells were injected into subcutaneous growing gliomas. Immediately after cell implantation, the signal of the [124I]FIAU-prelabeled cells was visible for all used cell concentrations in all animals, with the signal intensity being proportional to the number of implanted cells (Figure 3A). Signal intensity decreased over time so that only the highest cell number could still be detected 6 days after intratumoral injection. This decrease in [124I]FIAU signal over time was faster than the decay of radiotracer. Twenty-four hours after injection, the remaining radioactivity was 20%, ≈40%, and 60% of the expected value for 1 × 10⁴, 1 × 10⁵, and 1 × 10⁶ cells, respectively (Figure 3B).
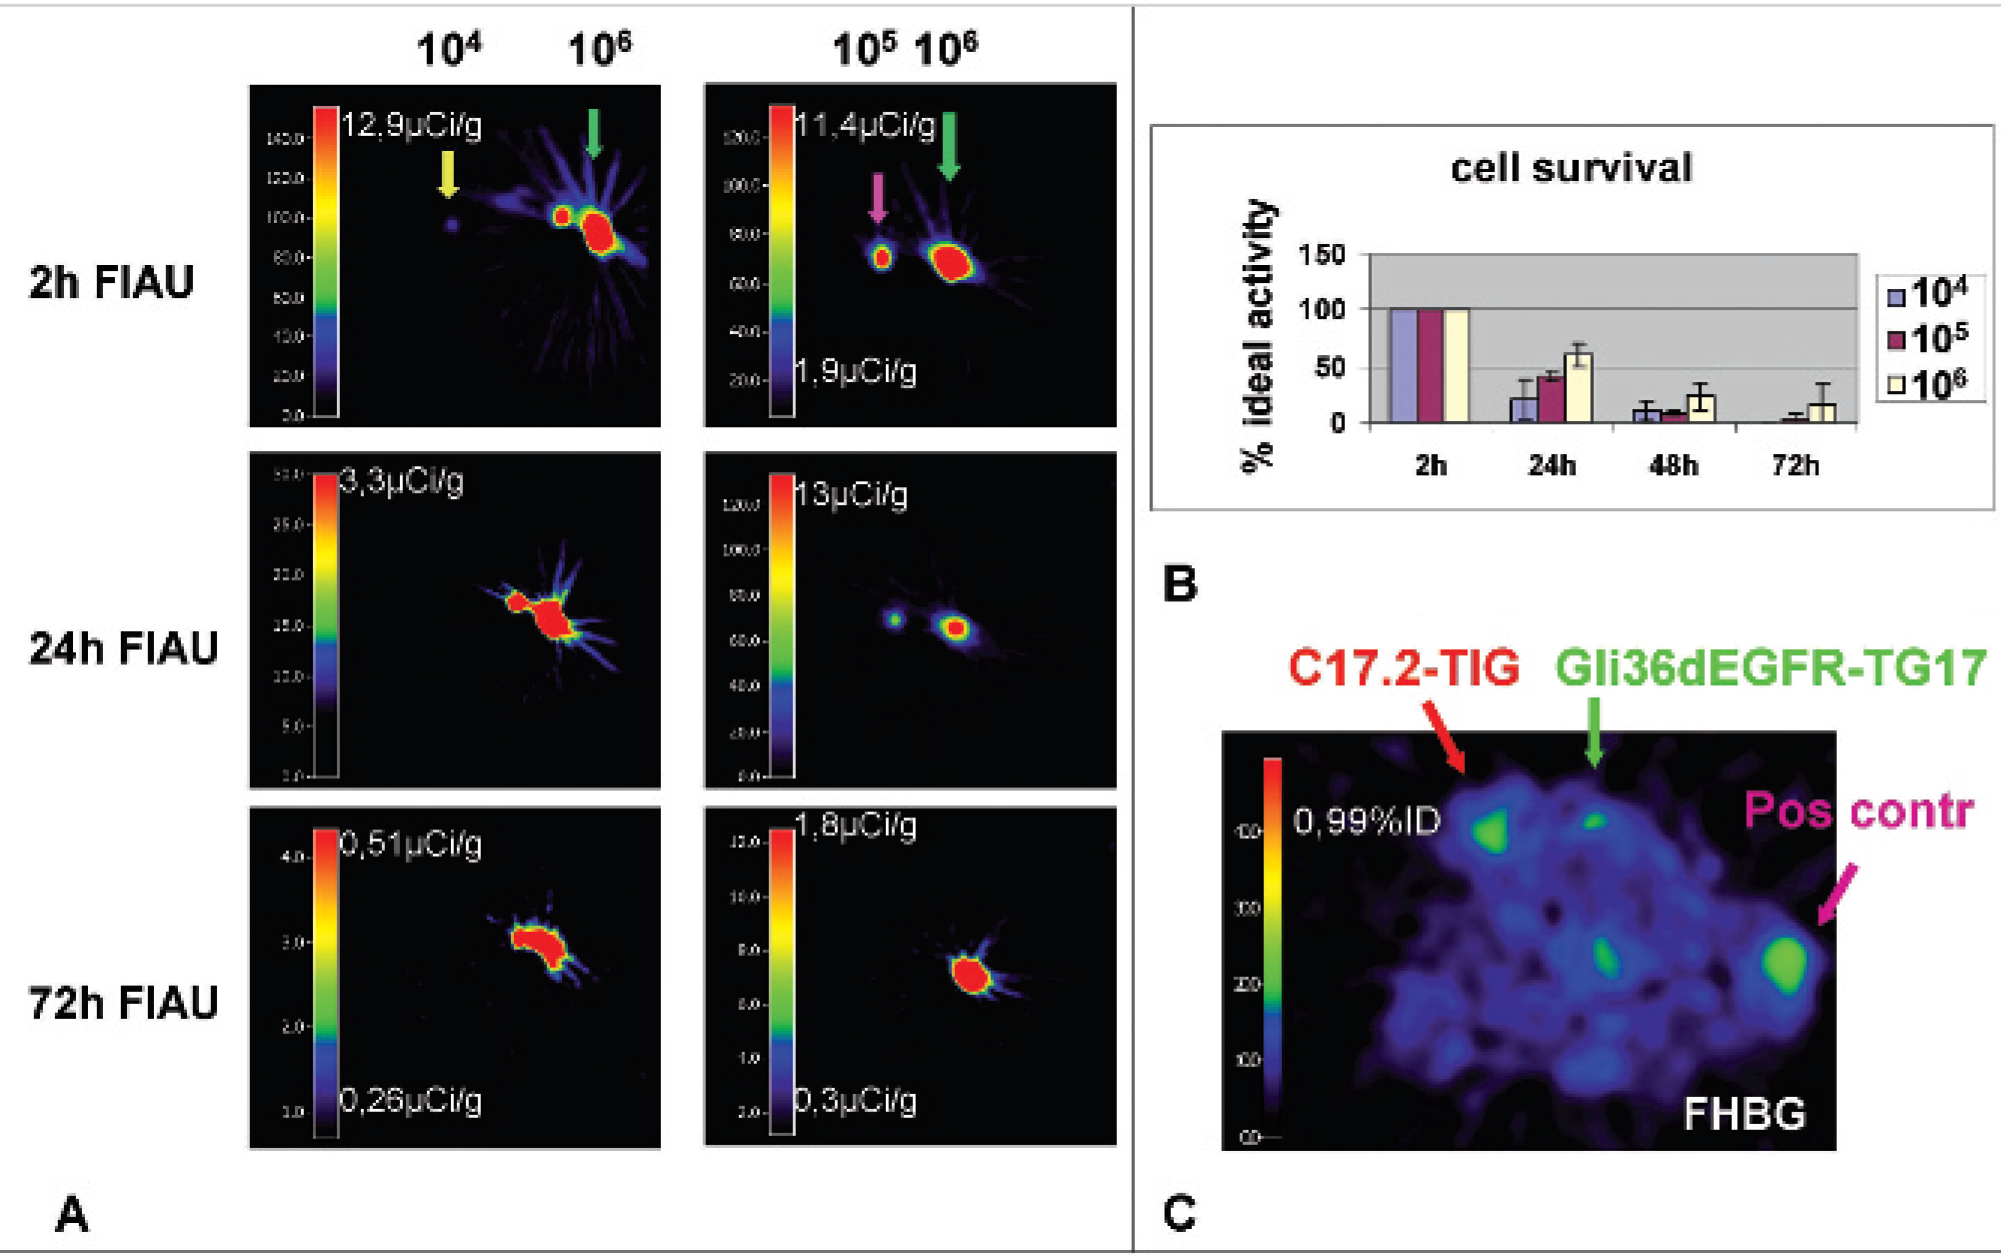
In vivo detection sensitivity of microPET for neural progenitor cells. A, MicroPET measurements of [124I]FIAU-prelabeled C17.2-TIG cells (1 × 10⁴, 1 × 10⁵, and 1 × 10⁶ cells) followed over 3 days. B, Evolution of [124I]FIAU signal intensity of the used cell concentrations over time, expressed as a percentage of the expected signal when only tracer half-life is taken into account. C, [18F]FHBG-PET performed 48 hours after injection of 1 × 10⁷ C17-TIG or Gli36dEGFR-TG17 cells into preestablished subcutaneous Gli36dEGFR gliomas. Gli36dEGFR-TG17 subcutaneous tumors served as positive controls.
In the second set of experiments, we compared intratumorally injected C17.2-TIG cells with intratumorally injected cells of the positive control cell line Gli36dEGFR-TG17. Specific [18F]FHBG accumulation became visible only for the highest cell number (1 × 10⁷ cells) of both cell lines 24 and 48 hours after intratumoral injection in one of four tumors containing this cell number (Figure 3C).
C17.2-TIG or Gli36dEGFR-TG17 cells (1 × 10⁵ cells) injected into intracranial growing gliomas were not detected by [18F]FHBG-PET.
Multimodal Imaging of NPCs in an Intracranial Glioma Model
In the third set of experiments, transplanted C17.2-LITG cells were detected as an almost spherical BLI signal (Figure 4, upper row). From approximately day 8, a tail at the medial edge of the bioluminescence signal was observed, indicating possible migration of C17.2-LITG cells toward the tumor in the contralateral hemisphere. In none of the animals could a complete shift of the stem cell–mediated BLI signal to the contralateral side be detected (see Figure 4, upper row). This result was independent of the timing of NPC injection relative to tumor cell injection. In all mice, tumor growth was confirmed by MRI (Figure 4, middle row). Stem cells inoculated in the left striatum could not be detected by [18F]FHBG-PET (Figure 4, lower row) owing to the inability of this radioisotope to cross the intact BBB. Even at later time points, no specific [18F]FHBG accumulation became visible, either in the primary injection site or within the area of the contralateral tumor (see Figure 4, lower row). Histologic analysis confirmed the restriction of C17.2-LITG cells to the injection site (Figure 5A).
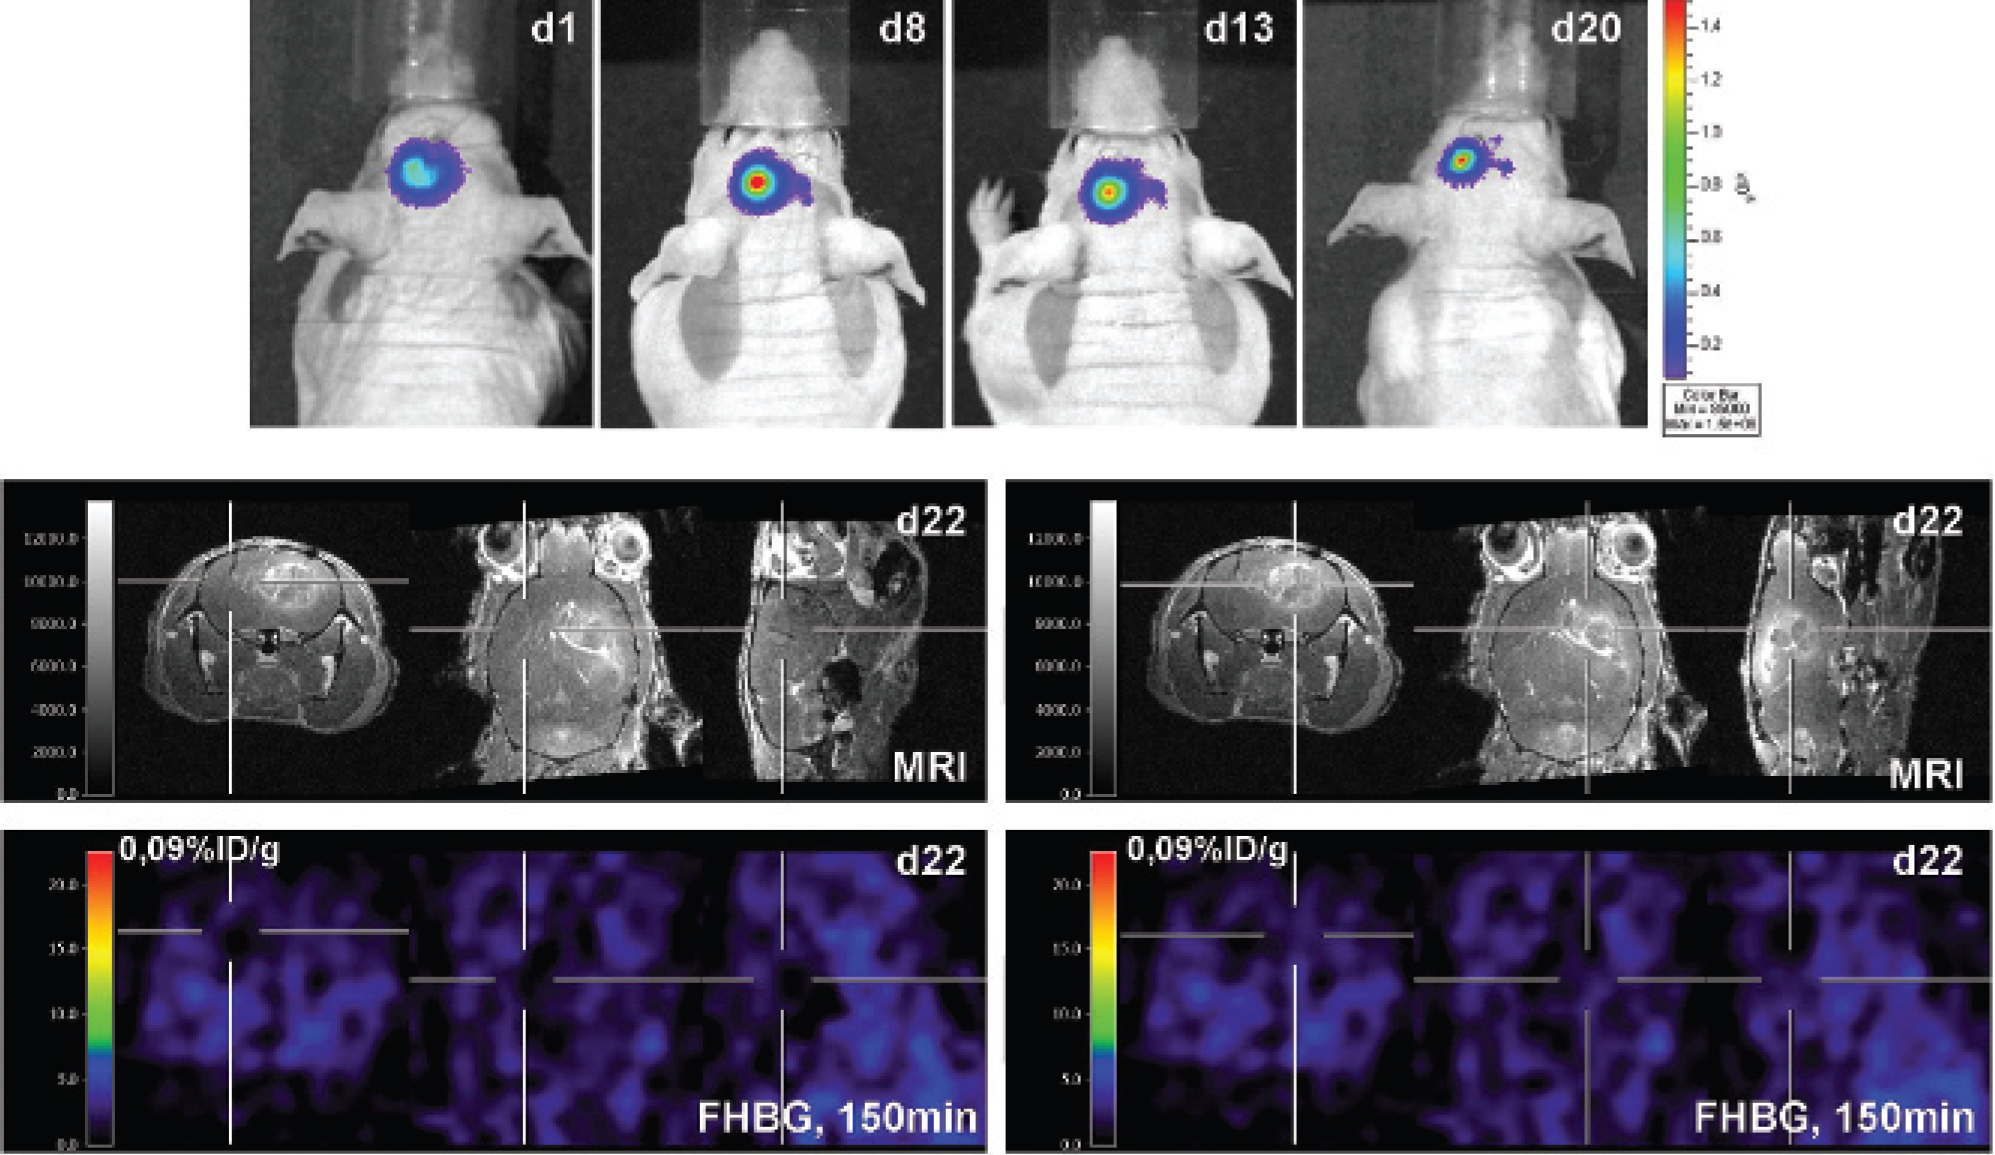
Multimodal imaging of neural progenitor cell migration toward the contralateral tumor-bearing hemisphere. Multimodal imaging of a representative animal in which C17-LITG cells were injected into the left striatum on the same day as glioma cell inoculation into the right striatum. Upper row, Bioluminescence imaging signal over the brain at 1, 8, 13, and 20 days postimplantation. Middle row, Gadolinium-enhanced T1 magnetic resonance image (MRI) at 22 days posttransplantation. The cross in the left panel focuses the injection tract of the progenitor cells; the cross in the right panel focuses the growing glioma. Lower row, [18F]FHBG-PET image at 22 days posttransplantation, matched to the MRI displayed in the middle row. After 150 minutes of tracer incubation, no specific [18F]FHBG accumulation is visible at the site of stem cell inoculation (left panel) or at the site of glioma proliferation (right panel).

Histologic evaluation. A, Hematoxylin-eosin (H&E) (a) and X-Gal (b and c) staining of one representative animal with 2 × 10⁵ C17-LITG cells injected contralateral to an established glioma. (a) Tumor in the right striatum; (b) neural progenitor cells (NPCs) (blue) stayed localized at the injection site and did not migrate to the contralateral tumor; (c) higher magnification of b. The animal was sacrificed 20 days after glioma cell inoculation. B, H&E (a) and X-Gal (b and c) staining of one representative animal with injection of 5 × 10⁵ C17-LITG cells mixed with 1 × 10⁵ glioma cells. (a) Tumor in the right striatum; (b) NPCs (blue) spread within the tumor but did not migrate to the tumor border or to the adjacent brain parenchyma; (c) higher magnification of b. The animal was sacrificed 14 days after injection of the cell mixture.
In the fourth set of experiments with unilateral intracerebral injections of NPCs and tumor cells, in all animals, C17.2-LITG cells could be detected with BLI and [18F]FHBG-PET (Figure 6). The bioluminescence signal intensities increased over time in both the mix injection experiments and the intratumoral injection experiments. This increase in signal intensity was also observed by [18F]FHBG-PET. The average increase in the luminescence signal was 19.6-fold for the intratumoral injections after 1 week. In the mixed implantation experiments, the average increase over the first 2 weeks was 11.0-fold (Figure 7). In contrast, in the third experiment with bihemispheric injections, there was only a 1.7-fold increase in the bioluminescence signal by 2 weeks. Figure 5B shows representative images from one animal with injection of C17.2-LITG cells mixed with Gli36dEGFR cells. These images show that at the time point of sacrifice, 14 days after injection of the cell mixture, tumor growth was more extensive than the distribution of the NPCs within the tumor.
In control animals (n = 2) that received C17.2-LITG cells into the left striatum, no migration of NPCs toward the unaffected right hemisphere was observed. However, uncontrolled migration of C17.2-LITG cells in the direction of the cerebellum could be observed in both animals. This aberrant migration was preceded by a clear increase in bioluminescence signal intensity. In one animal, the migration became apparent 79 days after C17.2-LITG inoculation and lasted for more than 2 months before the animal died (Figure 8A). In the second animal, C17.2-LITG migration toward the cerebellar hemispheres took place 2 weeks after cell inoculation. At 3 weeks, progenitor cells were also localized at the level of the thoracolumbar spine, resulting in paraplegia (Figure 8B).
Furthermore, aberrant progenitor cell migration could also be detected in one animal of the intratumoral injection group. NPCs became visible around the cerebellum 5 days after cell inoculation (data not shown).
Although MRI served primarily the purpose of monitoring tumor growth and location, attempts were made to monitor cell migration by MRI after labeling them with iron oxide particles. These experiments were not successful owing to the short migration distance of iron oxide–labeled cells. Owing to the strong susceptibility effect of the contrast agent in T2*-weighted MRIs, migrating cells were not distinguishable from the large reservoir of nonmigrating cells. Use of lower concentrations of the iron oxide particles and/or use of T2-weighted MRI for the suppression of the susceptibility effect were not sensitive enough for the detection of the small clusters of migrating cells (data not shown).
Discussion
In this study, we investigated the feasibility of different molecular imaging modalities to detect cultured and implanted NPCs engineered to express specific imaging genes. Using modified pBABE-retroviral constructs, C17.2 NPCs were engineered in culture to proportionally coexpress a fluorescent gene (gfp) together with PET (HSV-1-tk) and/or BLI (luc) imaging genes (C17.2-TIG or C17.2-LITG).
Although BLI was found to be the more sensitive tool, detecting up to 100 cells expressing firefly luciferase in cell culture, tk-expressing cells could be detected with PET too. The cell culture detection limit for PET was 5 × 10³ cells labeled with [18F]FHBG. In vivo, 1 × 10⁴ intratumorally implanted [124I]FIAU-prelabeled C17.2-TIG cells could be detected, whereas only 1 × 10⁷ cells could be detected using [18F]FHBG-PET after intratumoral implantation.

Multimodal imaging of neural progenitor cells (NPCs). Displayed are data from one representative animal with injection of NPCs within a preestablished glioma (A) and from one representative animal with injection of NPCs mixed with glioma cells (B). Upper row, Bioluminescence imaging (BLI) signal over the brain at 0, 2, 5, 9, and 13 days; resp. 0, 5, 13, and 15 days postimplantation. Second row, Gadolinium-enhanced T1 magnetic resonance image (MRI) at 7 days posttransplantation. The cross focuses the growing glioma. Lower rows, [18F]FHBG-PET image at 7 and 13 days posttransplantation, matched to the MRI displayed in the second row. After 150 minutes of tracer incubation, specific [18F]FHBG accumulation is visible at the site of glioma proliferation in both injection paradigms (A and B). The BLI signal intensity increase between days 5 and 15 in the mixed injection paradigm is also reflected in an increased [18F]FHBG uptake between days 7 and 13 (B).
The second aim of this study was to noninvasively follow the fate of C17.2-LITG NPCs in an intracranial glioma model. The use of BLI enabled the detection of inoculated stem cells in all implantation paradigms, whereas [18F]FHBG-PET only detected NPCs localized at sites of disrupted BBB. MRI was recorded to navigate the PET or BLI signal orientation within the brain morphology. Tumor-attracted cell migration could only be faintly detected with BLI, whereas aberrant cell migration in the direction of cerebellar hemispheres and even of the thoracolumbar spine could be clearly detected, in both tumor-bearing and control animals. Moreover, in coinjection experiments, BLI signals steadily increased in intensity over time as opposed to the BLI signals in bihemispheric injection experiments, most likely owing to excessive progenitor cell proliferation.
Altogether, our data demonstrate that multimodal imaging of the fate of NPCs inoculated into the rodent brain is feasible using reporter gene technology. BLI serves the higher sensitivity for detecting luc-expressing cells, especially in conditions in which the BBB is intact. In conditions in which the BBB is disrupted, [18F]FHBG-PET also serves for localization for tk-expressing cells. Sequential, noninvasive imaging may serve as a safety switch for early detection of aberrant cell migration and excessive cell proliferation.
Over the past decades, several imaging technologies for repetitive and noninvasive imaging of the fate of implanted cells after their administration into an organism have been developed. Among these technologies BLI, PET, and MRI are mostly used in experimental animal studies. Each of these technologies has intrinsic advantages and disadvantages.34,35 All three modalities have been used to track the migratory capacity of implanted cells. Whereas stem cell migration within the CNS has been described by both MRI and BLI, PET has only been used to image the whole-body distribution of adoptively transferred immune T lymphocytes,36,37 ex vivo labeled tumor cells, 38 or mesenchymal stem cells 39 or the intratumoral distribution of bone marrow–derived progenitor cells in an intracranial rat glioma model. 40 In the latter study, PET was successfully used to noninvasively detect intratumorally injected tk-expressing bone marrow–derived tumor-infiltrating cells and to monitor their therapeutic efficacy after ganciclovir treatment. No attempts were made to study the feasibility of PET to noninvasively image tumor-attracted stem cell migration or the long-term behavior of injected stem cells, as were some of the aims of this study. MRI has been used to detect stem cell migration within the CNS under several conditions: normal development, 41 stroke,21,23,26 tumor growth, 42 and traumatic brain and spinal cord injury. 27 BLI has been used to detect stem cell migration toward growing gliomas18,43 or stroke regions 20 and to monitor the magnitude and timing of the therapeutic effect of stem cell–mediated delivery of proapoptotic proteins. 18
Our data indicate that reporter gene–labeled NPCs can be detected not only with BLI but also with PET, with signal intensities being proportional to cell number in both cases.

Time course of bioluminescent imaging signals. Data are displayed as the mean rate of total photon emission (p/s ± SD) in the three injection paradigms (neural progenitor cells [NPC] injected contralateral to glioma cells, within a growing glioma, or as a mixture with glioma cells).
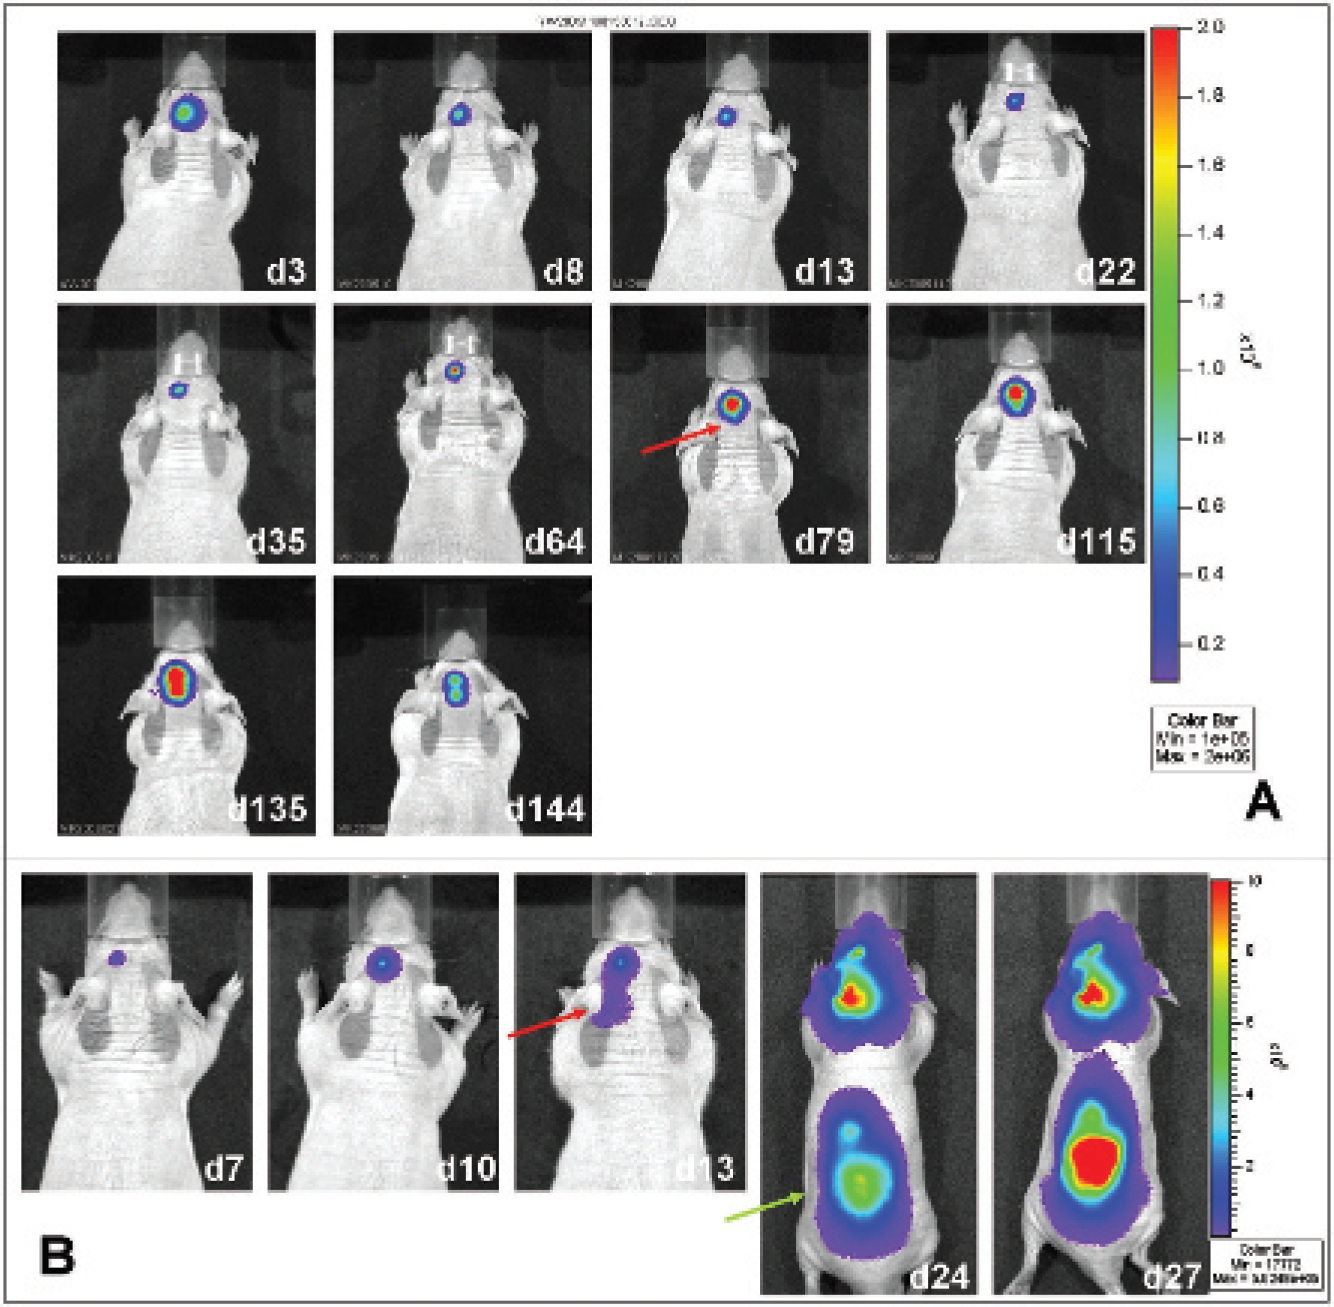
Bioluminescence imaging of neural progenitor cells (NPCs) injected into the unaffected brain. C17-LITG cells were injected into the left striatum, and their behavior over time was monitored with optical imaging. A, NPC migration in the direction of the cerebellar hemispheres (red arrow) could be demonstrated starting from day 79 postinjection in this animal. B, In this animal, cerebellar migration was already obvious 13 days after injection (red arrow); at 3 weeks, NPCs also localized at the level of the thoracolumbar spine (green arrow).
The detection sensitivity of BLI for serial dilutions of C17.2-LITG cells was 100 cells. The detection sensitivity of microPET for serial dilutions of [8F]FHBG-prelabeled C17.2-TIG cells was 5 × 10³ in 100 μL. When ex vivo [124I]FIAU-prelabeled C17.2-TIG cells were injected into preestablished subcutaneous gliomas, the lower detection limit was 1 × 10⁴ cells. In contrast, only 1 × 10⁷ of in vivo 18F-FHBG-labeled C17.2-TIG cells could be detected. When the [124I]FIAU signal was registered over time, the decrease in the signal intensity was more rapid than the decay of the radiotracer. This finding was constant in all analyzed cell numbers. Because single cells are the carriers of radioactivity, cell death means washout of the tracer. Related to the observation described here, the discrepancy between expected and measured radioactivity can be interpreted as progressive cell death after intratumoral injection.
In a similar experiment analyzing HSV-1-tk-expressing N2a murine glioma cells, Su and colleagues found that, using the microPET P4 scanner, the limit of detection was 1 × 10⁵ cells in 200 μL for [18F]FHBG-prelabeled cells in culture as well as in vivo and 1 × 10⁶ in 100 μL for in vivo [18F]FHBG-labeled cells. 44 The better in vitro detection properties of the C17.2-TIG cells used in our study might be due to a higher degree of TK expression per cell, whereas the intratumoral administration of cells in our study might have led to a decreased degree of cell survival.
The fluorescent protein included in the imaging constructs was used to check transduction after generating stable cell lines under the microscope. In vivo fluorescence imaging was not performed because of the unfavorable spectral properties of GFP with high light scatter and absorption. 45 For this purpose, a more red shifted protein or dye would be more appropriate, as has been shown previously for superficial locations. 46
The C17.2 cell line used in the current study is a model clonal NPC line derived from mouse neonatal cerebellum, immortalized with the c-myc oncogene, and stably expressing lacZ. 47 This C17.2 cell line has previously been characterized as a transgene-expressing cell line, fulfilling the strict operational definition of a stem cell.48,49
Furthermore, in different studies in the past, numerous research groups have assessed the exceptional migratory ability and the potential of this cell line to be successfully transfected with various therapeutic genes without losing its stem cell properties.16,18,20,41,43,50
In published C17.2 tracking experiments using BLI for stem cell detection, a 50 to 100% shift of the stem cell–derived BLI signal from the site of cell injection to the contralateral pathologic hemisphere has been reported.18,20,43 In contrast, only a minor shift of stem cell–derived BLI signal to the contralateral hemisphere was detected in our experiments. The number of animals investigated in the current study (n = 5) was comparable to the numbers investigated by Tang and colleagues (n = 5), 43 Shah and colleagues (n = 16), 18 and Kim and colleagues (n = 9). 20 In agreement with our experiences, other investigators also observed that although many intracranially inoculated NSCs demonstrated robust migratory activity and tumor-tracking capabilities, a significant proportion of transplanted NSCs did not exhibit this migratory capacity and remained localized at the site of initial intracranial injection. 14
Further analysis of the subpopulation of migrating NSCs revealed that the tumor-tropic cell population composed of progenitor cells that had initiated, but not completed, pathways toward astrocytic differentiation as they stained positively for the astroglial precursor markers A2B5 and glial fibrillary acidic protein but negatively for the differentiated glia markers excitatory amino acid transporters 1 and 2. 51 Additionally, tumor-tracking NSCs strongly expressed CXCR4, the cell surface receptor for SDF-1, and tumor-tracking abilities could be significantly inhibited by blocking CXCR4. It was recently shown that the production of SDF-1 by glioma cells, the only known ligand for CXCR4, correlates with the histologic grade, tumor cell survival, and invasiveness.52,53 Immunohistochemical analysis of the C17.2 cell lines used in the current study showed only minimal staining for CXCR4 and even absent staining in cells with a high passage number. This is one possible explanation why intracranially implanted C17.2-LITG cells did not migrate extensively toward contralateral growing gliomas in our experiments. However, the C17.2 cells used exhibited migrational potential toward the cerebellum, independent of glioma proliferation. Because this NPC clone was initially derived from developing mouse cerebellum, 47 it is feasible that cerebellar-chemotactic cues made C17.2 cells migrate toward this brain region, where, from a developmental point of view, they belong.
As stated above, only limited data currently exist on cell trafficking using PET. In general, the application of HSV-1-tk as a PET marker within the CNS is limited by the fact that marker/reporter probes for this system do not significantly penetrate the BBB. 54 Thus, to be able to detect C17.2-LITG cells within the brain by specific accumulation of [18F]FHBG, these cells have to be localized in a region with BBB disruption, in our experiments corresponding to regions with tumor-induced opening of the BBB, as confirmed by gadolinium-enhanced MRIs. Under these conditions, we were able to detect intracranial localized NPCs. However, it should be pointed out that the results of the experiments with 2 × 10⁵ C17.2-LITG cells (migration) and 5 × 10⁵ C17.2-LITG cells (intratumoral injection) might not be directly comparable owing to the different cell numbers used.
To overcome the problem of limited BBB penetration, several research groups are exploring methods to improve the transport rates of these marker/reporter probes across the BBB, for example, by creating new radiolabeled HSV-1-tk substrates with increased lipophylicity, which facilitates passive diffusion of the radiotracer through the BBB, 55 or by creating new reporter gene/reporter substrate systems, such as the xanthine phosphoribosyltransferase–xanthine system. The feasibility, sensitivity, and specificity of this system have already been successfully tested in an intracranial glioma model (RG2) with almost intact BBB using [14C]xanthine and quantitative autoradiography. 56
The application of reporter probes that readily cross the intact BBB will significantly enhance the potential of PET to study CNS pathologies that do not induce BBB disruption, such as neuropsychiatric disorders, or in which there is only little or inhomogeneous BBB damage, as in gliomas.57–59
BLI is a semiquantitative imaging modality.60,61 For the transgenic cell line C17.2-LITG used here, we confirmed a linear dependency between the cell number and the rate of photon emission. In contrast to bihemispheric injection experiments, we observed a steadily increasing BLI signal in coinjection experiments. By extrapolation of our cell culture data, this observation means that the C17.2-LITG cell number steadily increased in the coinjection experiments, whereas the stem cell number remained more or less constant in the bihemispheric injection experiments. Theoretically, two mechanisms can explain the behavior of C17.2 cells that come in contact with glioma cells: excessive proliferation or tumorigenic transformation of the progenitor cells. Multiple growth factors are known to be expressed in gliomas. Among those are fibroblast growth factors 1 and 2; platelet-derived growth factor AA (PDGF-AA) and BB; scatter factor/hepatocyte growth factor; insulin-like growth factors 1 and 2; transforming growth factors α, β1, and β2; pleiotrophin; and midkine.62,63 Several of these factors have been implicated in the stimulation of glioma cells, as well as stem cell migration 64 and survival and proliferation.65–67 Furthermore, it was recently shown that PDGF-AA has the potential to induce proliferation of stem cells (B cells) from the subventricular zone and even generate large hyperplasias with some features of gliomas. 68
The observation of similarities between the self-renewal mechanisms of stem cells and cancer cells has led to the new concept of the cancer stem cell. The cancer stem cell hypothesis of tumor origin was first reported in leukemia 69 and has been extended to other tumor entities, such as prostate cancer, 70 breast cancer, 71 bone sarcoma, 72 liver cancer, 73 melanoma, 74 and brain tumors, 75 including glioblastoma. 76
A recent review addressed the possibility that cancer stem cells originate from cell fusion or a horizontal gene-transfer process. 77 Therefore, theoretically, in the current coinjection experiments, cell fusion between C17-LITG cells and Gli36dEGFR cells may have occurred. However, it must be notified that the sole implantation of C17.2-LITG progenitor cells in control animals also led to an increase in bioluminescence signal intensity preceding uncontrolled migration of the cells. The increase in signal intensity in this region again implicates the proliferation of these cells. Both uncontrolled migration and proliferation of NPCs have not been described in similar studies dealing with C17.2 migration toward brain lesions.18,20,43 At least in one animal of the present study, this might be due to the longer investigation time (144 days) compared with other studies. Our data indicate that the use of NPCs in cell-based therapies should be performed carefully as the proliferation potential of these cells might be reactivated within an unpredictable time frame after transplantation.
Further analysis of both progenitor cell–tumor cell interaction and progenitor cell migration/proliferation stimuli are necessary and currently under investigation.
Summary
We engineered NPC lines, C17.2-TIG and C17.2-LITG, to express a dual or triple reporter gene construct for serial, noninvasive monitoring of cell fate with BLI and PET in living animals. Our data indicate that molecular imaging should be used as a safety switch for early detection of aberrant cell migration and excessive cell proliferation. By using PET as a noninvasive imaging modality, a direct transfer into the clinical setting is possible.