
Abstract
A retroviral vector pQHSP70/hNIS-IRES-eGFP (pQHNIG70) was constructed containing the hNIS-IRES-eGFP dual-reporter genes under the control of an inducible human heat shock protein (HSP)70 promoter and RG2-pQHSP70/hNIS-IRES-eGFP (RG2-pQHNIG70) transduced cells were generated. Heat-induced expression of both reporter genes in RG2-pQHNIG70 cells was validated by enhanced green fluorescent protein (eGFP) fluorescence-activated cell sorter, in vitro radiotracer assays, and immunoblot and immunocytochemistry. A 2.2- to 6.1-fold (131I−), a 6.1- to 14.4-fold (99mTcO4−), and a 5.1- to 39-fold (fluorescence) increase above baseline was observed in response to graded hyperthermia (39–43°C). Increases in eGFP fluorescence and radiotracer uptake were first noted at 6 hours, reached a maximum at 24 hours, and fell toward baseline at 72 hours. A stable ratio of radiotracer uptake to eGFP fluorescence and to heat shock protein (HSP)70 protein was demonstrated over a wide range of expression levels, induced by different levels of heating. We also demonstrate that the local application of heat on RG2-pQHNIG70 xenografts can effectively induce hNIS and eGFP gene expression in vivo and that this expression can be efficiently visualized by fluorescence, scintigraphic, and micro–positron emission tomography imaging. Endogenous HSP70 protein and reporter expression was confirmed by postmortem tissue evaluations (immunoblot and immunohistochemistry). The pQHNIG70 reporter system can be used to study stress and drug responses in transduced cells and tissues.
The protective function of HSPs is reflected by the magnitude of their induction following biochemical and physical stress. Along with cofactors, HSPs prevent cell death by inhibiting the aggregation of cell proteins and by directly antagonizing multiple cell death pathways. This is particularly relevant to malignant tumors that are known to overexpress HSPs. For example, HSP70 has been shown to be closely associated with tumorigenesis, the transition to a more malignant phenotype, tumor immunity, resistance to apoptosis, and a poor clinical prognosis.8–18
HSPs are also critical components of several diseases19–21 other than cancer. For example, the amyloid-related neurodegenerative diseases can be considered protein misfolding diseases. This group of diseases is thought to result from proteins that fail to attain their native active state or to the aggregation, accumulation, and toxic effects of misfolded proteins. Similarly, the polyglutamine diseases are an inherited group of neurodegenerative diseases that are characterized by misfolding and aggregation of proteins possessing expanded polyglutamine repeats. It has been shown that overexpression of some HSPs can suppress both amyloid and polyglutamine aggregation and can prevent or limit cell death.22–24
In this report, we focus on HSP70 and imaging the transcriptional regulation of this important chaperone protein. We describe the combination of an HSP70 enhancer sequence and a recently developed internal ribosomal entry site (IRES)-linked human sodium iodide symporter (hNIS), enhanced green fluorescent protein (eGFP) dual-reporter gene, for both nuclear and optical imaging. 25 We show that this cis-reporting system can be used to monitor and study the effects of heat-induced stress in cells and in animals bearing xenografts transduced with this reporter system using noninvasive fluorescence and radionuclide imaging. In addition, we show that hNIS can be used effectively in a heat-inducible reporter system that has the potential for translation to patient studies.
Materials and Methods
Construction of the pQHNIG70 Retroviral Vector
Figure 1 describes the construction of a self-inactivating retroviral vector that contains an inducible human HSP70 promoter and IRES-linked hNIS and green fluorescent protein reporter genes. Construction of the pQCMV/hNIS-IRES-eGFP retroviral vector was described previously. 25 For construction of the pQHSP70/hNIS-IRES-eGFP (pQHNIG70) retroviral vector, polymerase chain reaction (PCR) was performed to obtain the human heat shock protein (hHSP)70 promoter element from the pDRIVE01-HSP70(h)v03 vector (InvivoGen, San Diego, CA) with XbaI (5′) and NotI (3′) restriction sites. The PCR product was digested with XbaI and NotI and ligated to the XbaI–Not I fragment in pQcmv/hNis-IRES2-eGFP vector to replace the cytomegalovirus (CMV) promoter. The resulting retroviral vector contains an inducible but truncated hHSP70 promoter that controls the expression of the IRES-linked hNIS and eGFP reporter genes.
Cell-Line Transduction, FACS Sorting, and Cell-Line Establishment
To establish an HSP70-reporter cell line, RG2 glioma cells were transduced with the pQHNIG70 retroviral vector as described previously. 25 Following transduction, the mixed population of cells was stabilized in standard growth medium (Minimum Essential Medium [MEM] supplemented with 10% fetal bovine serum [FBS], 100 U/mL penicillin, and 100 U/mL streptomycin) for 6 days. To obtain RG2-pQHNIG70 cells expressing eGFP under the control of the human HSP70 promoter, the population of cells following exposure to the pQHNIG70 retrovirus contained both transduced (RG2-pQHNIG70) and nontransduced (RG2) cells. This population was heated at 42°C for 60 minutes and subsequently maintained at 37°C for 24 hours prior to sorting based on eGFP expression.

Construction of the pQHNIG70 retroviral vector. The pQCNIG retroviral vector 25 and a fragment from the pDRIVE01-HSP70(h) v03 vector containing the human HSP70 promoter were used. The fragment with incorporated XbaI and NotI sites was obtained by polymerase chain reaction amplification (A) and subcloned into pQCNIG (B), upstream of the hNIS-IRES-GFP cassette, to replace the CMV promoter (C). The resulting pQHNIG70 vector contains an inducible human HSP70 promoter and the hNIS-IRES-GFP reporter gene cassette (C, D).
A FACSVantage (Becton Dickinson, San Jose, CA) sorting system was used to collect the eGFP(+)-expressing (RG2-pQHNIG70 transduced) cells under sterile conditions. The cells were maintained as previously described. 25 Following expansion of the sorted RG2-pQHNIG70 cells, reporter gene expression under the control of the human HSP70 promoter was assessed by fluorescence microscopy, fluorescence-activated cell sorter, immunoblot analysis, and immunocytochemistry. Subcellular localization of eGFP protein in transduced tumor cells was visualized by fluorescence microscopy (Nikon Eclipse T-100, Morrell, CT) using 488 nm excitation and 510 nm emission filters.
Heat-Shock Treatment
For the in vitro heat-shock experiments, RG2-pQHNIG70 and RG2 wild-type cells were exposed to hyperthermia in a CO2 incubator where the temperature had previously been adjusted to the indicated value (eg, 42°C) for indicated times (eg, 60 minutes) and then maintained at 37°C as described in the figure legends. The post–heating assay periods ranged from 6 to 72 hours. In a separate set of experiments, RG2-pQHNIG70 and RG2 wild-type cells were exposed to heat at different temperatures ranging from 37 to 43°C for 60 minutes and then maintained at 37°C for 24 hours prior to flow cytometric analysis or radiotracer assays.
The experimental protocol involving animals was approved by the Institutional Animal Care and Use Committee of the Memorial Sloan-Kettering Cancer Center. For the in vivo experiments, RG2-pQHNIG70 xenografts were produced by subcutaneous injection of RG2-pQCNIG70 cells (totally 106 cells) into the distal part of both front limbs of 12 nu/nu mice. RG2-pQCNIG 25 and wild-type RG2 cells (totally 106 cells) were injected subcutaneously in the contralateral thighs of the same animals; all animals were monitored daily, and xenograft size was measured. Tumor size was monitored three times a week using caliper measurements, and tumor volume was calculated assuming a spherical tumor (V = 1/6pd3). Imaging experiments were performed when tumors were approximating 1 cm3, which took about 2 weeks from the time of tumor inoculation. All animals were studied under general anesthesia (intraperitoneal injection of 100 mg/kg ketamine/10 mg/kg xylazine). When the RG2-pQHNIG70 tumors reached ≈0.3 cm3 in size, the anesthetized animal was placed on a Styrofoam thermoinsulating holder, such that the left forelimb protruded down, through a hole in the Styrofoam, and was submerged in a circulating water bath at 42°C for 60 minutes. The contralateral pQHNIG70 xenograft (control), the pQCNIG xenograft (positive control), and the wild-type RG2 xenograft (negative control) were chilled with loosely packed ice chips. Imaging was performed 24 hours after heat exposure.
eGFP Assays
For eGFP expression, FACS analysis was performed; 2 × 10⁴ cells were resuspended in phoshate-buffered saline (PBS) supplemented with 10% FBS. Cells were analyzed with a FACScan cytometer equipped with a 15 mW, aircooled, 488 nm argon-ion laser (FACSCalibur, Becton Dickinson). Subcellular localization of the eGFP protein in transduced tumor cells was visualized by fluorescence microscopy using a Nikon Eclipse T-100 microscope (Morrel, CT) with similar excitation and emission parameters described above for FACS.
Immunocytochemical Staining and Immunoblot Blot Analysis
Localization of hNIS protein in RG2-pQHNIG70 cells was determined by in situ immunocytochemical analysis of cell cultures grown on chamber slides (Lab-TekII Chamber, Nalge Nune International, IL) as previously described. 25 For immunostaining of RG2-pQHNIG70 and wild-type xenografts, tissue was fixed in 10% formaldehyde and cut into 8 μm paraffin sections. Briefly, tissue sections were deparaffinized in xylene and rehydrated through graded alcohols to water. Endogenous peroxidase activity was quenched with 3% H2O2 in methanol. After incubation with 10% normal goat serum, slides were incubated for 12 hours at 4°C with mouse monoclonal hNIS (Chemicon, CA), eGFP (Chemicon, CA), or rabbit polyclonal hHSP70 antibodies (Stressgen Biotechnologies Corporation, Victoria, BC). Slides were then washed with Tris buffered saline with Tween (TBS-T) buffer, and antimouse or antirabbit goat antibody was added for 1 hour. After washing with TBS-T buffer three times, the slides were incubated with a soluble ABC complex in TBS-T for 1 hour and washed with TBS-T for three times. Chromogen substrate containing 25 mg diaminobenzidine, 10 μL 30% H2O2 in 50 mL 0.1 M Tris buffer (pH 7.5) was added to the tissues for a maximum of 20 minutes (staining intensity was visually controlled). After washing with water for 5 minutes, slides were dehydrated, cleared, and mounted.
Samples for immunoblot were prepared from cells exposed to control and heat shock conditions (24 hours after heating to 42°C for 1 hour) using Mammalian Protein Extraction Reagent (Pierce Biotechnology Inc., Rockford, IL). Polyacrylamide gel electrophoretic separation of proteins was carried out using 4 to 12% Bis-Tris precast gels (Invitrogen, Carlsbad, CA) according to the manufacturer's instruction, with 10 μg protein sample in each lane after heating at 95°C for 5 minutes. Separated proteins were transferred onto polyvinylidene fluoride (PVDF) membranes at 30 V for 12 hours. After blocking with 5% nonfat milk for 1 hour, the membrane was incubated with the purified anti-inducible HSP70 (1:1,000), anticonstitutive Hsp70 (1:2,000), anti-HSP90 (1:1,000) (Stressgen), anti-HSTF1 H-311 (1:200; Santa Cruz Biotechnology, Santa Cruz, CA), and anti-β-actin (1:2,000 Abcam Inc., Cambridge, MA) for 1 hour at room temperature and with the secondary antibody (peroxidase-conjugated horse antimouse, goat antirabbit (Vector Laboratories Inc, Burlingame, CA) and goat antirat immunoglobulin G (IgG) (Stressgen) at 1:5,000 dilution for 1 hour. Peroxidase-bound protein bands were visualized using the enhanced chemiluminescence (ECL) method (Amersham Pharmacia Biotech, Little Chalfont, UK).
In Vitro Uptake Studies of Na131I and 99mTcO4-
Iodide and pertechnetate uptake in cell culture was measured using a modification of methods previously described. 25 Briefly, RG2-pQCNIG70 and RG2 wild-type cells (≈5–10 × 105/mL × 20 mL) were seeded onto 15 cm dishes. Following a 24-hour incubation period at 37°C with 5% CO2, the cells were exposed to heat shock at different temperatures (ranging from 37 to 42°C) for 60 minutes and assayed at different times (from 6 to 48 hours) after heat shock. In preparation for the radiotracer uptake study, the culture medium was aspirated and the cells were washed with PBS (pH 7.4). The dual-label iodide and pertechnetate uptake studies were initiated by adding 15 mL of MEM containing 0.01 μCi/mL Na131I (NEN-Perkin Elmer, Shelton, CT; specific activity > 5 Ci/mg, 185 GBq/mg) and 0.1 μCi/mL 99mTcO4− (Nuclear Diagnostic Products, Rockaway, NJ; specific activity ≈1 Ci/mg, 37 GBq/mg). The cells were incubated with Na131I and 99mTcO4 for 10 minutes (37°C, 5% CO2), which was previously shown to be the time when tracer radioactivity reaches a maximum level. 25 Cells were harvested and centrifuged. Radioactivity measurements of both cells and medium were made using a gamma counter (Auto-gamma 5000 Series Gamma Counter, Packard Instrument Company, Downer's Grove, IL) set up for dual 99mTc and 131I counting. All experiments were performed in triplicate and repeated at least twice. Cell to medium radioactivity concentration ratios (cpm/g cells ÷ cpm/mL medium) were calculated.
In Vivo Imaging Studies
All in vivo imaging experiments were performed 24 hours after exposure of the left forelimb xenograft to 42°C for 1 hour. Fluorescence and single-label scintigraphic imaging was performed sequentially on five xenograft-bearing animals under general inhalation anesthesia (2% isoflurane) using an IR-2000M imaging system (Eastman Kodak, Rochester, NY). Regular light and fluorescence images (excitation 488 nm, emission filter 525+ 20 nm) were acquired with a 0.1-second and a 10-second exposure, respectively. Images of 99mTc-pertechnetate were also acquired on the Kodak IR-2000M system using the luminescent screen without a collimator; a single 10-minute acquisition was obtained 60 minutes after intravenous injection of 1 mCi 99mTc-pertechnetate (Nuclear Diagnostic Products; specific activity ≈1 Ci/mg, 37 GBq/mg). The sequential acquisition of light, fluorescence, and gamma-ray luminescence imaging preserved the animal's position and permitted image superimposition for coregistration and visual presentation. Following the initial evaluation on the Kodak IR-2000M system (see above), three of the five animals were imaged on a dual-head X-SPECT (Gamma Medica, Northridge, CA) equipped with a 0.5 mm low-energy (LE) pinhole collimator. X-SPECT imaging was performed 120 minutes after intravenous injection of 99mTc-pertechnetate (see above). A three-dimensional image reconstruction was performed using X-SPECT software, applying a 0.75 Butterworth filter.
In a separate series of experiments, 124I-iodide micro–positron emission tomographic (microPET) images were acquired on six xeonograft-bearing animals. The production and location of the four xenografts and the exposure of the left forelimb to heat (42°C for 1 hour) were identical to those described above. Image acquisition was performed on an R4 microPET II (Concorde Microsystems, Knoxville, TN) 120 minutes after intravenous injection of 0.2 mCi 124I-iodide (Memorial Sloan-Kettering Cancer Center cyclotron; no carrier added); a single 10-minute frame was obtained for each animal. A tomographic image data set was reconstructed for each animal using the filtered-back projection algorithm provided by Concorde Microsystems. Standard orthogonal projections were analyzed for the level of radioactivity in the xenografts. The accumulation of the radiotracer (124I−) in the heat-stimulated RG2-pQCNIG70 xenograft was directly compared with the contralateral nonheated RG2-pQCNIG70 xenograft in each animal, as well as to the positive control (RG2pQCNIG 25 ) and negative control (wild-type RG2) xenografts in each animal.
Statistics
Values are the mean ± standard deviation of these experiments where noted. Significance between experimental values was determined by a two-tailed t-test, and differences were considered significant at p < .05.
Results
Thermosensitivity of the pQHNIG70 Reporter System: In Vitro Experiments
Expression of eGFP in RG2-pQHNIG70 Cells after Heat Shock
To assess the function of the human HSP70 promoter to induce reporter gene expression in transduced RG2-pQHNIG70 cells in vitro, the cells were exposed to heat shock at 42°C for 60 minutes, followed by incubation at 37°C for different time periods. A time-dependent increase in eGFP expression in reporter cells was identified by microscopy and FACS analysis (Figure 2, A and B). Flow cytometry demonstrated an increase in GFP-positive cells over time, to a maximum of 39-fold above baseline levels at 24 hours after heat shock; the differences between neighboring time points and baseline were statistically significant (see Figure 2B). A nonheated population of RG2-pQHNIG70 cells at 37°C was used as a negative control (see Figure 2A, 0 hour).
Comparison of hNIS and eGFP Expression with Endogenous Heat Shock–Regulated Proteins
To examine whether the expression of hNIS and eGFP reporter genes in RG2-pQHNIG70 cells reflects the levels of inducible HSP70 protein, immunocytochemical and immunoblot analyses were performed under normal conditions and following heat shock. Figure 2Cd shows strong plasma membrane-associated hNIS-specific immunoreactivity in heated reporter cells, whereas only weak immunoreactivity was observed in nonheated RG2-pQHNIG70 cells (Figure 2Cc). RG2 wild-type cells, both heated and nonheated, showed only background levels of staining with hNIS antibody (Figure 2Cb and Figure 2Ca, respectively). In parallel, we compared the time course of HSP70 immunoreactivity in response to hyperthermia at 42°C for 60 minutes in RG2-pQHNIG70 cells (Figure 2D). HSP70 immunoreactivity was visualized at 12 hours after heat shock stimulation and reached a maximum level at 24 hours. Immunoreactivity was usually distributed throughout the cell cytoplasm with some perinuclear localization. Only weak immunostaining for HSP70 was detected in RG2-pQHNIG70 cells prior to heating, 0 hour (see Figure 2D). Immunoblot analysis revealed a similar time-dependent pattern of HSP70 protein expression after heat shock in reporter cells (Figure 2E); an increase in the 70 kDa protein was seen 6 hours after thermostimulation, with a maximum level at 24 hours. A correlation between the percentage of eGFP-positive cells (see Figure 2B) and the relative levels of HSP70 expression (see Figure 2E) was observed in RG2-pQHNIG70 cells (Figure 2F).
Radiotracer Uptake in RG2-pQHNIG70 Cells after Heat Shock
To evaluate the effect of hyperthermia on the induction of Na131I and 99mTcO4− accumulation in RG2-pQHNIG70 cells, Na131I and 99mTcO4− uptake experiments were performed. Previous experiments had shown that the 10-minute time point gave maximum uptake of both tracers in RG2-pQcmv/hNis-IRES2-GFP cells. 25 Na131I and 99mTcO4− accumulation was temperature dependent in the reporter cells, and a maximum accumulation was observed following heat shock at 42°C for 60 minutes (Figure 3A). In addition, 24 hours of normal (37°C) incubation after heat shock appears to reflect the optimal time for hNIS maturation (Figure 3B).
These radiotracer uptake profiles are similar to the eGFP expression time-dependent profile (see Figure 2B). The maximum level of tracer accumulation occurred at 24 hours postheating and was fourfold and sixfold above baseline for Na131I and 99mTcO4− uptake at 37°C, respectively. A good correspondence between eGFP fluorescence and radiotracer uptake was observed (Figure 3C), as well as between HSP70 protein synthesis and radiotracer uptake (Figure 3D) in RG2-pQHNIG70 cells, 24 hours after exposure to heat shock (42°C for 60 minutes). The correspondence between the eGFP and radiotracer readout of the reporters confirms our previous observations. 25
Immunoblots for HSF1, HSP90, and HSP70 (constitutive and inducible) are shown for RG2 wild-type and three transduced cell lines (RG2TK+, 26 RG2TG, 27 and RG2QHNIG70) under pre- and post–heat shock conditions (Figure 3E). HSP70 protein (inducible) was markedly increased by heat shock in all four cell lines. HSF1 transcription factor protein was similarly induced in RG2, RG2TK+, and RG2TG cell lines but was expressed at high levels in both pre- and post–heat shock in RG2-QHNIG70 cells.
Thermosensitivity of the pQHNIG70 Reporter System: In Vivo Experiments
Heat-Inducible eGFP and hNIS Expression in Xenografts
Combined eGFP fluorescence and 99mTcO4− gamma-camera imaging was performed in mice bearing four xenografts, before and after exposure of one test (RG2-pQHNIG70) xenograft to 42°C (Figure 4, A and B). Low levels of eGFP fluorescence and 99mTcO4− accumulation are visualized in both RG2-pQHNIG70 test xenografts in the pre–heat shock imaging study (see Figure 4A). Twenty-four hours after the exposure of the left limb to 42°C for 60 minutes, a marked increase in both fluorescence and 99mTcO4− uptake can be seen compared with that in the RG2-pQHNIG70 xenograft in the right forelimb, not exposed to heat shock (see Figure 4B). A high-intensity signal was visualized in the RG2-pQCNIG xenograft (positive control, left hindlimb), and no signal was detected in the RG2 xenograft (negative control, right hindlimb) in both image sets. Following planar gamma-camera imaging, micro–single-photon emission computed tomography (SPECT) was performed on the same animal; a coronal and an axial slice are shown (Figure 4C).

Thermosensitivity of the pQHNIS70 reporter system: in vitro experiments. FACS analysis and fluorescence microscopy of RG2-pQHNIG70 reporter cells at different time points after heat shock (A). RG2-pQHNIG70 reporter cells were exposed to heat shock (42°C for 60 minutes) and the appearance of eGFP-positive cells was recorded by FACS analysis and fluorescence microscopy (magnification 20X). Activation of RG2-pQHNIG70 reporter cells over time (B), as determined by the percentage of eGFP-positive cells in the M1 region of the FACS profiles. Values represent the mean ± standard deviation (n = 3). Immunocytochemical comparison of heat-induced hNIS expression (C). RG2 wild-type and RG2-pQHNIG70 reporter cells were incubated under normal conditions or exposed to heat shock (42°C) for 60 minutes; immunostaining for hNIS protein was performed 24 hours after heat shock: nontreated wild-type RG2 cells (Ca); heat shock–treated wild-type RG2 cells (Cb); nontreated RG2-pQHNIG70 reporter cells (Cc); and heat shock–treated RG2-pQHNIG70 reporter cells (Cd) (magnification X20). Immunocytochemical comparison of the heat-induced expression of endogenous HSP70 over 72 hours (D). RG2-pQHNIG70 cells before and after heat-shock exposure (60 minutes at 42°C) were fixed at the different time points after heating and immunostained with rabbit polyclonal anti-inducible human HSP70 antibody (magnification 20X). Kinetics of HSP70 protein expression following heat shock (E). Immunoblot analyses of HSP70 protein induction over 72 hours in RG2-pQHNIG70 reporter cells exposed to 42°C for 60 minutes. The correlation between expression of eGFP and HSP70 over time in RG2-pQHNIG70 cells (F). The intensity of the HSP70 protein band is expressed in arbitrary units. The regression equation is y = −2.0 + 0.0072 x, R2 = .994.
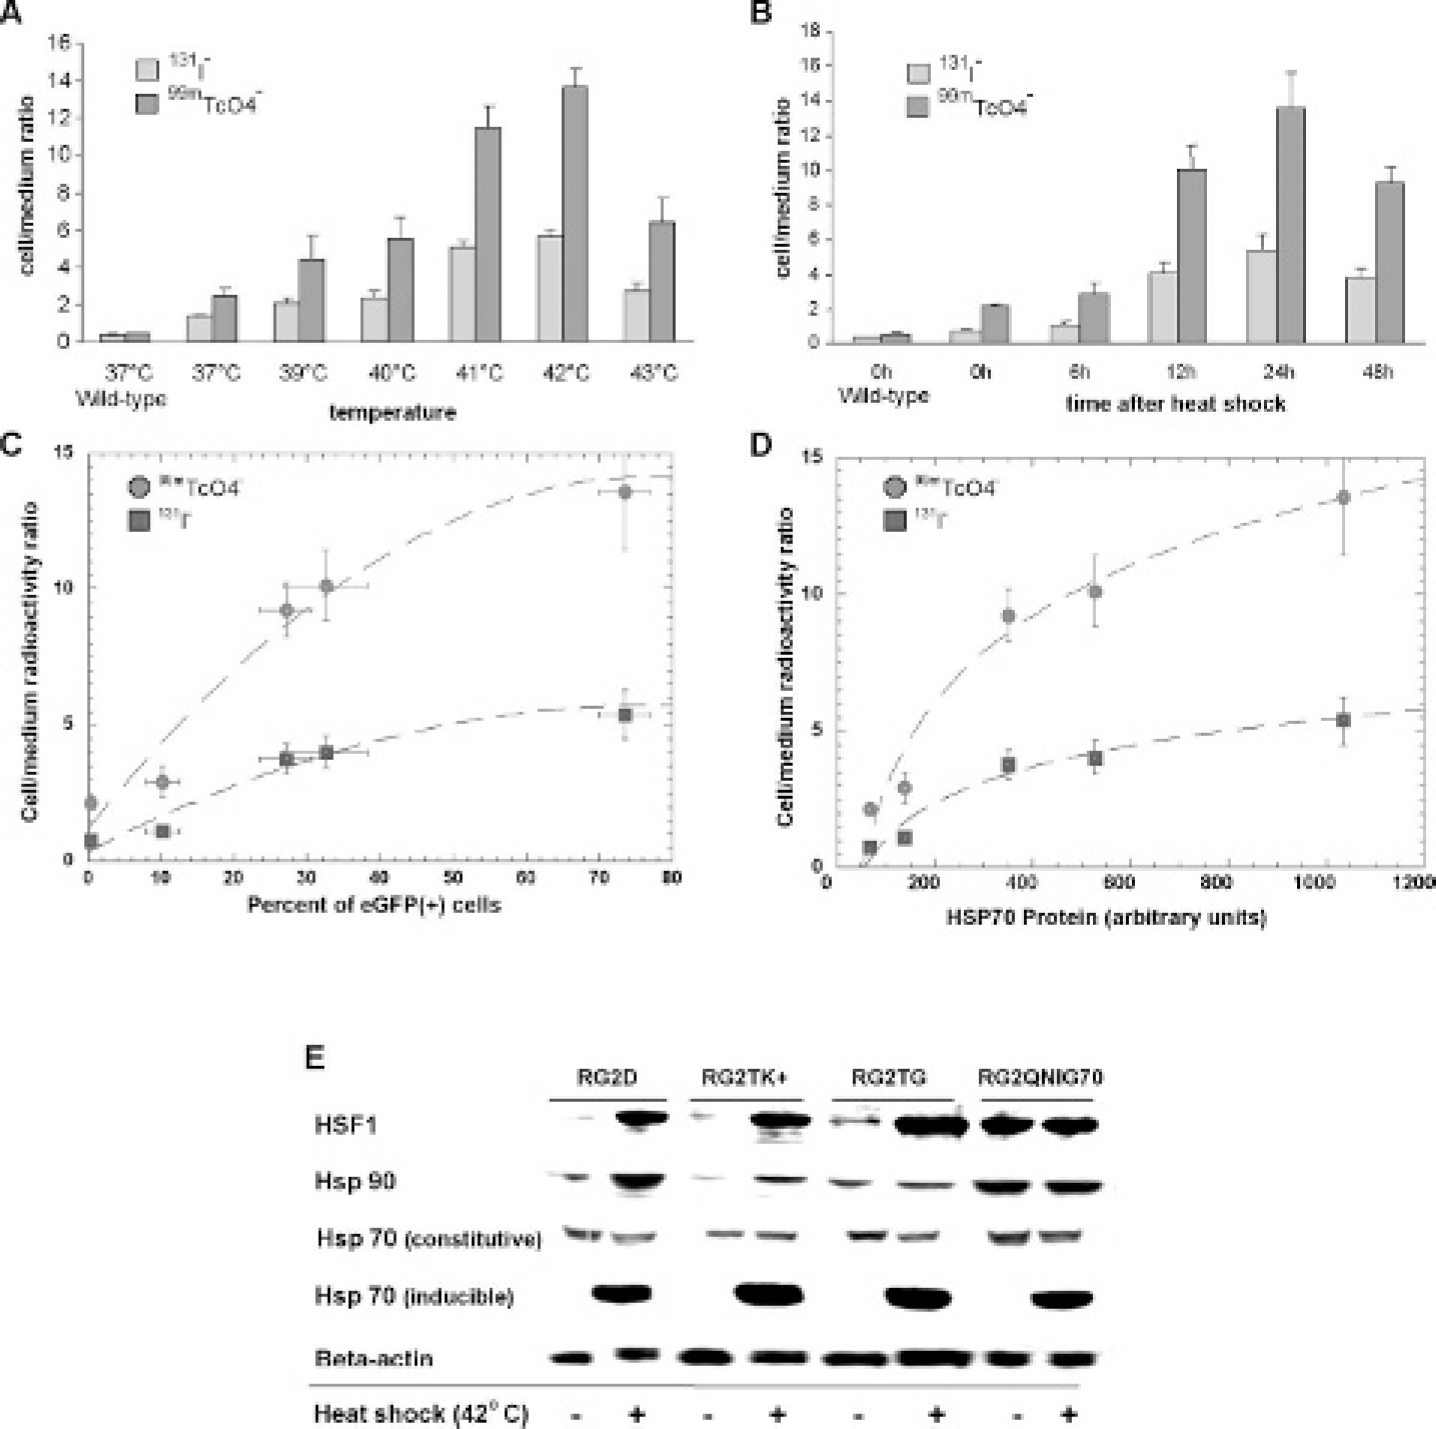
Temperature and time dependence of radiotracer uptake in RG2-pQHNIS70 reporter cells. Radiotracer uptake by RG2-pQHNIG70 reporter cells exposed to different temperatures (from 37 to 43°C) (A). Radiotracer uptake experiments were performed 24 hours after heat shock by the concurrent addition of two tracers to the medium 99mTcO4− (pertechnetate) and 131I− (iodide). A 10-minute uptake experiment was performed, and the results are expressed as a radiotracer cell to medium concentration ratio (dpm/g cell ÷ dpm/mL medium). Values are the mean ± standard deviation of (n = 3); the differences in pertechnetate and iodide uptake were statistically significant. Radiotracer uptake by RG2-pQHNIG70 reporter cells at different time points after heat exposure (42°C for 60 minutes) (B). The 10-minute radiotracer uptake studies were performed, and the results are expressed as a radiotracer cell to medium concentration ratio. Values are the mean ± standard deviation (n = 3); the differences in pertechnetate and iodide uptake were statistically significant. Relationship between hNIS transporter function and eGFP expression (C) and the expression of heat shock–inducible HSP70 protein in RG2-pQHNIG70 reporter cells (D). A nonlinear smooth fit of the data points was applied. Immunoblot for HSF1, HSP90, and HSP70 (constitutive and inducible) proteins before and after heat shock (E). Different cell lines: wild-type RG2D and transduced RG2TK+, RG2-HSV1-TK/GFP, and RG2-pQHNIG70 reporter cells were assayed before and after heat shock (60 minutes at 42°C).
124I-iodide microPET 24 hours after heat-shock exposure (42°C for 60 minutes) was performed in a separate set of animals; the images from two coronal and axial slices of a representative animal are shown (Figure 4D). The upregulation of reporter expression was detected in the heated RG2-pQHNIG70 xenograft located in the left forelimb, but very low (near background level) expression of the hNIS reporter was visualized in the control (nonheated) RG2-pQHNIG70 xenograft located in the right forelimb. The constitutively expressing hNIS RG2 xenograft (positive control) is clearly visualized in the left thigh, consistent with previous results, 25 and the wild-type RG2 xenograft (negative control) shows only background level of radioactivity.

In vivo imaging of HSP70 activation using optical and nuclear reporters. Optical and scintigraphic imaging at baseline (A) and after heat-induced HSP70 activation (B). A representative mouse bearing four subcutaneous xenografts is shown; two test RG2-pQHNIG70 xenografts are located in each of the forelimbs, a positive control (RG2-pQCNIG) xenograft is located on the left thigh (green outline), and a negative control (RG2 wild type) xenograft is located in the right thigh (blue outline). The right forelimb RG2-pQCNIG xenograft was not heated and served as an internal test–xerograph control (red outline); the left forelimb RG2-pQCNIG xenograft was heated by immersion in water at 42°C for 60 minutes 24 hours prior to the study shown in B but not heated prior to the study shown in A. Imaging was performed on consecutive days; the pertechnetate images were obtained 60 minutes after intravenous injection of 1 mCi of 99mTcO4−, and image acquisition time was 10 minutes. Note the slight difference in positioning and rotation of the animal in A and B; this accounts for the better visualization of the right arm xenograft in A and the better visualization of the left arm and thigh xenografts in B. The animal was reimaged on a dual-head X-SPECT system, and a single coronal and axial slice through the xenografts is shown (C). 124I-iodide microPET imaging of pQHNIS70 xenografts (D). The experimental paradigm and location of the xenografts were the same as those described above (a single 10-minute microPET acquisition was obtained 120 minutes after intravenous injection of 0.2 mCi 124I-iodide); two adjacent tomographic coronal and axial slices of a representative animal following left forelimb exposure to heating are shown. Immunoblot for HSP70 protein (E). RG2-pQHNIG70 xenograft tissues obtained from the animals described above were processed for immunoblot with a polyclonal anti-inducible human HSP70 antibody. Immunocytochemical analysis of endogenous human HSP70 protein expression (F). RG2-pQHNIG70 xenograft tissue obtained from the animals described above were fixed and immunostained with rabbit polyclonal anti-inducible human HSP70 antibody (IgG).
Comparison of hHSP70, hNIS, and eGFP Expression in Tumor Tissue
To assess HSP70-inducible expression in RG2-pQHNIG70 xenografts, tumors were removed 24 hours after heat shock and tissue samples were analyzed by immunoblot. HSP70 expression in RG2-pQHNIG70 xenografts was over threefold higher following local hyperthermia (42°C for 60 minutes) compared with HSP70 expression in nonheated xenografts (Figure 4E). We also compared the intensity of eGFP, hNIS, and endogenous inducible HSP70 expression by immunohistochemistry (Figure 4F). Weak reactivity of both HSP70 and eGFP was observed in the nonheated pQHNIG70 xenografts, whereas strong reactivity was detected 24 hours following heat shock of 60 minutes in the cytoplasm.
Discussion
We previously developed several inducible cis-reporting systems that included multimodal (optical and radionuclide based) reporters for noninvasive imaging in animals.28–30 The recently constructed pQCMVhNIS-IRES-GFP dual-reporter system provides both a fluorescence (optical) and a radiotracer (gamma camera, SPECT and PET) readout of reporter expression. 25 In this study, we described the evaluation of the same reporter cassette under the control of the HSP70 promoter for imaging stress (heat-induced) activation of heat shock factors (HSFs).
The HSP70 gene encodes a major stress-inducible protein, HSP70, which plays an important role in protecting cells from a variety of different physiologic stresses, including exposure to heat shock, radiation, and heavy metals. The response of eukaryotic cells to these stresses involves the expression of a large set of HSPs in addition to HSP70, varying in molecular weight from ≈20 to ≈120 kDA. In most cases, a particular HSP is identified by its molecular weight; for example, HSP70 has a molecular weight of 70 kDA. HSPs have been highly conserved throughout evolution and constitute a multi-gene family,31,32 and there is extensive sequence homology between the related 70 kDa HSP genes. At least three of these genes have been cloned and analyzed in some detail. They are referred to as HSP70A,33,34, HSP70B, 35 and HSP70C 36 genes. In humans, two hsp70 genes, hsp70-1 (HSP70A) and hsp70-2 (HSP70B), are found as a tandem pair, and this tandem gene structure is highly conserved in mammals. 37 Both genes are highly heat inducible33,35 but differ in their regulation by other inducers, such as the products of the adenovirus E1A gene. The hsp70A gene appears to be activated by E1A products,33,36 whereas the hsp70B gene is not. 38
HSP70 promoters are highly conserved and include multiple copies of a pentanucleotide motif 50-nGAAn-30 that are known as heat shock elements (HSEs). 39 The HSP70A promoter contains at least two regulatory domains, a distal domain responsive to heat shock or heavy metals and a proximal domain responsive to stimulation by serum.35,40 A 400 bp promoter from the hsp70A gene, with features described above, was chosen because of its smaller size and its commercial availability (pDRIVE01-HSP70(h)v03, InvivoGen). This promoter has been tested previously by others for its capacity to mediate heat-induced gene expression. 41 The hsp70B promoter contains three functionally important HSEs and an atypical TATA sequence. The HSP70B promoter and the HSP70B minimal promoter contain these four elements, and both promoters are capable of initiating high expression of a cis-linked downstream gene. Both promoters have been widely used in both in vitro and in vivo studies for controlled expression of reporter genes42,43 or therapeutic genes.44,45
The rationale for developing the pQHNIG70 vector was to obtain an inducible reporter system to monitor HSF1 transcriptional activation that included a human reporter gene, the hNIS. hNIS is a transmembrane glycoprotein that mediates the active transport of iodide into the thyroid (basolateral membrane of thyroidal cells) and other tissues, including gastric mucosa, salivary glands, lacrimal glands, choroid plexus, kidney epithelial cells, placenta, and lactating mammary gland.46–50 Here we show that the dual-reporter readout of the pQHNIG70 vector, both eGFP fluorescence and hNIS radiotracer uptake, is sensitive and temperature dependent. To retain functional activity of the hNIS gene product, the symporter must translocate to and be inserted within the plasma membrane of transduced cells. Therefore, we elected to construct a bicistronic unit that includes a type II IRES to ensure that the reporter gene product results in two separate native proteins. 25 The eGFP-fluorescence reporter was included to facilitate FACS sorting of the transduced cells and for fluorescence imaging of cells in culture as well as ex vivo tissue samples. This dual reporter facilitates comparative, multimodality studies that can be performed both in vitro and in vivo. The hNIS-radiotracer uptake results and the gamma camera, SPECT, and PET images demonstrate that it is feasible to translate such studies into the clinic using a human reporter gene.
Transduced RG2-pQHNIG70 cells show both a time-and temperature-dependent increase in the expression of both reporters in response to heat shock. There was a nonlinear relationship between the readout of both reporters (eGFP fluorescence vs level of radioactivity accumulation) following exposure to a range of temperatures (37–43°C), suggesting that there is little or no difference in temperature effect on post-transcriptional processing of the two gene products, the fluorescence of eGFP or localization and function of the symporter in the cell membrane, and the degradation of the two reporter proteins. A similar relationship in reporter readout was shown previously in different clones of RG2/CMVhNISIRES-GFP cells that exhibited different levels of reporter expression. 25 The temperature-dependent upregulation of reporter expression measured in the in vitro radiotracer and fluorescence studies was also shown to be correlated with the immunocytochemical and immunoblot analyses, confirming the upregulation of inducible HSP70 protein, as well as eGFP and hNIS reporter proteins.
HSF1 transcription factor protein was similarly induced by heat shock in RG2, RG2TK+, and RG2TG cell lines but was expressed at high levels in both pre- and post–heat shock in RG2-QHNIG70 cells (see Figure 3E). There is the suggestion of a “trend” in pre–heat shock HSF1 levels, increasing from wild type to RG2QNIG70, and this may reflect the effects of retroviral reporter transduction of RG2 cells. More important is the near-equimolar expression of Hsp90 and HSF1 in these samples. It is known that HSF1 regulation occurs at several levels in the cell and that HSF1 is maintained in a monomeric inactive state by binding to the molecular chaperone Hsp90 and where the HSP90 complex functions as a reversible HSF1 repressor. 51 Heat shock causes the release of HSF1 from HSP90 by a process thought to involve the sequestration of HSP90 by denatured proteins and allows the formation of an active HSF1 trimeric complex, which results in upregulation of inducible Hsp70 and reporter expression.
In animals bearing xenografts derived from RG2-pQHNIG70 cells, coexpression and visualization of the hNIS and eGFP reporters were demonstrated (dual-modality imaging). Proof-of-principle images were obtained by fluorescence and 99mTc-pertechnetate imaging using a Kodak R2000M system (see Figure 4, A and B) and by more quantitative 99mTc-pertechnetate microSPECT (see Figure 4C) and 124I-iodide microPET imaging (see Figure 4D) following exposure to heat shock. In the absence of heat shock, the baseline level of reporter signal was low (near background levels). In addition, immunocytochemical and immunoblot analyses of tissue obtained from the RG2-pQHNIG70 xenografts confirm that the upregulation of reporter readout observed in the images corresponds to upregulation of HSP70 protein, as well as eGFP and hNIS reporter proteins. These imaging results are encouraging because they further demonstrate that the expression of bicistronic vectors can be regulated effectively and proportionately over a wide range of expression levels by a cis-linked, inducible promoter. In this manner, the expression of imaging and therapeutic genes can be linked. In addition, the expression levels can be controlled or regulated by an appropriate inducible promoter, such as the HSP70 promoter, and monitored by noninvasive gamma-camera SPECT or PET.
As shown previously, 25 pertechnetate accumulation was higher than iodide in RG2-pQCNIG cells in culture and in animals bearing RG2-pQCNIG xenografts, and this observation was reconfirmed (see Figure 3). These results are similar to those reported by Van Sande and colleagues 52 ; the magnitude of accumulation of three different anions in FRTL5 cells and in hNIS-transduced COS-6 cells was in the following order: perrhenate > pertechnetate > iodide. However, they contrast with the study of Kang and colleagues, in which a different order in the magnitude of radiotracer uptake (iodide > pertechnetate > perrhenate) was observed. 53 The differences between the studies of Kang and colleagues, 53 Van Sande, and colleagues, 52 and that reported here do not appear to be due to differences in specific activity of the tracers. Furthermore, our studies involved dual-isotope, paired uptake studies in the same cells.
The identification and use of the HSP promoter to control the expression of transgenes dates back to the 1980s,35,40,54–56 and the use of HSP70 promoter elements to regulate therapeutic gene expression dates back to the 1990s.57,58 Heat sensitivity, mediated through the HSF1 transcription factor, is known to have a strong activation effect on genes cis-linked to HSP70 promoters, and this has led to the development of therapeutic applications where gene expression can be spatially and temporally controlled through the application of heat. For example, the HSP70 promoter has been used to drive the expression of toxic and suicide genes,57–62 vaccines,63,64 and cytokines,65,66 as well as humoral and cell-mediated immune responses67–70 and radiotherapy. 71 A particularly novel application of HSP70 promoters is the system developed by Moonen and colleagues. 58 This system involves the spatial and temporal control of therapeutic transgene expression using a HSP70 heat-sensitive promoter and magnetic resonance imaging–guided focused ultrasonography with real-time feedback control. 72
In the course of developing therapeutic applications involving HSP70 promoters, a wide variety of HSF-1/HSP70-inducible reporter genes have been developed; they include β-galactosidase, 73 eGFP,74,75 and luciferase.76,77 Our objective was to develop a human HSF-1/HSP70-inducible reporter gene that could potentially be used in patient studies. The results presented here demonstrated that hNIS, as a gamma camera/SPECT and PET imaging gene, demonstrates high sensitivity and good image contrast.
Footnotes
Acknowledgments
We thank Drs. Steven Larson and Pat Zanzonico (Memorial Sloan-Kettering Cancer Center) for their help and support.