
Abstract
To determine the most robust and reproducible parameters for noninvasively estimating tumor cell burden in a murine model, we used real-time in vivo bioluminescent imaging to assess the growth kinetics and dissemination of luciferase-transfected Raji B-cell lymphoma. Bioluminescent signals were acquired every minute for 40 minutes after luciferin injection every other day post-tumor injection. The total 40-minute area under the curve (AUC) of photon intensity (photons/second) was calculated and compared with simplified fixed time point observations (every 5 minutes from 5 to 40 minutes after substrate injection). There was substantial variability in the shape of the time signal intensity curves at different stages of tumor growth in both the intravenous and subcutaneous models. The coefficient of variance in the AUC was 0.27 (intravenous) and 0.36 (subcutaneous) as values determined by fitting the curve, whereas the 20-minute time point measurement varied at 0.29 (intravenous) and 0.37 (subcutaneous). In both the subcutaneous and intravenous models, single time point measurements at 20 minutes had the highest correlation value with AUC. This simplified single time point measurement appears appropriate to estimate the total tumor burden in this model, but the substantial variance at each measurement must be considered in experimental designs.
Multiple steps are involved in acquiring bioluminescent signals using an optical imaging system. Among them, injection of
Variations in the technical process may easily influence the signal of photon intensity acquired by optical imaging devices, so it would be expected to be very important to be consistent while performing the intraperitoneal injections and setting parameters (such as time after intraperitoneal injection) to ensure reproducible results. However, these parameters differ substantially in the literature.
The purpose of this study was to determine how reproducible the bioluminescent tumor signal is over time. We compared two methods (area under the curve [AUC] versus single time point) for the quantification of bioluminescence in mice administered lymphoma cells stably expressing luciferase and green fluorescent protein (GFP). We anticipated variability and expected it to be influenced by intraperitoneal injection, by the time allowed after
Materials and Methods
Transfected Cell Line
Transfected Raji Burkitt's B-lymphoma cells were established by Dr. Zhaohui Ye in collaboration with the laboratory of Dr. Linzhao Cheng at Johns Hopkins University.7,8 They were transfected with an elongation factor 1α promoter-driven luciferase and GFP using lentivirus vector. GFP expression was controlled by the internal ribosomal entry site element (Figure 1A). Stable transfected cells were selected for the GFP signal using fluorescence-activated cell sorting (FACS). Populations of cells arising from single-cell clones were generated, and selected clones were used to initiate tumors. Fluorescent microscope images show a clear GFP signal, which demonstrates stable transfection of the GFP and luciferase genes (Figure 1B). We chose this lymphoma cell line on the basis of our preliminary studies showing that it has the best growth of multiple lymphoma cell lines and would thus be suitable for therapy evaluation experiment.
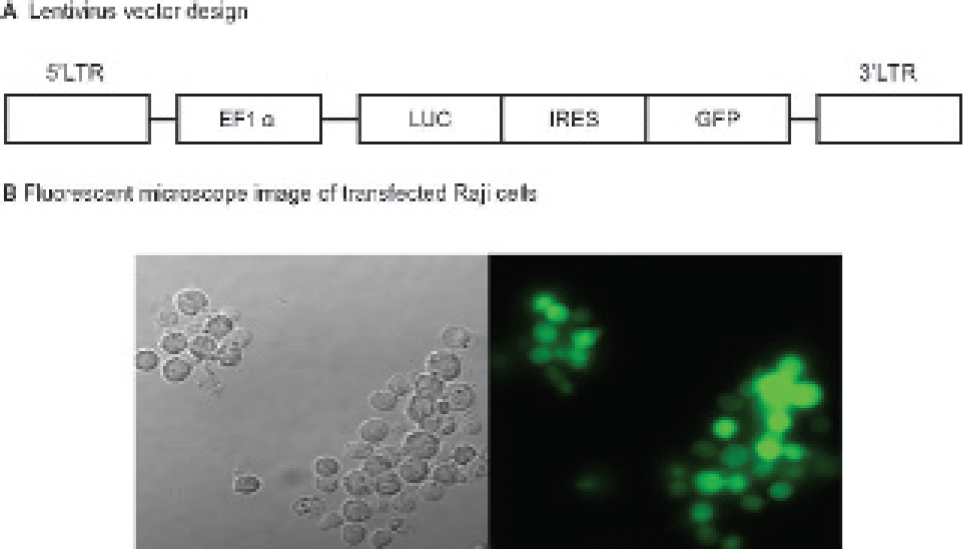
Luciferase (Luc)-green fluorescent protein (GFP) dual transfected lymphoma cells. A, Design of the lentivirus vector. Raji Burkitt's B-lymphoma cells were transfected with an elongation factor 1α (EF1α) promoter-driven Luc-GFP vector. GFP expression was controlled by an internal ribosomal entry site (IRES). Stable clonal transfected cells were selected by GFP signal using fluorescence-activated cell sorting. A population of cells arising from single-cell clones was generated, and selected clones were used to initiate tumors. Our fluorescent microscope image (B) shows a clear GFP signal in all cells (LTR = long terminal repeat).
Linearity and Sensitivity of System In Vitro
Variable numbers of luciferase-GFP-transfected Raji lymphoma cells (ranging from 50 to 1 × 10⁶ cells) were plated in 24-well plates triplicate with a total volume of 1 mL of phosphate buffered saline (PBS), pH 7.4. The cell number was determined by hemocytometer and then diluted to each cell concentration. Luciferin (150 μg/mL) was added to each well, and cells were imaged with a 60-second integration time (20 minutes after addition of substrate) using an optical imaging system (IVIS 200 Xenogen, Alameda, CA).
FACS Analysis
FACS analyses were performed to purify the transfected Raji lymphoma cells and to test the stability of luciferase-GFP gene expression. Cultured cells were washed twice with PBS and resuspended (1 × 10⁶ cells per 1 mL) in FACS buffer (0.5% bovine serum albumin in PBS). Cells explanted from animal tumor were also used for FACS analysis. To distinguish the Raji lymphoma cells from potential contamination of other cells, we stained our disaggregated tumor sample with an anti-CD20 antibody. Tumor samples from the subcutaneous tumors were homogenized and separated from each other with pipetting using 0.5% trypsin-ethylenediaminetetraacetic acid and cultured 2 days before FACS analysis. For anti-CD20 staining, cells were incubated at 37°C for 20 minutes with a Phycoerythrin (PE)-conjugated anti-CD20 antibody (BD Quantibrite, Becton, Dickinson, San Jose, CA). The signal threshold for GFP was determined by comparing it with the results of the nontransfected Raji lymphoma cells. Fluorescence intensity as mean channel fluorescence was determined for 10,000 events in the fluorescence-1 (FL-1) channel using a Becton, Dickinson FACS caliber flow cytometer.
Animal Models
This mouse model was established by the subcutaneous (SC) or intravenous (IV) injection of one million cells of luciferase-GFP dual-transfected Raji lymphoma cell lines. One million cells/mouse of luciferase-transfected Raji lymphoma cells were injected into female CB-17 SCID mice subcutaneously or intravenously (n = 6 each group). The animal model to assess the relationship between the tumor cell number and the light signal was established following the IV or SC injection of varying numbers of tumor cells (5 × 10⁵ to 2 × 10⁶ cells per animal) to relate the number of cells to the external bioluminescence.
The animals were humanely euthanized at the time point of appearance of hindleg paralysis in the IV model or at the time point when the largest diameter of tumor exceeded 1.5 cm in the SC model. All animals were housed in the animal housing facilities at least 1 week before the start of experiments. Food and water were given ad libitum. This study was performed as part of a project that was approved by the Animal Research Committee at the Johns Hopkins Medical Institutions.
Bioluminescent Monitoring In Vivo
Noninvasive, real-time, in vivo bioluminescent imaging was used to assess the growth and spread of Raji lymphoma cells in mice. Bioluminescent signals were acquired every other day from day 0 of tumor injection until day 50 with an optical imaging system (IVIS 200, Xenogen, Hopkinton, MA). In each scan, signals were acquired from the dorsal side of the prone animal every minute continuously for 40 minutes after intraperitoneal injection of
We monitored the photon signal every other day after tumor inoculation until the animals were euthanized.
Data Analysis
Photon flux (photons/s/cm2/steradian) was calculated using Living Image software (Xenogen). A single-circle region of interest either on the whole body (IV model) or around the lesion (SC model) was used. We subtracted the background signal from all data used in this study. This background signal was obtained by the imaging of animals without tumors but still given a luciferin substrate injection. The average background value of 520 photons/second/cm2 was used for background subtraction. This value was slightly higher than the background signal obtained without any animal present (411 ± 99). Data were exported as an ASCI format file and analyzed by Microsoft Excel software. For smoothing the data and all other statistical analysis, S-plus version 6.2 (Insightful Corp., Seattle, WA) was used.
Results
Linear Relationship between the Cell Number and the Bioluminescent Signal
Figure 2A shows the linear relationship between the cell number and the bioluminescent signal.
The minimum number of cells that can be reliably and quantitatively detected in vitro with this system is 500 cells/well using a 24-well plate with a final luciferase concentration of 150 μg/ml (total 1 mL). Although 100 cells could be detected versus zero, there were overlaps in the low signal between 100 and 250 cells (data not shown). Correlation between cell number and bioluminescent signal was also evaluated under in vivo conditions. Figure 2B shows the signal from mice just after they received a variable number of luciferase-transfected Raji lymphoma cells by IV and SC injection (20 minutes after substrate injection). There was a linear correlation between the cell number and the bioluminescent signal in both in vitro and in vivo conditions.
Stability of the Bioluminescent Signal
We evaluated the stability of the GFP gene expression level by FACS using cells that were in continuous culture for 6 weeks with RPMI 1640 media and compared them with cells explanted from animals 6 weeks after tumor injection (SC).
In cultured conditions, more than 97% of the cells remained GFP positive.
More than 90% of the CD20-positive cells explanted from animal tumors were GFP positive. This indicates that the population of CD20-positive Raji cells that expressed luciferase was at least 90%. In addition, animals injected with tumor demonstrated exponential growth as expected. Figure 2, C and D, shows the results of the total 40-minute AUC of light signal (photons/second with logarithmic scale) versus time (days) after tumor injection. Exponential signal growth was observed 8 to 10 days after tumor injection in both IV (see Figure 2C) and SC (see Figure 2D) tumor models. These findings correspond to the logarithmic phase of tumor cell growth and are also consistent with continual luciferase-GFP expression in the living animals.
Change in Time Intensity Curves
Figure 3 shows representative bioluminescent images and the time course of the luciferase signal following the intraperitoneal injection of

The linear relationship between the cell number and the bioluminescent signal. Both the in vitro (A) and in vivo (B) results indicate a linear relationship between the two values. Total area under the curve values versus days after tumor injection of all 12 animals used in this study are shown in C and D. Exponential tumor growth was seen 8 to 10 days after tumor injection in both the intravenous (I.V) (C) and subcutaneous (S.C) (D) models.
Reproducibility of Photon Signal Intensity
Figure 4, A and B, shows representative results of the photon intensity value versus days after tumor injection in the same animal. The longitudinal scale is displayed as a logarithmic number, and the smoothed curve was calculated by the Loess smoothing method. Some data points were dropped from the smoothed curve because there was low signal output, probably owing to a poor intraperitoneal injection of
Because there is evidence of day to day variation in the bioluminescent signal from each animal, we used the sequential daily data from each time point in each animal to calculate an animal-specific growth curve. Variances from this curve were calculated. Figure 4, C and D, shows the percentage of the measured photon signal (AUC) compared with the estimated values from the smoothed curve. The AUC was 106.6 ± 29.2% coefficient of variation (CV) = 0.27 (IV) and 99.9 ± 35.6% CV = 0.36 (SC) of the estimated value determined by smoothing, whereas the 20-minute time point measurement was 105.8 ± 30.6% CV = 0.29 (IV) and 97.3 ± 37.2% CV = 0.37 (SC). There was no statistically significant difference in variance between the AUC and the 20-minute time point measurement.
Values lower than 50% of the expected value were seen in 3 of 81 (3.7%) of the signals for the IV model and in 4 of 110 (3.6%) of the signals for the SC model in both the AUC and 20-minute measurements. This is likely due to unsuccessful

Change in the time intensity curve in the same animal. These curves are based on data obtained continuously for 40 minutes after substrate (

Representative results of photon intensity values versus days after tumor injection in two animals. A longitudinal scale is displayed as a logarithmic number. A smoothed curve calculated by the Loess smoothing method is also shown as a solid line. Some data points have been dropped from the smoothed curve (arrows) since these are most likely due to an unsuccessful intraperitoneal injection (A and B). The percentage of measured photon signal compared with the estimated value from smoothed curve to fit all the data (C and D). The average of percentage, standard deviation, and coefficient of variation for the intravenous (i.v) model are 106.63, 29.2, and 0.27, respectively, and for the subcutaneous (s.c) model are 99.89, 35.63, and 0.36. Values lower than 50% of the estimated value were observed 3.7% (3 of 81; IV) and 3.6% (4 of 110; SC), most likely owing to an unsuccessful
Comparison of AUC with Fixed Time Measurements
To obtain the correlation between the fixed time point measurements and the AUC values, multiple correlation coefficients were calculated in both tumor models at multiple stages (days after tumor injection) of tumor growth (IV: early, days 5-10; middle, days 11-20; and late, after day 21) (SC: early, days 5-18; middle, days 19-29; and late, after day 30). This staging was determined according to the growth curve of the bioluminescent signal to divide the whole observation period into three stages, in which tumors in the IV model grew faster than in the SC model. An example of the multiple correlation coefficients obtained between the fixed time point measurement of photon intensity and the total AUC is shown in Figure 5 (IV model). The correlation is lower at 5 minutes (R2 = .9134; Figure 6A) than at 20 minutes (R2 = .9975; Figure 6B). The correlation also varies by stage of tumor growth. The best correlation is seen during the early stage (lower signal area in Figure 5A).
The values from the early, middle, and late stages of tumor growth were also calculated separately and plotted (see Figure 6). In both models, the correlation appears to be low in the early and late time points and high at approximately 15 to 30 minutes (> 0.95). The highest correlation was seen at 20 minutes after substrate injection in both models (IV, 0.9975; SC, 0.9973). These values were as high as the value that was calculated at the peak of each curve (IV, 0.9965; SC, 0.9960).
Discussion
Bioluminescent imaging is increasingly applied in pre-clinical model systems, including cancer therapy. Unlike imaging methods using x-ray or radioactive material, attenuation of the bioluminescent signal by the animal's body is not negligible. The signal depends on the depth of the tumor location and on the thickness or color of the animal's skin. Although it is difficult to predict the exact number of tumor cells from the bioluminescent signal alone, the signal is well related to the total number of tumor cells in vivo provided that we measure these signals from a fixed direction with respect to the animal's orientation.
A linear relationship between cell number and bioluminescent signal was observed in both in vitro and in vivo conditions. In addition, expression of the luciferase-GFP signal was stable. For these reasons, this system appears to be suitable for tracking tumor burden under noninvasive conditions.

Comparison between a fixed time measurement and a total of 40 minutes for the area under the curve (AUC). In the intravenous (IV) model, the multiple correlation coefficients between a fixed time point measurement of photon intensity and the total AUC is lower at 5 minutes (R2 = .9134; A) than at 20 minutes (R2 = .9975; B). The correlation also varies by the stage of tumor growth. The best correlation is seen during the early stage (lower signal area in A).
Efficient design of such studies requires a firm understanding of the variability of the imaging method. In fluorodeoxyglucose-positron emission tomography measurements of tumor glycolysis in vivo, reproducibility of simplified single time point measurements is often preferred as they are more reproducible than some more complex dynamic curve fitting methods. 9 In this study, we compared a “full dynamic” bioluminescent time course imaging study with simple, single-time point measurement to better understand how to most efficiently use this method in tumor growth and treatment studies.
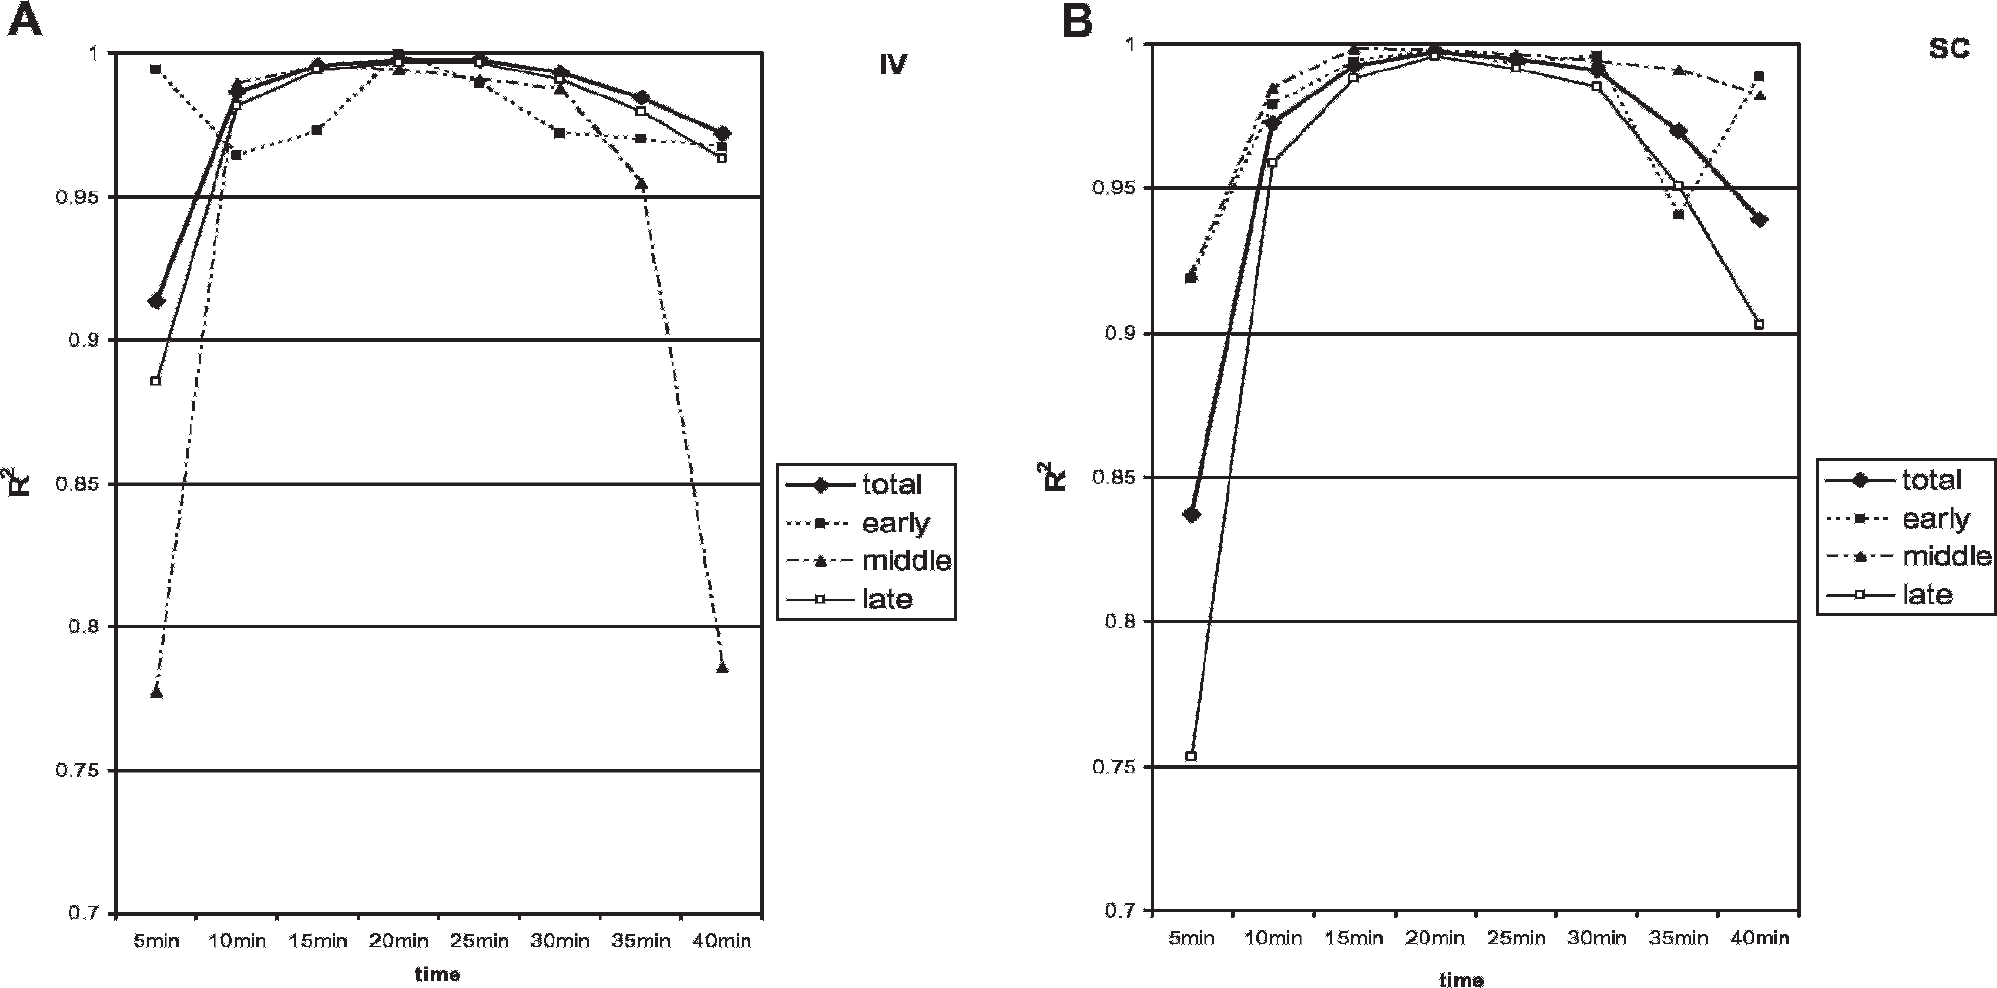
A and B show multiple correlation coefficient values versus the total area under the curve in both models. The values from the early, middle, and late stages of tumor growth were calculated separately and plotted. In both models, the correlation appears to be low at the early and late time points and high at approximately 15 to 30 minutes (> 0.95). The highest correlation was seen at 20 minutes after substrate injection in both models (intravenous, 0.9975; subcutaneous, 0.9973).
Many studies of bioluminescent tumor imaging have reported using between 5 and 20 minutes after substrate injection for image acquisition.3,10 Different researchers often use substantially different parameters. The kinetics of the luciferase signal should be taken into account because the signal can change significantly by the location of the tumor and the time after substrate injection.
11
To assess the total amount of light signals from each animal, it would be preferable to obtain all light signals for the duration of time that the cells emit light. Because of time limitations, we calculated the AUC of the bioluminescent signal from 1 to 40 minutes after substrate injection and used these values as the gold standard in this study. Our results in both models show that when plotted against the AUC, the highest correlation coefficient value was observed at 20 minutes after intraperitoneal
To assess the variability of day to day measurements, we use a mathematical smoothing model to estimate the overall growth curve. Among the several mathematical models we evaluated, curve smoothing was the best way to fit our signal data. Abnormally low values of photon intensity below the predicted value from the smooth curve may represent an unsuccessful measurement. Approximately 4% of our in vivo bioluminescent measurements had a value of lower than half of the estimated value and were regarded as unsuccessful, most likely owing to a technical problem with the intraperitoneal injection. The reason for most of the unsuccessful injections is thought to be the result of an intrabowel injection. The degree of signal drop from the estimated one was a valuable guide suggesting a partially successful intraperitoneal injection. The measurement of a sequential series of photon signals appears to be a good model for evaluating the reproducibility of intraperitoneal injections.
The reproducibility of the bioluminescent signal in our model was relatively low. CVs for the IV and SC tumor models were 0.27 and 0.36 (AUC) and 0.29 and 0.37 (20 minutes), respectively. In addition to technical errors associated with intraperitoneal substrate injection, exponential growth of the tumor may be another reason for this low reproducibility. There are limitations in using mathematical methods to accurately follow the growth kinetics of tumors. If the bioluminescent signals were measured using an animal whose tissues expressed the luciferase gene stably, this would likely result in better reproducibility.
We found that the shape of the time intensity curve varied with the stage of tumor growth. This change is likely due to changes in blood accessibility to the tumor. High access to blood means high access to substrate, and this results in a higher correlation with the AUC.
In IV models, the tumor cells are spread throughout the whole body in the early stages and have a higher accessibility to blood. The high correlation coefficient value with the AUC at the time points of 5 or 10 minutes in Figure 6A supports this hypothesis. In the middle or late stages of tumor growth, tumors are likely to be localized as solid mass lesions. Accessibility to blood will decrease at this stage and result in decreased correlation to the AUC.
In the SC models, the tumor cells grew in a more localized area and seem to have lower accessibility to blood. In fact, throughout all stages of tumor growth, the R2 value is low at time points less than 10 minutes. The higher correlation coefficient value at later times after substrate injection tends to suggest diminished accessibility of
Measurements of photon intensity using an optical imaging system are greatly influenced by the injection method. The intensity of photon emission will change over time after substrate injection. The best single time point for assessing the total number of tumor cells in our model appears to be 20 minutes after substrate injection.
To rationally use an imaging method to assess sequential change in tumor growth and to see tumor treatment effect, knowledge of the reproducibility of the method is required so that we can determine what degree of change in signal intensity is expected to be significant. In conclusion, in this model system, the variability of bioluminescent measurements of tumor growth in vivo is substantial. However, a simplified 20-minute single- time point postinjection method is an acceptable alternative to more complex dynamic methods. Knowledge of such test variability is crucial to rational experimental design and data analysis.
Footnotes
Acknowledgments
We thank Julia W. Buchanan for her helpful linguistic assistance.