Bioluminescence imaging (BLI) of luciferase reporters in small animal models offers an attractive approach to monitor regulation of gene expression, signal transduction, and protein-protein interactions, as well as following tumor progression, cell engraftment, infectious pathogens, and target-specific drug action. Conventional BLI can be repeated within the same animal after bolus reinjections of a bioluminescent substrate. However, intervals between image acquisitions are governed by substrate pharmacokinetics and excretion, therefore restricting temporal resolution of reinjection protocols to the order of hours, limiting analyses of processes in vivo with short time constants. To eliminate these constraints, we examined use of implanted micro-osmotic pumps for continuous, long-term delivery of bioluminescent substrates. Pump-assisted d-luciferin delivery enabled BLI for ⩾ 7 days from a variety of luciferase reporters. Pumps allowed direct repetitive imaging at < 5-minute intervals of the pharmacodynamics of proteasome- and IKK-inhibiting drugs in mice bearing tumors stably expressing ubiquitin-firefly luciferase or IκBα-firefly luciferase fusion reporters. Circadian oscillations in the olfactory bulbs of transgenic rats expressing firefly luciferase under the control of the period1 promoter also were temporally resolved over the course of several days. We conclude that implanted pumps provide reliable, prolonged substrate delivery for high temporal resolution BLI, traversing complications of repetitive substrate injections.
BIOLUMINESCENCE IMAGING of luciferase reporters is a well-accepted strategy to access a myriad of molecular and cellular events in vitro, in live cells, and in vivo.1 This noninvasive imaging modality provides a relatively simple, robust, cost-effective, and extremely sensitive means to image fundamental biologic processes in vivo owing to exceptionally high signal to noise levels.2 Compared with fluorescence imaging of genetically encoded fluorescent proteins (eg, green fluorescent protein and its red-shifted analogues), bioluminescence imaging provides a greater level of sensitivity, the capacity for photon quantification, and superior temporal resolution (owing to shorter protein maturation and half-life times) and is not prone to photobleaching of the reporter. However, in contrast to imaging of fluorescent proteins in which fluorescence is intrinsically produced by the reporter without the need for an exogenous substrate, bioluminescence imaging remains dependent on substrate pharmacokinetics. Historically, luciferase reporters were used for analysis of transcriptional activity in cellulo and in vivo (wherein the luciferase gene is cloned downstream of a promoter or regulatory element of interest)3–6 and for cell tracking and tumor growth experiments in vivo (wherein the cells of interest are tagged with a constitutively active luciferase reporter).7,8 In these types of experiments, the bioluminescent readout is dependent on transcription/translation of the reporter or on cell proliferation and compartmentalization, respectively. These events take place on the order of hours to days; therefore, systemic bolus reinjections of the bioluminescent substrate (eg, D-luciferin) at intervals that are longer than the excretion time of the substrate (typically 4–6 hours for d-luciferin) are experimentally acceptable (Figure 1A). However, we and others are using luciferase fusion reporters for analysis of biologic processes in vivo with significantly shorter time constants (on the order of minutes).9–14 For example, tetraubiquitinylated luciferase for analysis of proteasomal function,11 luciferase reporters fused to ubiquitination targets for analysis of substrate-specific proteasomal degradation,14,15 and split luciferase fragments fused to interacting protein members for analysis of protein-protein interaction by reporter fragment complementation12,13 enable rapid signaling cascades to be observed in real time.1 Here, changes in bioluminescence upon drug treatment or ligand stimulation are not dependent on transcription/translation of the reporter and therefore occur within minutes to hours. In such cases, where dynamic responses are shorter than the substrate excretion time, repetitive systemic bolus reinjections of substrate cannot temporally resolve the rapid onset of induced protein degradation or protein-protein interactions in vivo.
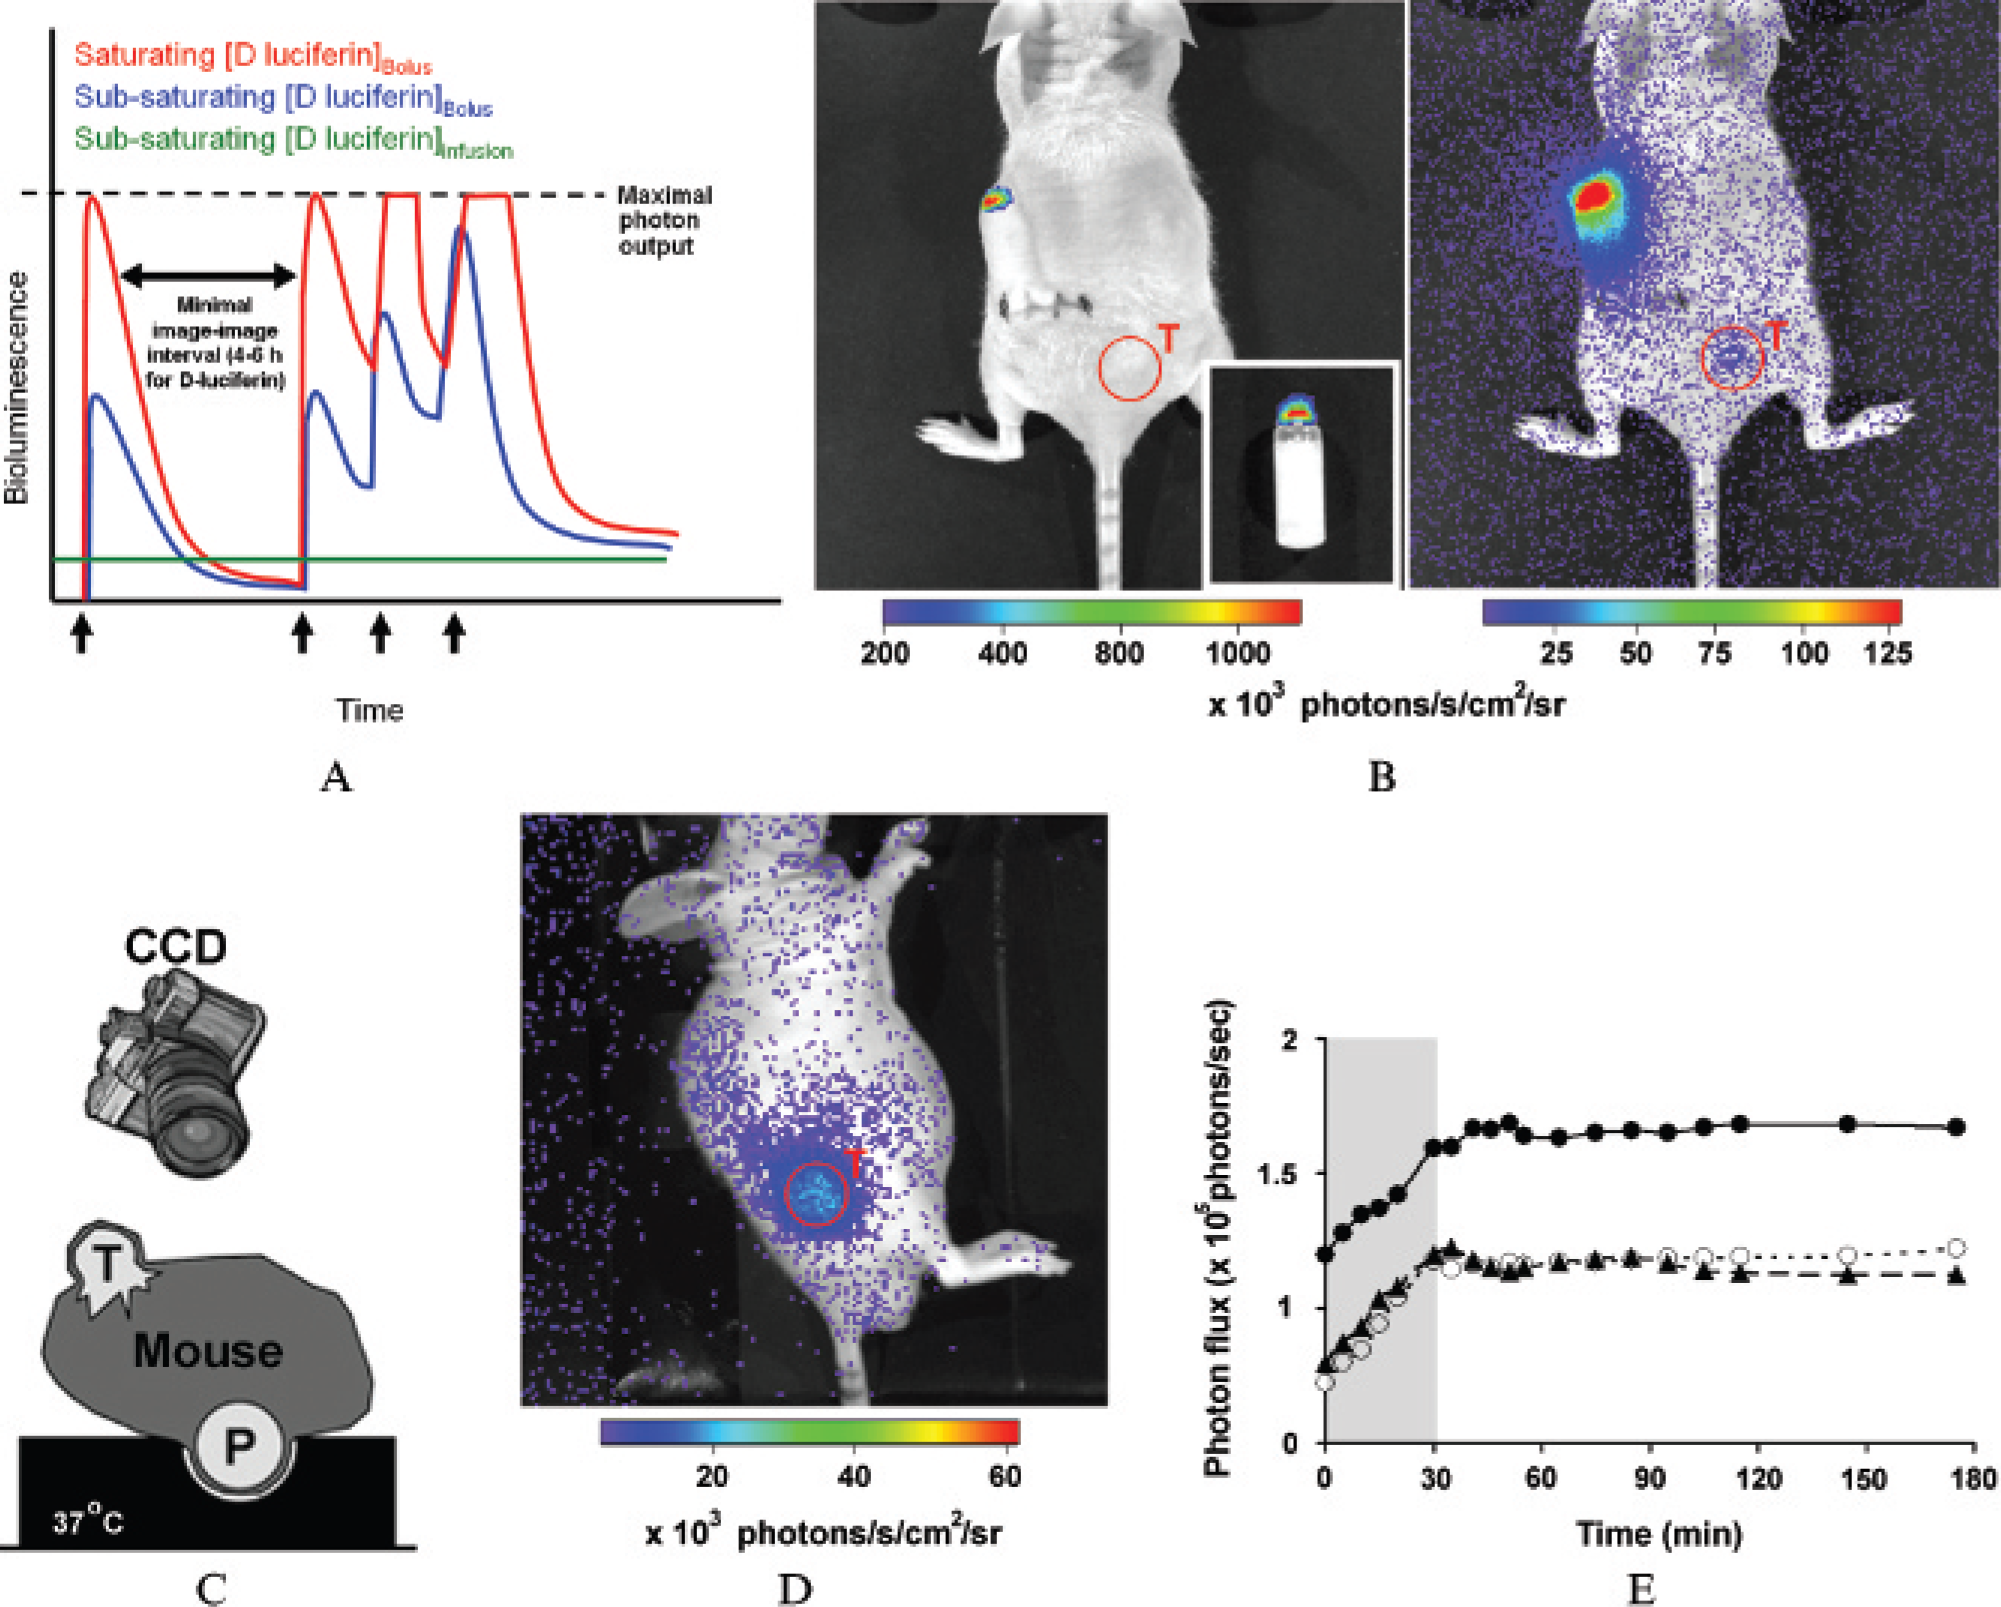
Optimization of imaging conditions with continuous delivery of d-luciferin. A, A schematic showing the hypothetical bioluminescence output of a FLuc reporter in an animal model following delivery of D-luciferin by osmotic pumps (green line) compared with serial bolus injections (black arrows) when d-luciferin saturation is achieved (red line) or not achieved (blue line) within the target cells. Pump-assisted delivery enables stable but decreased signal intensity, thus allowing continuous on-line imaging, with each mouse serving as its own baseline control. B, Left panel: Bioluminescence imaging of the dorsal surface of a HeLaFLuc tumor-bearing mouse with an implanted d-luciferin-loaded pump. Note the high phosphorescence emitted from the white cap of the pump, both in vivo and in an empty pump ex vivo (inset). Right panel: Same image as in the left panel, but photon flux was thresholded differently to show tumor bioluminescence. Note that the phosphorescence emitted from the cap is ≈150 times greater than background flux. C, A schematic showing a cross section of a tumor-bearing mouse on a foam cast with an indentation. D, When the mouse is placed lateral so that the pump fits in the indentation, no phosphorescence is detected by the charge-coupled device (CCD) camera. E, Bioluminescence emitted from three individual HeLaFLuc tumor-bearing mice implanted with d-luciferin-loaded pumps and continuously monitored for 4 hours in the IVIS 100 imaging system (37°C). Note that it takes ≈30 minutes for the signal to stabilize when imaging at an ambient temperature of 37°C. P = pump; T = tumor.
Moreover, even in cases in which the luciferase reporter is transcriptionally regulated, it is desirable to ensure constant D-luciferin levels so that changes in reporter activity accurately reflect physiologic fluctuations and not substrate abundance. This is critical when expressions of protein levels oscillate, as with circadian clocks (eg, per116), inflammation (eg, IκBα17,18), cell cycle control (eg, Cdc219), and cell survival (eg, p5320,21). Here systemic bolus reinjections of bioluminescent substrate could result in errors and irregularities owing to complex pharmacokinetics and variable d-luciferin levels.
Although bioluminescence hypothetically reaches maximal values when d-luciferin levels saturate luciferase (ie, [d-luciferin] ≪ Michaelis constant [Km]), it can be difficult to ensure that D-luciferin levels are saturating within target cells. In fact, conventional dosing of d-luciferin results in subsaturating levels in target cells in vivo.22 Furthermore, oxyluciferin, the oxidation product of d-luciferin by firefly luciferase, is known to inhibit luciferase activity.23 Taken together, and as previously demonstrated,22 if d-luciferin levels in the target cells are subsaturating and intervals between injections are shorter than the excretion and metabolism time for d-luciferin (≈4–6 hours), this will result in nonlinear increases in bioluminescence output after each reinjection, even when the underlying reporter is stable (see the blue line in the schematic in Figure 1A).
Theoretically, one can determine the net physiologic effect in vivo regardless of substrate pharmacokinetics by using a variety of normalization techniques. For example, normalizing photon output to different spectrally or substrate-resolved luciferases was previously demonstrated to be feasible in vitro,24 in cellulo,24 and in vivo14 (eg, click beetle red and green luciferases that both use d-luciferin as their substrate or Renilla and firefly luciferases that use coelenterazine and d-luciferin as substrates, respectively). Alternatively, if bioluminescence originates from an implanted tumor xenograft, one may implant a second tumor xenograft expressing unfused, constitutively active luciferase for normalization and express the data as a ratio of the regulatable over the unregulatable luciferase emissions at any given time point. However, normalizing in real time the output to a different substrate-resolved luciferase currently is impossible in vivo owing to the different pharmacokinetics of d-luciferin and coelenterazine. In contrast to cells in culture, normalizing to a different spectrally resolved luciferase in vivo is not feasible owing to the depth dependence of the spectral output. Furthermore, normalizing to a second source (tumor xenograft) expressing unregulatable luciferase in vivo is highly challenging owing to differences in perfusion, oxygenation, and metabolism between the two tumors. The simplest solution would be to maintain D-luciferin levels constant over the dynamic response times of the imaging experiment.
In this study, we characterized the use of implantable micro-osmotic pumps to continuously deliver the bioluminescent substrate d-luciferin into reporter animals. This method allowed each animal to serve as its own control, eliminated the need for multiple injections of substrate or the need to normalize substrate levels against a standard, and supported continuous, high temporal resolution imaging for many days. After optimizing the experimental conditions to achieve a stable and readily detectable signal, we demonstrate the applicability of such a strategy for true real-time bioluminescence imaging using two established reporter mouse models for pharmacologic inhibition of the proteasome11 and IκBα kinase (IKK)14 and a rat model for analysis of circadian oscillations of the period1 gene.16
Materials and Methods
Materials
Bortezomib and PS-1145 were gifts from Millennium Pharmaceuticals (Cambridge, MA). Bortezomib was provided as a 1:10 (w:w) mixture with mannitol and diluted with saline before use. PS-1145 powder was suspended in methylcellulose (0.5% w/v) for oral administration. d-Luciferin was from Biosynth (Naperville, IL).
Real-Time Pharmacodynamic Analysis in Mice
Animals and Tumor Xenograft Models
Animal protocols were approved by the Animal Studies Committee at Washington University School of Medicine. HeLa human cervical cancer cells stably expressing pGL3 codon-optimized firefly luciferase (FLuc),14 IκBα-Fluc,14 or tetra-ubiquitin-FLuc (4XUb-FLuc)11 were subcutaneously injected (2 × 10⁶ cells) onto the back of 6-week-old male NCr nu/nu nude mice (Taconic Farms, Germantown, NY) to form tumor xenografts.
Preparation and Surgical Implantation of Pumps
When tumors reached a diameter of ≈5 to 7 mm, micro-osmotic pumps (Alzet Model 1007D, 0.5 μL/h release rate, 100 μL reservoir; Durect, Cupertino, CA) were loaded with d-luciferin (50 mg/mL in sterile phosphate-buffered saline [PBS]) under aseptic conditions according to the manufacturer's instructions. Loaded pumps were surgically implanted (subcutaneously) in the dorsal neck fat pad. Incisions were sutured and topically treated with triple antibiotic ointment (Taro Pharmaceuticals, Bramalea, ON).
Bioluminescence Imaging and Drug Administration
Mice bearing HeLaFLuc, HeLaIκBα-FLuc, or HeLa4XUb-FLuc tumor xenografts were allowed to recover from the surgical implantation of the pumps for 48 hours prior to imaging. Before and during imaging, mice were anesthetized by isoflurane inhalation. To assess the potential influence of ambient temperature on reporter activity, mice were positioned in the IVIS 100 imaging system (Xenogen, Alameda, CA; exposure time 180 seconds; binning 4; no filter; f/stop 1; field of view [FOV] 10 cm) and images were collected every 5 minutes for 3 hours. We considered the animals and the pumps to be appropriately thermoequilibrated when the signal exhibited stability for at least 2 hours.
We next imaged tumor bioluminescence using the IVIS with these optimized acquisition parameters at the indicated time points approximately 2 hours before and after oral administration (by gavage) of PS-1145 (50 mg/kg body weight [BW]) or after intravenous administration of bortezomib (1 mg/kg BW) or after vehicle (35 mg/mL mannitol in saline). In experiments in which mice were removed from the IVIS imaging system between image acquisitions, prior to each acquisition, mice were allowed to thermoequilibrate in the IVIS system for 30 minutes.
Western Blot Analysis
Four mice bearing HeLaIκBα-FLuc tumors were administered bortezomib (1 mg/kg BW, intravenously) or vehicle. At 0 (no drug), 30, 60, and 90 minutes, mice were euthanized and tumors were excised, snap-frozen, homogenated in lysis buffer (HEPES 20 mM, dithiothreitol [DTT] 2 mM, NaF 10 mM, Na3VO4 1 mM, β-glycerolpho-sphate 10 mM, NP-40 0.5% [v/v] and complete protease inhibitor cocktail [Roche, Indianapolis, IN], pH 7.8), and sonicated. Homogenates were equilibrated for protein content by bicinchoninic acid (BCA) assay (Pierce, Rockford, IL). Proteins were resolved by a precast 7.5% sodium dodecyl sulfate-polyacrylamide gel electrophoresis (SDS-PAGE) (Biorad, Hercules, CA), transferred to a nitrocellulose membrane and probed with an anti-IκBα antibody (Santa Cruz Biotechnology, Santa Cruz, CA).14
Longitudal Monitoring of Circadian Oscillations in Rats
Pump Implantation and Olfactory Bulb Window Surgery
Animal protocols were approved by the Animal Studies Committee at Washington University. Adult male transgenic Japanese Wistar rats expressing the FLuc gene under control of the period1 promoter16,25 were raised in a light-dark cycle with 12 hours of light and 12 hours of dark. One or 2 days prior to imaging, rats were anesthetized with 75 mg/kg ketamine hydrochloride (Ketaset, Fort Dodge Animal Health, Fort Dodge, IA), 0.5 mg/kg medetomidine hydrochloride (Domitor, Pfizer, Exton, PA), and 3 mg/kg of Baytril (Bayer, Shawnee Mission, KS), and, subsequently, one or two micro-osmotic pumps (Alzet, models 2001, 200 μL reservoir, or 2ML1, 2,000 μL reservoir) were implanted into their peritoneal cavities. Model 2001 pumps (release rate 1 μL/h) contained 30, 78, or 90 mg/mL of D-luciferin in sterile PBS (pH 7.2), whereas model 2ML1 pumps (release rate 10 μL/h) contained 30 mg/mL of d-luciferin. Subsequently, rats were enucleated, and an agarose/glass window was installed above the olfactory bulbs (OBs) as previously described.16 Briefly, a hole was drilled into the dorsal skull and about 0.25 cm2 of bone was removed to expose the entire OB. The hole was filled with 1.5% agarose (Sigma) and sealed with a small cover glass, which was then glued to the skull with dental cement (TEETS “Cold cure,” A-M Systems, Sequim, WA). To secure it firmly on the skull, two stainless steel screws, which had been glued to the skull with quick bond, one anterior and one posterior of the OB window, were molded into the cement. Anesthesia was reversed with 1 mg/kg atipamezole hydrochloride (Antisedan, Pfizer, Exton, PA), 0.05 mg/kg buprenorphine (Buprenex, Reckitt Benckiser Pharmaceuticals, Richmond, VA), and 3 mL of lactated Ringer's solution. Rats were allowed to recover for 24 to 48 hours and received an additional injection of buprenorphine and Baytril every 24 hours.
OB Bioluminescence Imaging In Vivo
On the day of imaging, rats were anesthetized with 3% isoflurane vaporized in O2 at 07:00 (the time when lights went on in the previous light-dark cycle, ie, circadian time 0) and their heads were imaged for 1 or 5 minutes using the IVIS 100 (binning 2; no filter; f/stop 1; FOV 10 cm). Rats were then allowed to wake up and move freely until the next imaging session. The imaging procedure was repeated every 4 to 8 hours for 48 hours.
Monitoring D-Luciferin Washout
To determine the d-luciferin turnover rate in the body, the pump of one rat (model 2001, 30 mg/mL luciferin, 1 μL/h) was removed after 48 hours of imaging. Three hours following pump removal, imaging was continued at irregular intervals for another 20 hours.
Correlating D-Luciferin Release Rate and Bioluminescence
To investigate the relationship between pump-mediated d-luciferin release and measured bioluminescence, release of d-luciferin was calculated from pump specifications (expressed as mg/h/kg) and correlated with the mean bioluminescence output for each rat.
Data Analysis
Pseudocolor images obtained with the IVIS system were analyzed using Living Image (version 2.50; Xenogen, Alameda, CA) and Igor (Wavemetrics, Portland, OR) software. Cosmic rays and background noise were automatically subtracted from the images. Total bioluminescence emitted from regions of interest, manually drawn over the area of tumor xenografts or OB, was measured as photons/s at each time point. Background measured in an area off the animals was subtracted to obtain corrected total photon flux.
Results and Discussion
Optimizing Experimental Conditions for Pump-Assisted Bioluminescence Imaging in Mice
We initially sought to optimize the image acquisition conditions while d-luciferin was continuously delivered via a micro-osmotic pump. d-Luciferin (50 mg/mL)-loaded pumps (with a release rate of 0.5 μL/h) were implanted in the dorsal fat pad of six mice bearing HeLaFLuc tumor xenografts (≈5–7 mm in diameter). We noticed that 2 days after implantation, the white plastic cap of the pump phosphoresced significantly (see Figure 1B, left panel). Typical photon flux values emitted by the caps were approximately 150 times background flux (see Figure 1B, right panel). To overcome this, we designed a black foam cast with an indentation to fit the pump (see Figure 1C, schematic). We placed mice with the pump hidden within the indentation to eliminate bleed-through emission from the pump (see Figure 1D). Although this placed restrictions on available imaging positions for the mice, masking cap noise significantly improved overall image quality. Sequential imaging of these mice (0–3 hours) at 37°C revealed a rapid increase in bioluminescence that stabilized after ≈30 minutes (see Figure 1E). Although photon flux was different from mouse to mouse, the time to signal stabilization was fairly constant (≈30 minutes). In contrast to 37°C, hairless mice anesthetized at room temperature for 10, 30, or 60 minutes before imaging showed no correlation between the time spent anesthetized at room temperature and the time required for the signal to stabilize. We concluded that thermal equilibration of the pumps and the mice in the IVIS system minimized environmentally driven variation in the bioluminescent signal. Notably, thermal equilibration may be needed only when imaging structures that will change temperature with the environment (eg, structures near the skin in hairless mice).26 Given that we used hairless NCr nu/nu mice, animals were allowed to thermoequilibrate in the IVIS system for 30 minutes at 37°C prior to initiation of an imaging sequence.
We next determined the raw bioluminescence output following pump-mediated delivery, compared with conventional bolus delivery of D-luciferin (150 mg/kg BW intraperitoneally, with an injection to imaging interval of 10 minutes). Three HeLaFLuc tumor-bearing mice were implanted with D-luciferin-loaded pumps (model 1007D) and imaged 48 hours after pump implantation. Pumps were then removed, and 24 hours later, mice were injected (intraperitoneally) with d-luciferin and imaged (data not shown). The FLuc-expressing tumors produced 70- to 150fold higher bioluminescence upon bolus intraperitoneal injection of D-luciferin (ie, > 107 photons/s/cm2/sr) compared with pump-assisted delivery. Nonetheless, pump-assisted delivery still produced continuous photon flux values greater than 10-fold over background. Of course, pumps with higher release rates would be expected to further increase photon flux above background levels. Future refinement might include use of nonphosphorescent cap material in the manufacture of the pumps.
Imaging Inhibition of Total Proteasomal Degradation
We next employed implanted pumps to image in real time the pharmacologic inhibition of total proteasomal activity in vivo. We previously reported that a tetra-ubiqitinated firefly luciferase (4XUb-FLuc) reporter can be used to image total proteasomal activity in live cells and in vivo.11 The ratio of bioluminescence of 4XUb-FLuc over FLuc-expressing tumors after intraperitoneal bolus injection of d-luciferin enabled determination of the potency and time dependency in vivo of the proteasome inhibitor bortezomib. However, because d-luciferin excretion time is longer than 4 hours, determination of the initial (0–4 hours) rate of inhibition (as reflected by an increase in 4XUb-FLuc to FLuc ratios) had to be calculated in these experiments from averages of different animals imaged at various time points after the initial intravenous administration of bortezomib. Ideally, such analyses could be improved by use of the same animals as their own controls in a temporally unrestricted manner. To complement our previous results, we therefore used pump-assisted delivery of d-luciferin to calculate the initial rate of total proteasomal inhibition after bolus intravenous injection of bortezomib. d-Luciferin- (50 mg/mL) loaded pumps were implanted into mice bearing both HeLa4XUb-FLuc and HeLaFLuc tumors. Forty-eight hours following pump implantation, mice were anesthetized, placed in the IVIS system for 30 minutes, and injected with either vehicle or bortezomib (1 mg/kg BW, intravenously). Imaging was initiated immediately after drug administration and continued for 5 hours, at 15-minute intervals. We found a time-dependent increase in the bioluminescence of HeLa4Ub-FLuc tumors that was not observed in HeLaFLuc control tumors (Figure 2A and supplementary movie 1 [movie with online version only]).* The ratio of bioluminescence emitted from HeLa4XUb-FLuc over HeLaFLuc tumors (Figure 2B) shows a significant increase in the 4XUb-FLuc/FLuc ratio (> 50% over controls) as early as 120 minutes after administration of bortezomib. The kinetics observed in vivo were comparable to published in vitro results.11 We therefore conclude that on intravenous injection, bortezomib acts rapidly to inhibit the 26S proteasome in tumors in vivo, at rates not previously resolved.
Real-time imaging of inhibition of total proteasomal activity: HeLa4XUb-FLuc and HeLaFLuc tumor xenografts (A; upper and lower tumors, respectively) were established in NCr nu/nu mice. d-Luciferin-loaded pumps (release rate = 0.5 μL/h) were implanted ≈3 weeks postinoculation of the reporter cells. Twenty-four hours following pump implantation, mice were treated with vehicle or bortezomib (1 mg/kg body weight, intravenously; time = 0 minutes) and imaged for 5 hours using the IVIS 100 imaging system. A, Representative image sequence presenting photon flux after bortezomib treatment (color coded) overlaid on black and white images of the mouse. B, Quantitative analysis of photon flux ratio (4XUb-FLuc/FLuc) as a function of time postinjection of bortezomib (closed circles; n = 3) or vehicle (open circles; n = 2). Data were normalized as fold-initial; bars represent ± standard error of measurement. Please also refer to supplementary movie 1 online.
Imaging Inhibition of Substrate-Specific Proteasomal Degradation
We previously demonstrated that bioluminescence emitted from the reporter cell line HeLaIκBα-FLuc is proportional to the protein levels of the reporter IκBα-FLuc and accurately recapitulates the levels of endogenous IκBα in cellulo and in vivo.14 Because IκBα degradation by the 26S proteasome is a key event in the canonical pathway of nuclear factor κB (NFκB) activation,27 these reporter cells are suitable for analyzing biologics or drugs that act on targets that affect IκBα degradation (eg, IκBα kinase [IKK] and the proteasome).
To analyze in vivo the IκBα-specific pharmacodynamics of the proteasome inhibitor bortezomib in real-time, we imaged IκBα-FLuc-driven bioluminescence in tumor xenografts before and after drug administration. Xenografted nude mice with implanted pumps were anesthetized, placed for 30 minutes in the IVIS system for thermoequilibration, and injected intravenously with bortezomib (1 mg/kg BW). Bortezomib induced a time-dependent increase in the bioluminescence of HeLaIκBα-FLuc tumors (Figure 3A and supplementary movie 2 [movie with online version only]), which was not seen in control (HeLaFLuc) tumors (Figure 3B and supplementary movie 2). As a technical point, note that the HeLaFLuc control cells used in Figure 2 were brighter than the control cells used in Figure 3B. This was because the HeLaFLuc control cells used in Figure 2 were selected to match FLuc expression from the same vector as 4XUb-FLuc, whereas the HeLaFLuc control cells used in Figure 3 were selected to match FLuc expression from the vector backbone for IκBα-FLuc. To independently validate these results, tumor homogenates, collected before and at various time points after administration of bortezomib, were analyzed for IκBα and IκBα-Fluc content by Western blot analysis (Figure 3C). A time-dependent increase in both endogenous IκBα and IκBα-Fluc reporter were observed in agreement with live-animal bioluminescence data (see Figure 3A). Overall, these data indicated that bortezomib rapidly stabilizes IκBα in vivo by inhibiting its basal turnover mediated by proteasomal degradation.
Real-time imaging of inhibition of substrate-specific proteasomal activity. HeLaIκBα-FLuc (A) or HeLaFLuc (B) tumor xenografts were established in NCr nu/nu mice. d-Luciferin-loaded pumps (release rate = 0.5 μL/h) were implanted ≈3 weeks postinoculation of the reporter cells. Twenty-four hours after pump implantation, mice were treated with bortezomib (1 mg/kg body weight, intravenously) and imaged for 85 minutes using the IVIS 100 imaging system. Shown is one representative of three animals each. Please also refer to supplementary movie 2 online. C, Western blot analysis of tumor homogenates collected at the indicated time points after intravenous administration of bortezomib (1 mg/kg body weight). NS = nonspecific.
Imaging IKK Inhibition
We next sought to determine whether pump-assisted imaging of luciferase reporters was suitable for capturing the complete pharmacodynamic profile of an orally administered drug after single-dose administration. We therefore examined PS-1145, an orally active IKK inhibitor drug candidate,28 using bioluminescence imaging. A prerequisite for achieving this aim was that in the absence of the drug, the signal would be stable throughout the experiment (days), even though the mice were subjected to repeated rounds of anesthesia, thermoequilibration, imaging, and recovery. HeLaIκBα-FLuc or control HeLaFLuc cells were subcutaneously inoculated in NCr nu/nu mice to generate tumor xenografts, and when tumors reached 5 to 7 mm in diameter, we implanted (subcutaneously) d-luciferin-loaded (50 mg/mL) pumps. Mice were intermittently imaged at 22, 21, 0, 2, 4, 8, 12, 20, 32, and 46 hours following oral administration of a single dose of PS-1145 (50 mg/g BW) or vehicle (0.5% methylcellulose). PS-1145 induced a time-dependent increase in the bioluminescence of HeLaIκBα-FLuc tumors, peaking at ≈12 hours and then gradually returning to baseline levels (Figure 4, A and B). In vehicle-treated mice or in mice treated with PS-1145 but bearing control HeLaFLuc tumors, only a slow and gradual increase in bioluminescence was observed (10–50% over 48 hours), probably reflecting tumor growth (see Figure 4B).
Imaging inhibition of IKK activity in vivo. HeLaIκBα-FLuc or HeLaFLuc tumor xenografts were established in NCr nu/nu mice. D-Luciferin-loaded pumps (release rate = 0.5 μL/h) were implanted ≈3 weeks postinoculation of the reporter cells. A, Representative bioluminescence images of a HeLaIκBα-FLuc tumor-bearing mouse, taken 2 hours before and at the indicated time points after oral administration of the IKK inhibitor PS-1145 (50 mg/kg body weight). B, Temporal changes in bioluminescence in vivo (22 to 46 hours) of HeLaIκBα-FLuc tumors induced by treatment with PS-1145 (50 mg/kg; closed circles; arrow) or vehicle (open circles), as well as temporal changes in bioluminescence of control HeLaFLuc tumors treated with PS-1145 (50 mg/kg; triangles). Data are normalized to initial (22 hours) values.
We have shown that this experimental setup provided a steady baseline for each mouse to serve as its own control, both when mice were continuously imaged in the IVIS system (see Figures 1–3) and when mice were sequentially and intermittently imaged in a multiday experiment (see Figure 4). We conclude that pump-assisted bioluminescence imaging in vivo is suitable for analysis of processes with time constants on the order of minutes, hours, and days.
Imaging Circadian Oscillations of the period1 Gene in a Rat Model
Two methods exist to continuously deliver the bioluminescent substrate: exogenous or endogenous pumps. Exogenous pumps have been used to deliver d-luciferin locally to the brain29 but can require restraining or tethering the animal for prolonged periods. To examine the feasibility of pumps for long-term imaging of oscillating transgenic reporters on repetitive cycles of anesthesia, imaging, and recovery, we imaged bioluminescence in rats transgenic for the period1 (per1) clock gene promoter driving FLuc expression. Local application of d-luciferin through a cannula to the OB was shown to produce local stable d-luciferin levels16 but was occasionally complicated when repeated injections resulted in infections or unreliable delivery of d-luciferin to target tissues. As an alternative approach, we found that an implanted micro-osmotic pump delivered sufficient d-luciferin for bioluminescence imaging of the brain to reveal a circadian rhythm in per1 gene activity (Figure 5). Although this daily rhythm was synchronized by the previous light-dark cycle with a peak during the night, it did not require the eyes or the suprachiasmatic nuclei, the major circadian pacemakers, to persist.16 Critically, use of the pumps eliminated difficulties associated with repeated d-luciferin injections, delivering a stable concentration of d-luciferin and resulting in a percentage of rhythmic recordings 20% higher than with local d-luciferin injection.
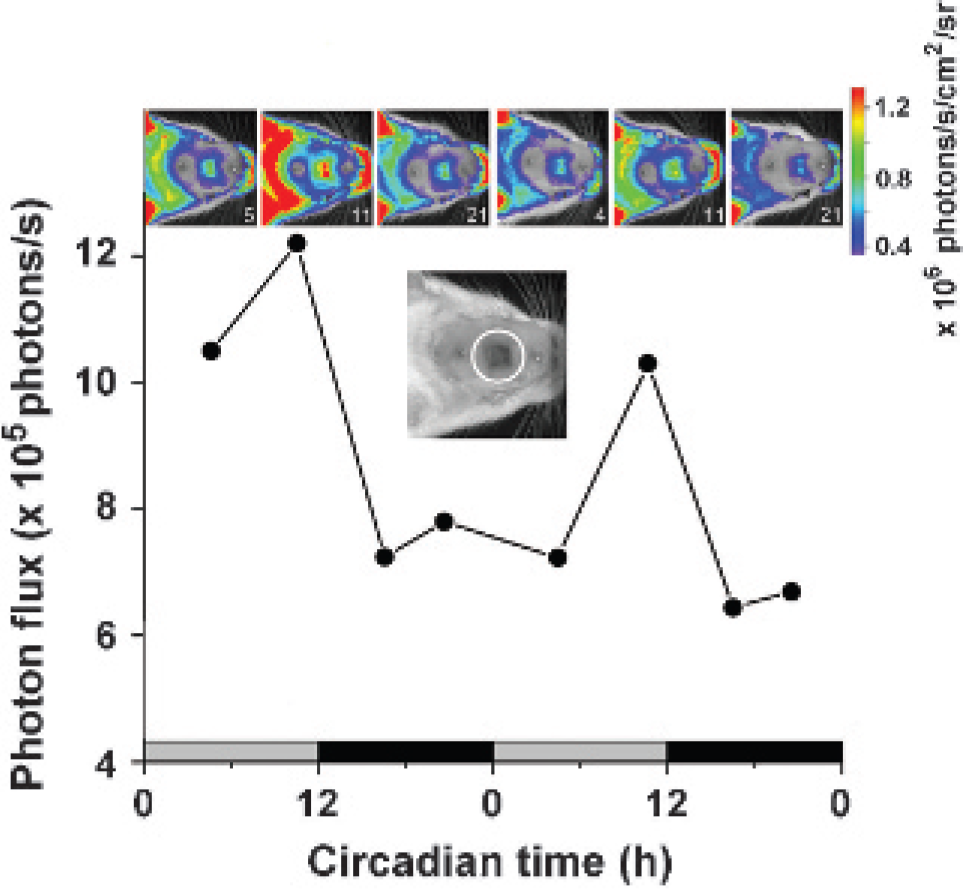
Imaging oscillations of the per1 gene in vivo. d-Luciferincontaining micro-osmotic pumps were used to monitor daily rhythms in clock gene (per1) expression in the olfactory bulb (OB) of live transgenic rats.16 One day prior to imaging, two osmotic pumps (release rate = 1 μL/h), each loaded with 78 mg/mL of d-luciferin, were implanted into the peritoneal cavity of a per1→FLuc transgenic rat. Clock gene expression in the OB was imaged through an agarose/glass window in the skull (see the dorsal view of a rat's head in the upper inset, OB window marked by a white circle). Pseudocolor images of 1-minute exposures, taken every 4 to 8 hours for 48 hours, show bioluminescence emitted from the rat's head (see the scale next to the images), particularly from the bare skin and the OB. Bioluminescence emitted from the OB of blind rats peaks at the end of the light phase to which they were previously entrained (circadian time 11, marked by gray [light] and black [dark] bars on the x-axis), on 2 consecutive days. The peak to trough ratio is approximately 2:1. White numbers on the image strip indicate at which circadian time the image was taken (0 = lights on in the previous light-dark cycle, 12 = lights off in the previous light-dark cycle).
To examine the kinetics of D-luciferin clearance, we recorded bioluminescence from one rat 4 days after pump implantation and then continued imaging after removal of the pump. Because bioluminescence rapidly declined to background levels within 3 hours after removal of the pump (Figure 6A), we concluded that pump-delivered D-luciferin did not accumulate in the body, nor was it stored in tissues and then released. We also varied the number or size of the pumps or the D-luciferin concentration within the pump and found that the log of the mean bioluminescence tightly correlated with the calculated D-luciferin release rates (Figure 6B), suggesting that under such conditions, [d-luciferin] Km. Constant D-luciferin release rates of up to 1.5 mg/h/kg BW were clearly not saturating in these animals; however, they still revealed circadian oscillations of per1 in the OB of 8 of 10 studied rats. Interestingly, we found that the two rats with the lowest rate of d-luciferin release (< 0.5 mg/h/kg BW) showed the lowest mean bioluminescence (but still well above background counts) and had no apparent circadian rhythmicity. We concluded that in these rats, d-luciferin levels were limiting; thus, the day-night difference in luciferase activity could no longer be detected. The minimal usable concentration of d-luciferin will likely depend on the reporter construct and species-specific factors that affect d-luciferin clearance. The ability to use less d-luciferin offers the added advantages of cost savings and minimization of any potential d-luciferin-related toxicity. These results show that osmotic pumps allow researchers to use low doses of D-luciferin to reliably record reporter activity for at least 5 days after pump implantation in the same animal.
Characterization of intraperitoneal delivery of d-luciferin by micro-osmotic pumps in the rat model. A, In vivo bioluminescence is abolished immediately after removal of the micro-osmotic pump. A per1→FLuc transgenic rat carrying a micro-osmotic pump loaded with d-luciferin (30 mg/mL) was repeatedly imaged at irregular intervals. Forty-eight hours after onset of imaging, the pump was removed (indicated by dashed line), and 3 hours following pump removal, bioluminescence had already dropped to background levels. Pseudocolor images, adjusted to the same scale, show bioluminescence emitted from the rat's head after 5-minute exposures immediately before and 3 hours after pump removal. B, Correlation between the release rate of d-luciferin (in mg/h/kg body weight) and the average measured bioluminescence. Mean bioluminescence was plotted on a logarithmic scale. The semilogarithmic plot shows a linear relationship with the rate of d-luciferin release (linear regression: r = .94; F value = 64.2; p > .0001; n = 10), indicating that mean bioluminescence increases exponentially with an increase in d-luciferin release rate.
In summary, this study technically characterizes continuous pump-assisted delivery of d-luciferin for bioluminescence imaging. We demonstrate its applicability for resolving meaningful physiologic and pharmacologic queries in mice and rats. We have shown the feasibility of using pump-assisted imaging both when animals are continuously imaged in a multihour experiment and when animals are intermittently imaged in a multiday experiment. Whereas systemic bolus reinjections of substrate can provide brighter signals, pump-assisted imaging greatly enhances temporal resolution. Both routes of delivery can be effective even when used at subsaturating levels of substrate at the target organ. Continuous delivery of D-luciferin by micro-osmotic pumps can provide a sensitive, noninvasive, and cost-effective strategy to study reporter activity in vivo as a function of physiologic and pharmacologic treatments.
Footnotes
*
Members and online subscribers to Molecular Imaging may view the supplementary movies at <>.
References
1.
GrossSPiwnica-WormsD. Spying on cancer: molecular imaging in vivo with genetically encoded reporters. Cancer Cell2005;7:5–15.
2.
ContagCRossB. It's not just about anatomy: in vivo bioluminescence imaging as an eyepiece into biology. J Magn Reson Imaging2002;16:378–87.
3.
UhrbomLNerioEHollandEC. Dissecting tumor maintenance requirements using bioluminescence imaging of cell proliferation in a mouse glioma model. Nat Med2004;10:1257–60.
4.
LyonsSKMeuwissenRKrimpenfortPBernsA. The generation of a conditional reporter that enables bioluminescence imaging of Cre/loxP-dependent tumorigenesis in mice. Cancer Res2003;63: 7042–6.
5.
CianaPRaviscioniMMussiP. In vivo imaging of transcriptionally active estrogen receptors. Nat Med2003;9:82–6.
6.
CarlsenHMoskaugJOFrommSHBlomhoffR. In vivo imaging of NF-kappa B activity. J Immunol2002;168:1441–6.
7.
RehemtullaAStegmanLDCardozoSJ. Rapid and quantitative assessment of cancer treatment response using in vivo bioluminescence imaging. Neoplasia2000;2:491–5.
8.
WangXRosolMGeS. Dynamic tracking of human hematopoietic stem cell engraftment using in vivo bioluminescence imaging. Blood2003;102:3478–82.
9.
ZhangGJSafranMWeiW. Bioluminescent imaging of Cdk2 inhibition in vivo. Nat Med2004;10:643–8.
10.
RehemtullaATanejaNRossBD. Bioluminescence detection of cells having stabilized p53 in response to a genotoxic event. Mol Imaging2004;3:63–8.
11.
LukerGPicaCSongJ. Imaging 26S proteasome activity and inhibition in living mice. Nat Med2003;9:969–73.
12.
LukerKESmithMCLukerGD. Kinetics of regulated protein-protein interactions revealed with firefly luciferase complementation imaging in cells and living animals. Proc Natl Acad Sci USA2004;101:12288–93.
13.
PaulmuruganRUmezawaYGambhirSS. Noninvasive imaging of protein-protein interactions in living subjects by using reporter protein complementation and reconstitution strategies. Proc Natl Acad Sci U S A2002;99:15608–13.
14.
GrossSPiwnica-WormsD. Real-time imaging of ligand-induced IKK activation in intact cells and in living mice. Nat Methods2005; 2:607–14.
15.
GrossSPiwnica-WormsD. Monitoring proteasome activity in cellulo and in living animals by bioluminescent imaging: technical considerations for design and use of genetically encoded reporters. Methods Enzymol2005;399:512–30.
16.
AbrahamUPriorJLGranados-FuentesD. Independent circadian oscillations of Period1 in specific brain areas in vivo and in vitro. J Neurosci2005;25:8620–6.
17.
NelsonDEIhekwabaAEElliottM. Oscillations in NF-kappaB signaling control the dynamics of gene expression. Science2004;306:704–8.
18.
HoffmannALevchenkoAScottMLBaltimoreD. The IkappaBNF-kappaB signaling module: temporal control and selective gene activation. Science2002;298:1241–5.
19.
PomereningJRKimSYFerrellJEJr. Systems-level dissection of the cell-cycle oscillator: bypassing positive feedback produces damped oscillations. Cell2005;122:565–78.
20.
Lev Bar-OrRMayaRSegelLA. Generation of oscillations by the p53-Mdm2 feedback loop: a theoretical and experimental study. Proc Natl Acad Sci U S A2000;97:11250–5.
21.
LahavGRosenfeldNSigalA. Dynamics of the p53-Mdm2 feedback loop in individual cells. Nat Genet2004;36:147–50.
22.
ParooZBollingerRABraaschDA. Validating bioluminescence imaging as a high-throughput, quantitative modality for assessing tumor burden. Mol Imaging2004;3:117–24.
23.
LemastersJJHackenbrockCR. Kinetics of product inhibition during firefly luciferase luminescence. Biochemistry1977;16:445–7.
24.
GammonSTLeevyWMGrossS. Spectral unmixing of multicolored bioluminescence emitted from heterogeneous biological sources. Anal Chem2006;78:1520–7.
25.
YamazakiSNumanoRAbeM. Resetting central and peripheral circadian oscillators in transgenic rats. Science2000;288:682–5.
26.
MountLE. Metabolic rate and thermal insulation in albino and hairless mice. J Physiol1971;217:315–26.
27.
KarinMBen-NeriahY. Phosphorylation meets ubiquitination: the control of NF-[kappa]B activity. Annu Rev Immunol2000;18:621–63.
28.
HideshimaTChauhanDRichardsonP. NF-kappa B as a therapeutic target in multiple myeloma. J Biol Chem2002;277:16639–47.
29.
YamaguchiSKobayashiMMitsuiS. View of a mouse clock gene ticking. Nature2001;409:684.