
Abstract
A dual probe with fluorescent and magnetic reporter groups was constructed by linkage of the near-infrared (NIR) fluorescent transferrin conjugate (TfNIR) on the surface of contrast agent-encapsulated cationic liposome (Lip-CA). This probe was used for magnetic resonance imaging (MRI) and optical imaging of MDA-MB-231-luc breast cancer cells grown as a monolayer in vitro and as solid tumor xenografts in nude mice. Confocal microscopy, optical imaging, and MRI showed a dramatic increase of in vitro cellular uptake of the fluorescent and magnetic reporter groups from the probe compared with the uptake of contrast agent or Lip-CA alone. Pretreatment with transferrin (Tf) blocked uptake of the probe reporters, indicating the importance and specificity of the Tf moiety for targeting. Intravenous administration of the dual probe to nude mice significantly enhanced the tumor contrast in MRI, and preferential accumulation of the fluorescent signal was clearly seen in NIR-based optical images. More interestingly, the contrast enhancement in MRI showed a heterogeneous pattern within tumors, which reflected the tumor's morphologic heterogeneity. These results indicate that the newly developed dual probe enhances the tumor image contrast and is superior to contrast agent alone for identifying the tumor pathologic features on the basis of MRI but also is suitable for NIR-based optical imaging.
TUMOR IMAGING exploits the differences in physical properties between malignant and normal tissues. These differences are often insufficient for good contrast resolution.1–3 Contrast-enhanced magnetic resonance imaging (MRI) is one of the best noninvasive methodologies available today in clinical medicine for assessing the anatomy and function of tissues. 4 High spatial resolution and high soft tissue contrast are desirable features of noninvasive MRI. However, owing to intrinsically low sensitivity, high local concentration of contrast agents (CAs) is required to generate detectable magnetic resonance contrast. A large amount of CA has to be used owing to the nonspecific uptake by tumors and other tissues in vivo. In recent years, targeted CA delivery systems have been developing based on the concept that molecular imaging can increase the signal to noise ratio by detecting differences in ‘molecular properties' between cancer and normal tissues.5–7 This should, in theory, allow for detection of smaller tumors. As one strategy, monoclonal antibodies or antibody fragments have been coupled with CA directly or linked with CA through liposome (Lip) carrier. However, insufficient direct linkage of gadolinium (Gd) with antibody or the relatively large molecular size of antibody-Lip-Gd particles may limit its use as a CA for imaging cell surface receptors in solid tumors because of inefficient extravasation and very slow diffusion in the interstitial compartment.2,8,9 Furthermore, antibody immunogenicity, poor stability of the conjugates, and potential change of the antibody binding ability owing to changes in surface antigens are still problematic for in vivo application. A ligand with less toxic, high binding specificity for tumors and relatively small size and without immunogenicity is required to target the CA to tumors.
Optical imaging offers several advantages over other imaging techniques. Among these are the simplicity of the technique, high sensitivity, and absence of ionizing radiation. There is increasing interest in the development of techniques for in vivo evaluation of gene expression, monitoring of gene delivery, and real-time intraoperative visualization of tumor margins and metastatic lesions to improve surgical outcome.10–12 Limited depth of light penetration and a lack of tomographic information prevent in vivo efficiency of optical imaging. To overcome the limitations of various imaging modalities, multimodal probes have been developed for detection using multiple imaging devices.13–15
Transferrin receptor (TfR) is a cell surface internalizing receptor that is responsible for almost all iron sequestration in mammalian cells. TfR is overexpressed in 74% of breast carcinomas, 76% of lung adenocarcinomas, and 93% of lung squamous cell carcinomas. The expression level of TfR receptor is of great value in grading tumors and determining prognosis.16,17 TfR has been successfully applied as a molecular target to direct therapeutic agents to tumor cells. 17 Transferrin (Tf), the TfR ligand, is a monomeric glycoprotein that binds Fe3+ for delivery to vertebrate cells through receptor-mediated endocytosis. Fluorescently labeled Tf has greatly aided the investigation of endocytosis in vitro. Tf has also been successfully used in targeted gene therapy in vivo.18,19 We hypothesized that near-infrared (NIR) dye-labeled Tf (TfNIR) would be an ideal ligand for targeting MRI and optical reporters to solid tumors, enabling better contrast-enhanced MRI and NIR-based optical detection. We developed a Tf- and Lip-mediated dual molecular probe with both fluorescent and magnetic reporter groups. The TfNIR was linked on the surface of Lip particles, whereas the MRI CA (Magnevist, obtained from Berlex Laboratories, Wayne, NJ) was encapsulated within the Lip. These components conjugated together and formed small uniform vesicles (less than 100 nm in diameter). In vitro analysis demonstrated that the probe dramatically improved the uptake of CA and NIR dye in monolayer cultures of MDA-MB-231-luc human breast cancer cells through both receptor- and Lip-mediated endocytosis. In vivo, the probe significantly enhanced the magnetic resonance signals from the MDA-MB-231-luc cells grown as solid tumor xenografts in nude mice and was superior to the CA alone for identifying the tumor morphology and infrastructure. Simultaneously, a significant preferential accumulation of fluorescent signal by the tumors was clearly detectable in TfNIR-based optical imaging.
Materials and Methods
Materials
Cationic lipids including 1,2-dioleoyl-sn-glycero-3-phosphoethanolamine (DOPE), 1,2-dioleoyl-3-trimethylammonium-propane (DOTAP), and fluorescent lipid DOPE-N-(7-nitro-2-1,3-benzoxadiazole-4-yl) (NBD-DOPE) were purchased from Avanti Polar Lipids (Alabaster, AL). They were premixed and dissolved in chloroform in a formula of DOTAP:DOPE (1:1 w/w) (Lip) or in a fluorescent formula of DOTAP:DOPE + 0.1% NBD-DOPE (LipNBD). Fluorescent Alexa fluor 680 conjugate of human Tf (TfNIR), a SelectFX nuclear labeling kit, Alexa fluor 680 fluorophore, and enzyme-free phosphate-buffered saline (PBS)-based cell dissociation solution were purchased from Invitrogen (Carlsbad, CA). Holotransferrin without fluorescent conjugate and MicroSpin G-50 columns were obtained from Sigma (St. Louis, MO) and Amersham Biosciences (Piscataway, NJ), respectively. The SPI-Pore polycarbonate membrane filter and filter holder were from Structure Probe Inc (West Chester, PA).
Preparation of the Molecular Dual Probe: TfNIR-LipNBD-CA Complex
The TfNIR-LipNBD-CA complex was constructed using TfNIR, cationic LipNBD, and Magnevist. Premixed LipNBD in chloroform (3.607 μL) was dried under a nitrogen stream and hydrated by adding 50 μL of water containing 12 μL of Magnevist. Each microliter of Magnevist contains 469.01 μg of gadopentatate dimeglumine. The hydrated LipNBD-CA mixture was homogenized using a vortex generator and incubated for 10 minutes. The volume of the mixture was adjusted to 175 μL with water. The mixture was then sequentially downsized by sonication (80–90 W, 10 minutes) in a water bath and by repeatedly passing through polycarbonate filters with decreasing pore diameter 0.2/0.1 μm. Following that, 25 μL of TfNIR (5 mg/mL) was mixed and incubated for at least 10 minutes. Gel filtration through a Sephadex G-50 column was used to remove unencapsulated CA and free TfNIR. A freshly prepared probe was used in all analysis. The final volume was 200 μL, and Lip: Tf:Magnevist composition was 10:12.5:0.56 (nmol/μg/mg). To monitor different components of the probe, nonfluorescent Tf and Lip were used instead of fluorescent TfNIR and LipNBD in some experiments.
Cell Culture and Animal Model
The MDA-MB-231-luc human breast cancer cell line (Xenogen, Alameda, CA) was used to test the efficiency of the probe in vitro and in vivo. This cell line is well documented for constitutional overexpression of TfR and has been transfected with the luciferase gene for luciferase-based optical imaging. (In this study, we did not use luciferase-based imaging.) Cells were routinely maintained in Dulbecco's Modified Eagle's Medium/F-12 medium supplemented with 10% heat-inactivated fetal bovine serum (FBS) and 50 μg/mL each of penicillin, streptomycin, and neomycin (Invitrogen). The solid tumor xenograft model was developed by subcutaneous injection of 1 × 10⁷ subconfluent cells in 100 μL Dulbecco's phosphate-buffered saline (DPBS) in the lower back of female athymic nude mice (8–10 weeks old; Harlan, Indianapolis, IN). The probe was evaluated in a total of 10 nude mice bearing tumors from 0.4 to 1.2 cm in diameter.
Confocal Microscopy
Tumor cells were grown on eight-chamber glass slides. Twenty-four hours later, the cells at 40 to 50% confluence were incubated with 25 μL of one of the following probes in 150 μL of medium without FBS and antibiotics. The probes included TfNIR-LipNBD-CA, Tf-LipNBD-dye, and dye alone. To visualize the cellular uptake of probe reporters, an NIR dye Alexa fluor 680 fluorophore was used to replace the CA in the preparation of Tf-LipNBD-dye probe at a concentration of 2 μL in a 200 μL total probe. Incubation was carried out for 5, 30, 60, and 120 minutes, separately. After PBS washing (three times), cells were fixed using 10% neutralized formalin for 10 minutes and cell nuclei were counterstained using 4′,6-diamidino-2-phenylindole dihydrochloride (DAPI) blue-fluorescence dye. Confocal images were acquired with a Zeiss LSM 510 Confocal Microscopy System (Carl Zeiss Inc, Thornwood, NY) using a 633 nm excitation line and emission LP 650 filter for TfNIR and Alexa fluor 680 fluorophore (red), 488 nm excitation line and emission BP 505 – 550 filter for LipNBD (green), and 364 nm excitation line and emission BP 385 – 470 filter for DAPI (blue). Following sequential excitation, red, green, and blue fluorescent images of the same cells were merged using the Zeiss AIM software for colocalization of the probe different reporters within cells.
In Vitro MRI and Optical Imaging
To quantify the cellular uptake of probe reporters, optical imaging and MRI of the cell pellets were performed. Similar numbers of tumor cells were seeded on 10 cm culture dishes for optical imaging and in 150 cm flasks for MRI. Cells grown to subconfluence were incubated with a 200 μL probe (in 3 mL medium) for 10 cm dishes and a 600 μL probe (in 10 mL medium) for 150 cm flasks. Differently labeled probes, such as TfNIR-LipNBD-CA, Tf-LipNBD-dye, LipNBD-dye, CA alone, and dye alone, were used. Incubation was carried out for 60 minutes. After PBS washing (three times), cells were collected using enzyme-free cell dissociation solution and adjusted to the same number. Cells were pelleted in microcentrifuge tubes by centrifugation. The cell pellets were quantified with respect to fluorescent intensity (FI) using the Xenogen IVIS 200 imaging system with excitation/emission filters at 679/702 nm for TfNIR and the Alexa fluor 680 fluorophore and at 464/531 nm for LipNBD measurement. Statistical analysis (Student's two-tailed t-test) of the FI for cells with different treatments was performed using Microsoft Excel. To obtain enough cells for MRI, cell pellets were pooled from five replicates. MRI was acquired using a Bruker 400 MHz NMR machine (Bruker-Biospin, Billerica, MA). A spin-echo (SE) imaging sequence was used to obtain T1-weighted images. The imaging parameters were as follows: echo time (TE) = 11.416 milliseconds, repetition time (TR) = 500 milliseconds, number of averages = 4, field of view = 20 × 20 mm, matrix size = 256 × 128, and slice thickness = 2 mm. A fast imaging with steady-state precession sequence was used for T1 measurement. The T1 measurement parameters were as follows: TE = 1.5 milliseconds, TR = 3 milliseconds, number of averages = 8, number of frames = 16, number of segments = 32, inversion delay = 49.2 milliseconds, and inversion repetition = 2572.3 milliseconds. The MRIs were taken in the cross-sectional view of the microcentrifuge tubes. The central slice image, which was not influenced by the image distortion owing to the susceptibility effect from the air-pellet boundary, was used for signal intensity measurement. All analyses were performed using the Bruker image sequence analysis tools. All experiments were repeated at least three times. The representative data are presented.
In Vivo MRI and Optical Imaging
The animal was anesthetized using 2% isoflurane and positioned with the tumor at the center of the coil. The physiologic condition of the animals was monitored using a respiratory gating device during the scanning. The tumor was scanned in the perpendicular direction of the tumor and animal skin interface using a Bruker 400 MHz, 89 mm NMR spectrometer. After a search for overall image quality, imaging time, and probe- and CA-mediated contrast enhancement using different imaging sequences and parameters, a multislice multiecho T1-weighted SE sequence was used for imaging studies, with a TR of 800 milliseconds, a TE of 11.4 milliseconds, and a slice thickness of 1 mm. For each animal, a baseline image was first obtained; the tumors were then sequentially imaged at an interval of 10 minutes until 3 hours following intravenous injection of 200 μL of TfNIR-LipNBD-CA probe (containing 12 μL of Magnevist) through the tail vein. This was equivalent to two times the Magnevist dosage used in the clinic. For comparative study, the same animals were also imaged following intravenous administration of the same dosage of Lip-CA and CA alone (12 μL of Magnevist in 200 μL of pure water). The interval period between the two MRI studies was at least 3 days to avoid any influence of CA from the previous imaging study. The direction of the tumor was marked each time with water-filled small balls and marker pens before imaging. For optical imaging, the FI of tumors was monitored from 10 minutes after administration of the probe to 3 to 5 days using a Xenogen IVIS 200 imaging system.
Pathologic Analysis
After imaging, the mice were autopsied and the tumors were sampled, fixed in 10% neutral buffered formalin, and embedded in paraffin. Tumors were sectioned in the same direction as MRIs based on the markers of the tumor border made before MRI. Hematoxylin-eosin staining was used for pathologic examination. A comparison was performed between the tumor pathology and the image enhancement pattern in MRI.
Results
Visualization of Tf- and Lip-Mediated Cellular Uptake
For confocal microscopic observation of the cellular uptake of the probe reporters, cells were incubated with the probe Tf-LipNBD-dye or dye alone from 5 minutes to 2 hours. Here the probe was constructed using unlabeled Tf and NIR fluorescent dye instead of CA to visualize the uptake of encapsulated reagents within Lip. Figure 1 shows representative microscopic images. Both LipNBD (green) and fluorescent dye (red) were observed to be present in the cell cytoplasm as early as 5 minutes after incubation with the probe, and their FI within the cytoplasm increased gradually, reaching a maximum at about 1 hour of incubation (see Figure 1, A-C). Interestingly, the LipNBD and dye accumulated again, forming multiple endosomes. These endosomes were mainly located at the peripheral area of the cytoplasm and became more evident at 2 hours of incubation (see Figure 1, D-F), suggesting receptor-mediated endocytosis and release or degradation of the probe reporters through the action of lysosomal enzymes. Cellular uptake of the dye was not evident in the cells incubated with dye alone.

Confocal microscopic observation of cellular uptake of probe reporters. Cells were incubated with the probe transferrin-liposome-nitrobenzoxadiazole (Tf-LipNBD)-dye for 5 minutes to 2 hours. A to C are representative images acquired at the 1 hour of incubation time point showing distribution and colocalization of LipNBD (A) and near-infrared (NIR) dye (B) in the cytoplasm. D to F are representative images acquired at the 2 hours of incubation time point showing multiple endosomes formed by Lip (D) and NIR dye (E) and colocalized in the peripheral area of the cytoplasm (F). Nuclei were counterstained using 4′,6-diamidino-2-phenylindole dihydrochloride (DAPI). Cells were imaged with a 63 × 1.4 NA Plan-Apochromat oil-immersion objective.
To visualize whether the Tf and Lip were co-internalized, confocal microscopy and optical imaging were performed for cells incubated with TfNIR-LipNBD-CA, LipNBD-CA, or CA alone. Similarly, from 5 minutes of incubation, the TfNIR (Figure 2A) and LipNBD (Figure 2B) were already colocalized within cell cytoplasm (Figure 2C). Optical imaging of the cell pellets further confirmed the uptake of the probe in tumor cells. To avoid membrane damage and probe leakage from cells, enzyme-free PBS-based cell dissociation solution was used instead of trypsin for cell dissociation from culture dishes. As shown in Figure 2D, only cells incubated with TfNIR-LipNBD-CA showed a strong fluorescent signal of TfNIR. Both cells incubated with TfNIR-LipNBD-CA and cells incubated with LipNBD-CA showed strong fluorescent signal of LipNBD (Figure 2E). Neither TfNIR nor LipNBD signal was detectable in cells incubated with CA alone.
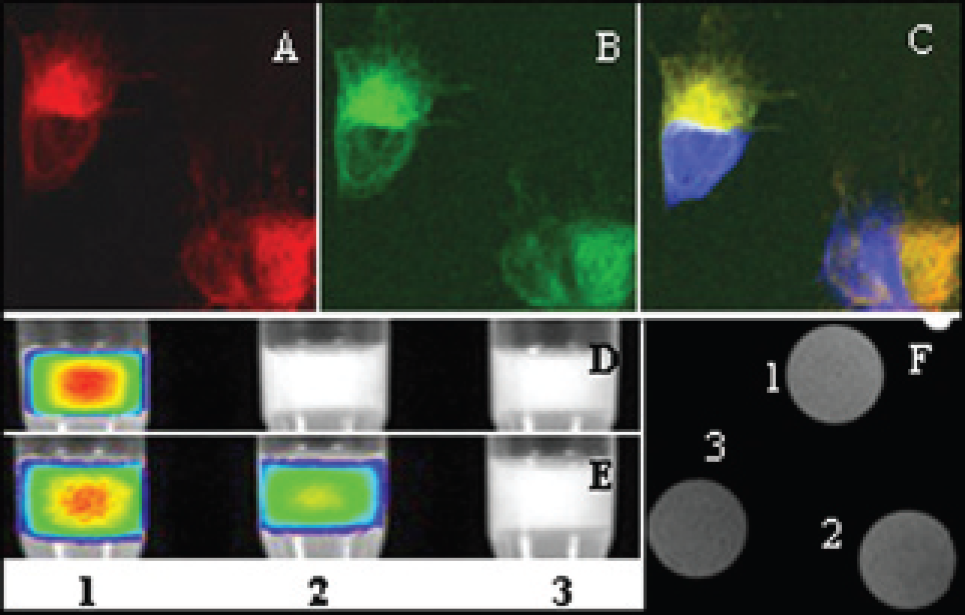
Confocal, optical, and magnetic resonance imaging (MRI) detection of the reporters in cells incubated with the probe near-infrared transferrin-liposome-nitrobenzoxadiazole-contrast agent (TfNIR-LipNBD-CA) for 1 hour. A to C are representative confocal microscopic images showing distribution and colocalization of TfNIR (A) and LipNBD (B) in cytoplasm. D to E are optical images of the cell pellets. A strong fluorescent signal of Tf is detected in cells incubated with TfNIR-LipNBD-CA (D, lane 1) but not in cells incubated with LipNBD-CA or with CA alone (D, lanes 2 and 3). Similarly, the strongest signal of LipNBD is detected in cells incubated with TfNIR-LipNBD-CA (E, lane 1) and less in cells incubated with LipNBD-CA (E, lane 2) but not in cells incubated with CA alone (E, lane 3). F shows the MRIs of the cell pellets. A stronger signal enhancement and T1 shortening are obtained in cells incubated with TfNIR-LipNBD-CA and in cells incubated with LipNBD-CA (1 and 2) than in cells incubated with CA alone (3). The MRI parameters are as follows: echo time = 11.416 milliseconds, repetition time = 500 milliseconds, number of averages = 4, field of view = 20 × 20 mm, matrix size = 256 3 128, and slice thickness = 2 mm.
We further evaluated whether the CA encapsulated within the probe was internalized into tumor cells using MRI of the cell pellets. A representative MRI of the cell pellets obtained from cells incubated with TfNIR-LipNBD-CA, LipNBD-CA, or CA alone is shown in Figure 2F. The corresponding signal intensity and T1 relaxation time are shown in Table 1. Cells incubated with the probe TfNIR-LipNBD-CA or LipNBD-CA showed a much greater positive contrast and T1 shortening than the cells incubated with CA alone. The T1 relaxation time shortened from 408 milliseconds for CA alone to 374 milliseconds for LipNBD-CA and 366 milliseconds for TfNIR-LipNBD-CA (p < .05). The cells incubated with TfNIR-LipNBD-CA also showed higher signal intensity than the cells incubated with LipNBD-CA. These results highly indicate the importance and specificity of Tf moiety for targeting the probe internalization into tumor cells in vitro. The difference in signal intensity and T1 relaxation time mediated by LipNBD-CA and by CA alone might reflect the effective fusion of Lip with tumor cell membrane.
Comparison between Probe- and Contrast Agent-Mediated Signal Enhancement

CA = contrast agent; Lip = liposome; NBD = nitrobenzoxadiazole; NIR = near-infrared; Tf = transferrin.
p < .05 between probe and CA alone for both relative intensity and T1.
Quantification of Tf- and Lip-Mediated Cellular Uptake
To evaluate the efficiency of Tf- and Lip-mediated cellular uptake, the FI of the LipNBD and NIR dye within the tumor cells was quantified following 1 hour's incubation of the cells with probes. The FI of NIR dye in the cells incubated with Tf-LipNBD-dye and with LipNBD-dye was more than 200-fold higher than that in the cells with dye alone (Table 2). Cells incubated with dye alone showed a similar level of FI to cells without probe and dye exposure (autofluorescence background). Approximately 1.5-fold higher FI of the intracellular NIR dye was observed in cells incubated with Tf-LipNBD-dye than in cells incubated with LipNBD-dye. Similarly, 2-fold higher FI of LipNBD was detected in cells incubated with Tf-LipNBD-dye or LipNBD-dye than in cells incubated with NIR dye alone (autofluorescent background) (see Table 2). The FI of LipNBD was 1.3-fold higher in cells incubated with Tf-LipNBD-dye than in cells incubated with LipNBD-dye. Student's t-tests (two-tailed) between cells incubated with probe and with dye alone for both intracellular LipNBD and NIR dye intensity were both significantly different (p < .05). The FI in cells incubated with Tf-LipNBD-dye and in cells incubated with LipNBD-dye was also significantly different (p < .05) for both intracellular LipNBD and NIR dye uptake.
Optical Quantitation of Probe-Mediated Cellular Uptake of Reporters

Lip = liposome; NBD = nitrobenzoxadiazole; NIR = near-infrared; Tf = transferrin.
p < .05 between probe and dye alone and also between Tf-LipNBD dye and LipNBD dye for both dye and LipNBD uptake. Quantitation is based on the fluorescence intensity (p/s/cm2/sr) of cell pellets.
To further test the specificity of Tf-mediated cellular uptake, cells were first pretreated for 1 hour with unlabeled Tf before incubation with the probes. The amount of Tf was threefold (375 μg/dish) higher than that used in the probe (125 μg/dish). Following incubation with the probe Tf-LipNBD-dye, the FI of the NIR dye in cells with and without Tf pretreatment was 2.45 × 10⁹ and 3.42 × 10⁹ p/s/cm2/sr, respectively (Table 3). The FI of the LipNBD in cells with and without Tf pretreatment was 2.57 × 10⁷ and 3.45 × 10⁷ p/s/cm2/sr, respectively. Calculation based on the control cells incubated with LipNBD-dye revealed a blockage of 65.6% of the dye uptake and 70.97% of the LipNBD uptake by Tf pretreatment. These results indicate that the probe reporter uptake in vitro was mediated by both Tf and cationic Lip. Tf and Lip have an apparent synergistic effect on the cellular uptake of the probe reporters.
Blockage of Transferrin-Mediated Uptake of Reporters by Transferrin Pretreatment

Lip = liposome; NBD = nitrobenzoxadiazole; NIR = near-infrared; Tf = transferrin.
p < .05 between pretreated and untreated cells for both dye and LipNBD uptake. Quantitation is based on the fluorescence intensity (p/s/cm2/sr) of cell pellets.
Probe-Mediated Signal Enhancement of the Tumors In Vivo
Signal enhancement was evaluated in 10 athymic nude mice with solid tumor xenografts. The tumor size ranged from 0.4 to 1.2 cm in diameter. To compare the signal enhancement mediated by the probe and mediated by the CA alone, the same mice were used for the probe and CA-alone studies sequentially with an interval of at least 3 days. Intravenous administration of the probe TfNIR-LipNBD-CA significantly enhanced the tumor image contrast (Figure 3). The enhancement was observed as early as 10 minutes after administration and increased gradually, reaching the maximum at 90 minutes to 2 hours. After that, a gradual decrease in the signal enhancement was observed. Interestingly, the enhancement was greatly heterogeneous within the tumors (see Figure 3). The enhancement pattern became relatively consistent from 1 to 3 hours. Some areas of the tumors were strongly enhanced initially, whereas other areas were weakly enhanced. The signals from the strongly enhanced region decreased much more slowly than the signals from the region with weak enhancement. For small tumors, the enhancement was relatively uniform and the enhancement was usually observed starting from the peripheral area. Magnevist alone slightly enhanced the image contrast of tumors compared with the baseline images (Figure 4). The maximum enhancement was usually observed at 30 to 60 minutes after injection. The image contrast enhancement started from the peripheral area to the center of the tumors and was relatively uniform within tumors irrespective of the sizes studied here. The signal enhancement decreased rapidly and returned to baseline within 3 hours. The pharmacokinetics of pure Magnevist was different from that of Tf-labeled Magnevist containing Lip. Magnevist containing Lip without linkage to Tf showed a much weaker signal enhancement than either CA alone or TfNIR-LipNBD-CA.

In vivo time course of tumor magnetic resonance imaging (MRI) after intravenous administration of the probe transferrin-liposome-nitrobenzoxadiazole-contrast agent (TfNIR-LipNBD-CA) showing gradually increased enhancement of the tumor signal (arrow) and a heterogeneous enhancement pattern. Gradual accumulation of contrast agent in the urinary bladder is evident (*). The MRI parameters are as follows: echo time = 11.416 milliseconds, repetition time = 800 milliseconds, number of averages = 4, field of view = 28 × 30 mm, matrix size = 256 × 192, and slice thickness = 1.0 mm.

Comparison of the signal enhancement by contrast agent (CA) alone (A-B) and by the probe transferrin-liposome-nitrobenzoxadiazole-contrast agent (TfNIR-LipNBD-CA) (C-D). The magnetic resonance images (MRIs) are from the same tumor, with an interval of 72 hours between studies with the probe and with CA alone. A stronger, heterogeneous signal enhancement is achieved with TfNIR-LipNBD-CA over CA alone. The MRI parameters are the same as for Figure 3.
Detection and Dynamic Change of the Fluorescent Signal in Tumors In Vivo
To understand whether the probe was preferentially accumulated in tumors and whether the fluorescent signal was optically detectable in vivo, tumors were monitored using TfNIR-based optical imaging. The fluorescent signal was clearly detectable as early as 10 minutes and reached the maximum intensity at about 90 minutse to 2 hours after intravenous injection of the probe TfNIR-LipNBD-CA (Figure 5). The FI was related to the tumor sizes, and significant FI was still detectable after 2 days for larger tumors (usually > 0.8 cm in diameter). The FI of smaller tumors became very weak at 24 hours. The FI of LipNBD was too weak to be detectable by optical imaging in vivo, although it was clearly detected ex vivo. High background fluorescence was another reason for the failure to detect LipNBD in tumors. Following intravenous injection, the probe was rapidly distributed throughout the body and was first taken up by the well-perfused organs, such as the liver, spleen, lung, and bone marrow. However, the probe was rapidly washed out from these organs but not from solid tumors. The uptake of the probe in tumors was enhanced because of binding to TfR in the tumor. After the initial rapid increase in the background fluorescence following injection of the probe, the background fluorescence decreased rapidly, as shown in Figure 5H. The tumor to normal (contralateral muscle) ratio varied from 1.3 to 3.4 at the different time points following injection (from 10 minutes to 48 hours), which was related to the tumor sizes. Small tumors (less than 3 mm in diameter) showed less fluorescent signal, perhaps owing to differences in vasculature. Similar to the MRI finding, fluorescent dye containing Lip without Tf linkage failed to induce a preferential increase in fluorescent signal in tumors.
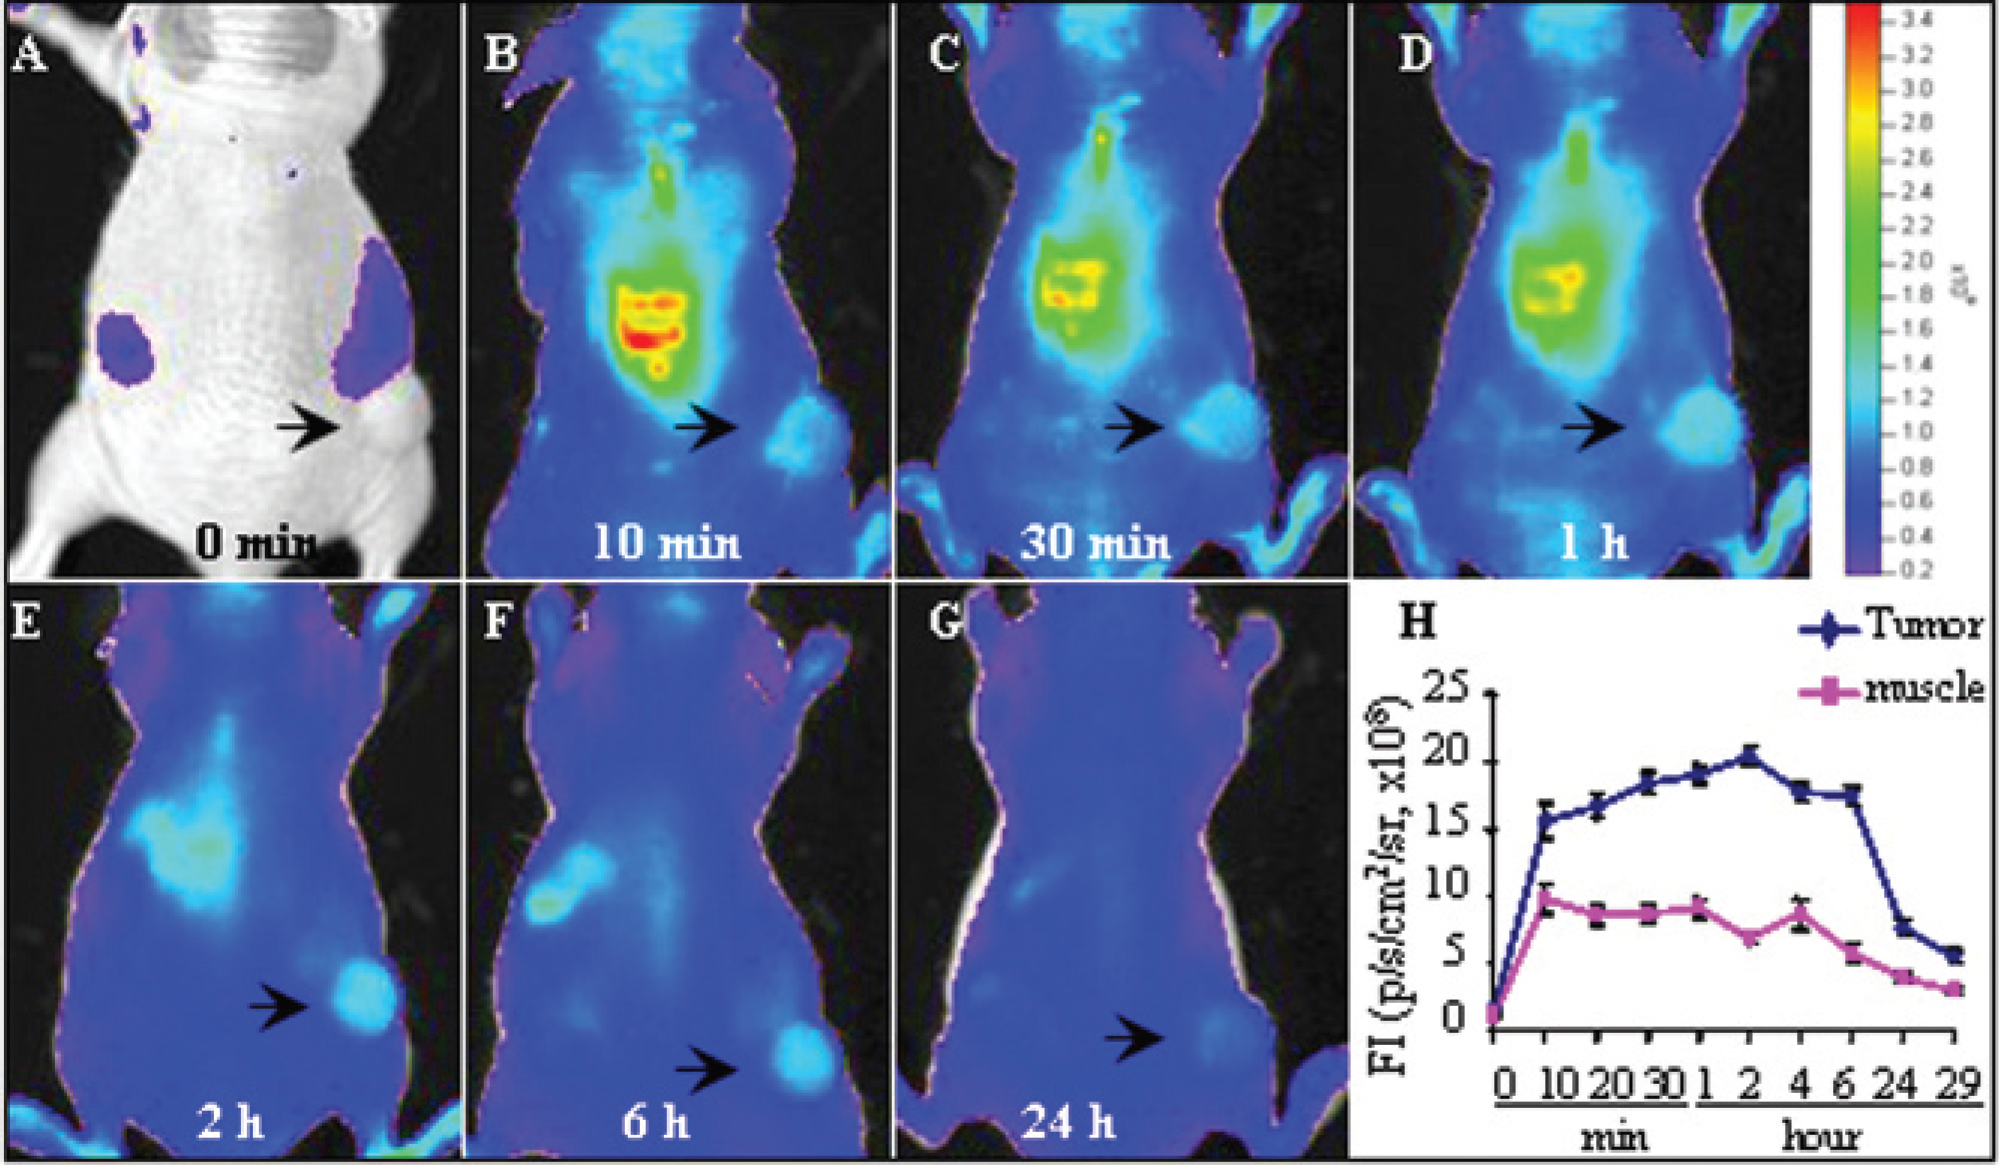
Optical imaging of the tumor after intravenous administration of transferrin-liposome-nitrobenzoxadiazole-contrast agent (TfNIR-LipNBD-CA) showing preferential accumulation of fluorescent signal in tumors (A-G). The fluorescence signal was detectable as early as 10 minutes and reached a maximum at about 2 hours and then deceased gradually. H shows the plot of time versus signal intensity obtained from the tumor and the contralateral muscle. The signal intensity is expressed as p/s/cm2/sr.
Comparison between MRI Signal Enhancement and Pathologic Findings
To understand the underlying mechanism of heterogeneous contrast enhancement within the tumors by the probe, a comparative analysis was performed between MRI signal enhancement and pathologic findings (Figure 6). Pathologically, the tumor cells in large tumors with heterogeneous enhancement usually presented various stages of growth and necrosis. In some areas, the tumor cells were completely necrotized and became amorphous and liquefied. In some other regions, the tumor cells showed dying features such as condensed or broken nuclei or only shadow cells remaining. The highly enhanced regions of the tumors in MRIs represented the more actively proliferating tumor cells, whereas the weakly enhanced areas contained less active or dying cells. The completely necrotized region showed the least enhancement. The heterogeneous signal enhancement by the probe was well correlated with the in vivo morphologic features of the tumors.

Correlation of magnetic resonance imaging (MRI) with pathologic findings showing high consistency between the probe-mediated enhancement pattern in MRI and pathologic findings (hematoxylin-eosin stain). A is a representative MRI (same as Figure 3) showing a heterogeneous enhancement pattern. B shows a region with high proliferation and necrosis (X250 original magnification). C shows the stromal tissue (X250 original magnification), and D shows the proliferating tumor cells with high mitotic activity (X400 original magnification). N = necrosis; P = proliferating cells; S = stromal tissue.
Discussion
The human Tf-targeted cationic Lip—deoxyribonucleic acid (DNA) complex has been used for efficient gene transfer in animal models recently. The formulation for optimal transfection of cancer cells has been optimized as a DNA:lipid:Tf ratio of 1 μg:10 nmol:12.5 μg with Lip composition of DOTAP:DOPE (1:1, w/w). This complex of Tf-Lip-DNA demonstrates a highly compact structure that resembles a virus particle with a dense core enveloped by a membrane coated with Tf molecules spiking the surface.20,21 Successful gene delivery using Tf-targeted cationic Lip is based on the fact that TfR is overexpressed in various malignant tumors and Tf-TfR-mediated endocytosis is highly efficient. Furthermore, cationic Lip has many advantages, such as high encapsulation capacity, much less immunogenicity and toxicity, and dramatically increased transfection efficiency through linkage with ligands. 22 These characteristics of this system also fulfill the criteria for an ideal system for molecular imaging in vivo. Using the advantages of this system, we developed the probe with both NIR fluorescence and MRI reporters, which is suitable for both optical and nuclear MRI.
Use of the NIR fluorescence molecule minimizes the autofluorescence interference from healthy tissue and allows the visualization of tissues millimeters in depth because of efficient penetration of photons in the NIR range.11,12 To encapsulate the CA, we directly hydrated the dried Lip films with concentrated CA solution and downsized the Lip-CA complex by sonication and repeated passing through the membrane before linkage with Tf. The Lip:Tf ratio (10:12.5) used in the probe was optimized as reported previously.20–24 The dosage of Magnevist was 0.2 mmol/kg, corresponding to two times the recommended dose for the patient. For this amount of Magnevist (even threefold more), almost all of the Magnevist was found to be encapsulated within the Lip, as estimated by gel filtration and fluorescence study. Our previous study also confirmed Magnevist encapsulation within Lip using scanning electron microscopy and scanning probe microscopy. 25 The Tf, cationic Lip, and Gd complex was coupled through charge interaction, which makes the preparation of the probe simple enough to be freshly prepared before use. A concern for Lip carrier, as in the gene delivery, is its size. It has been reported that linkage with Tf condenses the Lip-DNA complex with a uniform size of 50 to 90 nm.20,23 After sonication of the probe, we found that repeated passing through 200 and 100 nm polycarbonate membranes resulted only in a loss of less than 10% of the probe and the majority of the probe particles were within 100 nm in size based on the fluorescence measurement of the probe. Transportation of the probe across tumor vessels occurs via open gaps, vesicular vacuoles, and/or fenestrations. A characteristic pore cutoff size is measured ranging from 200 nm to 1.2 μm in tumors. 26 Another analysis points out that the pore cutoff size is around 400 nm based on in vivo fluorescence microscopy studies of the transportation of sterically stabilized Lip into solid tumors. 27 Therefore, the size of our probe should not be a limitation to transport from tumor vasculature into tumor cells.
We first evaluated the probe-mediated uptake efficiency of the reporters in vitro. To visualize and quantify the efficiency, the components of the probe were differentially labeled. On confocal microscopy, TfNIR, LipNBD, and the encapsulated NIR dye were clearly codistributed within the cytoplasm of tumor cells. They accumulated and formed endosomes again in the peripheral area of the cytoplasm. In Tf-Lip-mediated plasmid DNA transfection, similar endosome formation has been reported by Lee and Kim. 28 They also found nuclear localization of the Tf-Lip. In our system, no nuclear signal of the probe was observed. Quantitative analysis using optical imaging further confirmed the finding of confocal microscopy. The cellular uptake was mediated by both Tf and Lip. Blockage of the TfR with Tf led to significantly decreased uptake. The possibility of nonspecific binding to free NIR dye was excluded because no fluorescent signal of the dye was detected in cells incubated with dye alone. Higher cellular uptake of the Lip and dye in cells incubated with LipNBD-dye without Tf linkage than in cells incubated with dye alone is not surprising. The probe reporters are taken up in vitro by two different pathways. One is due to Lip-mediated endocytosis and membrane fusion process because Lip is an effective transfection reagent. 22 The other is due to binding to TfR. The pretreatment with Tf is not expected to prevent endocytosis of the probe reporters owing to Lip fusion with the cell membrane. Importantly, Tf and Lip showed a synergistic effect on the probe uptake by cells based on our quantitative and blocking analysis. MRI of the cell pellets revealed a similar finding that CA is internalized and the internalization is mediated by both Tf and Lip. The apparent synergistic effect may be explained by a three-step mechanism. The important first step is the specific binding of Tf with TfR on the cell surface followed by the interaction of cationic Lip with anionic cell membrane and finally the receptor- and Lip-membrane fusion-mediated endocytosis. 29
For MRI study, a T1-weighted imaging technique was used to evaluate the positive contrast enhancement mediated by our probe. The actual T1 shortening in vivo depends on the accumulation of the probe in time, which, in turn, depends on tumor physiology. We have searched the best imaging strategy by using different imaging sequences and by varying the imaging parameters. The choice of SE sequence with TR = 800 milliseconds and TE = 11.4 milliseconds was based on the consideration of overall image quality, imaging time, and the differences of contrast enhancement between the probe and CA-alone studies. Consistent with our in vitro findings, specific targeting of the probe in vivo was demonstrated by both optical imaging and MRI. A preferential accumulation of the fluorescent signal in tumors and a significant signal enhancement are clearly achieved with the dual probe but not with CA alone. Time course study revealed a high consistency among confocal images, optical fluorescence, and MRI contrast enhancement. The maximum signal enhancement and FI in tumors are seen at ≈90 minutes, and both reach a plateau (which includes the maximum) between 1 and 3 hours after intravenous injection, whereas the maximal magnetic resonance contrast enhancement is achieved at about 45 minutes following administration of CA alone and the enhancement reduces to baseline within 3 hours. The magnetic resonance signal enhancement achieved by the dual probe is much stronger than that achieved by the CA alone. These results are consistent with the finding in gene therapy using a Tf-mediated Lip system that high gene transfection efficiency is observed within tumors.23,24 More interestingly, heterogeneous enhancement in MRIs is evident in large tumors, which correlates well with the histologic findings. Within the range of tumor sizes in the present study, CA alone could enhance the image contrast, but the enhancement was weak and relatively uniform. Heterogeneous enhancement that could be correlated with histology may be potentially valuable. It makes it possible to interpret the pathologic features based on specifically enhanced MRI. More information could be provided to the clinician without further invasive procedure of biopsy.3,30 In vivo, significant uptake of the probe reporters was not observed in the case of Magnevist or fluorescent dye containing Lip without linkage to Tf. This may be explained by the fact that the majority of the Lip accumulated within well-perfused organs, such as the liver, spleen, bone marrow, and lung. The uptake and retention of Magnevist or fluorescent dye containing Lip were very low in tumors. This is in contrast to the uptake of Lip bound to Tf. Positive CA may be superior to the negative CA, such as an iron oxide probe. A decrease in the image intensity by negative CA will complicate interpretation of tumor necrosis and poor expression of target receptors. The advantages of using a superparamagnetic Tf-labeled iron oxide probe are the small size and long-range T2 effect. Because of the long-range T2 effect, it requires less compound for a greater image intensity change. Our probe can be used for optical detection of tumors and is potentially useful for imaging the expression level of TfR and tumor cell growth. These parameters are of great value in predicting the prognosis and treatment selection. This goal can be achieved by measuring the intensity of fluorescence in optical images. However, limited penetration of fluorescence is still a problem, particularly for deep organ tumors. Clearly, use of multimodality reporter constructs can overcome many of the shortcomings of each modality alone.14,15
In conclusion, we have described a novel nano-sized molecular probe with both optical and MRI reporters. In vitro and in vivo analysis confirmed the probe specificity, internalizing efficiency, and sufficiency for multimodality detection. In MRI, the probe significantly enhances the tumor contrast so that it can increase the sensitivity to detect small tumors. The tumor enhancement pattern could help evaluate the pathologic features of tumors in vivo, which provides more information for the clinician. Preferential accumulation of the probe NIR fluorescence makes the tumor detectable using NIR-based optical imaging. Furthermore, it provides the possibility of quantifying the specific biomarkers expressed in tumors, which will be helpful to determine the patient's prognosis and response to treatment.
Footnotes
Acknowledgments
We thank Dr. Elizabeth G. Snyderwine and Dr. Minshu Yu (Laboratory of Experimental Carcinogenesis, National Cancer Institute [NCI], NIH) for their scientific advice. We are grateful to Stephen M. Wincovitch and Susan H. Garfield (CCR Confocal Microscopy Core Facility, NCI, NIH) for help and consultation with confocal microscopy.